. 2024 Feb 14:14:1277365.
doi: 10.3389/fimmu.2023.1277365. eCollection 2023.

Ehf and Fezf2 regulate late medullary thymic epithelial cell and thymic tuft cell development

Affiliations

Ehf and Fezf2 regulate late medullary thymic epithelial cell and thymic tuft cell development

Sören Lammers et al. Front Immunol. .

Abstract

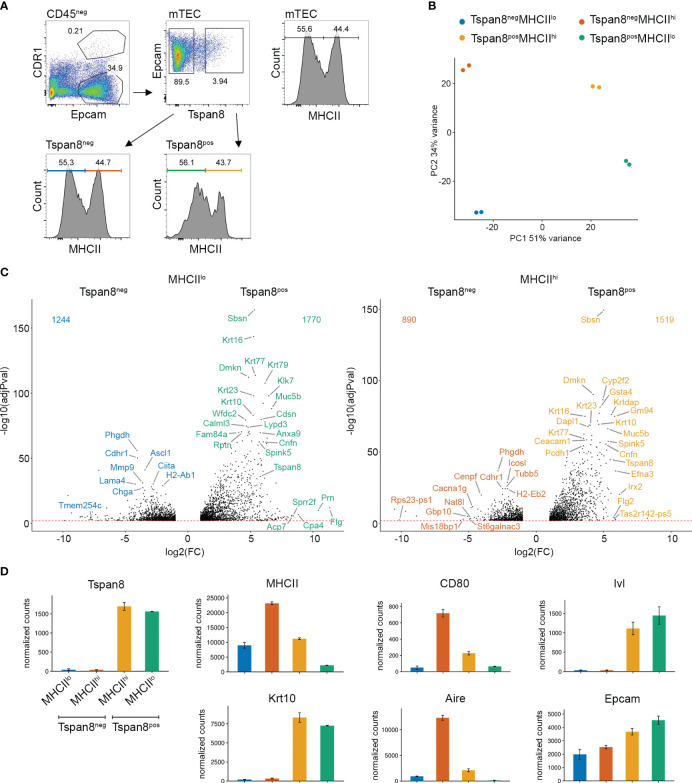
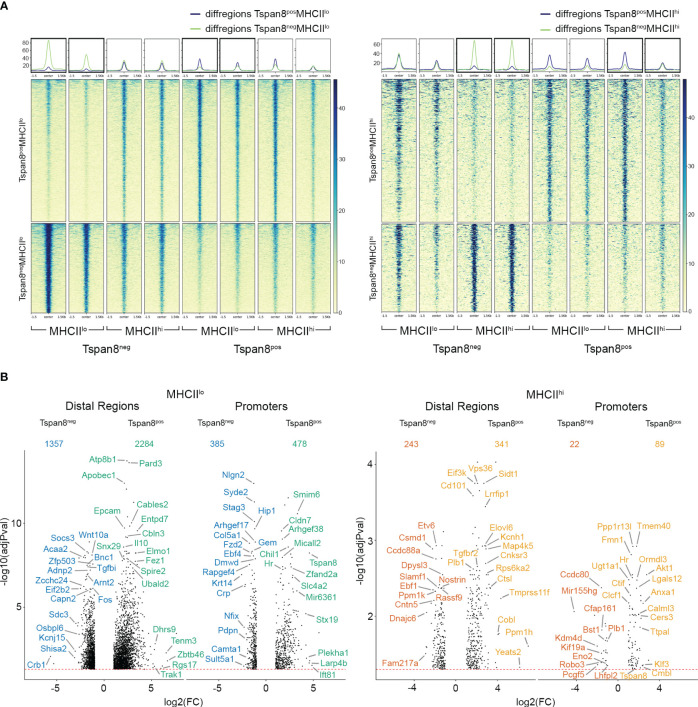
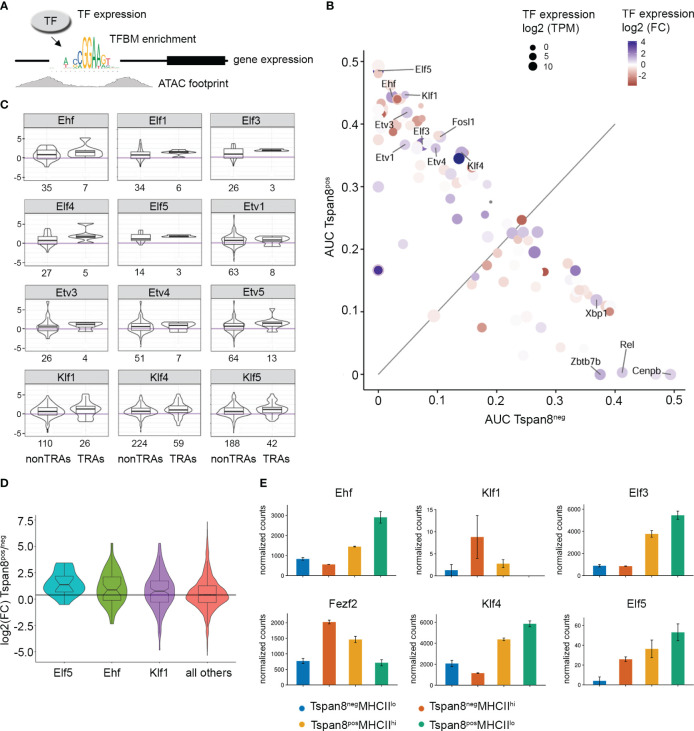
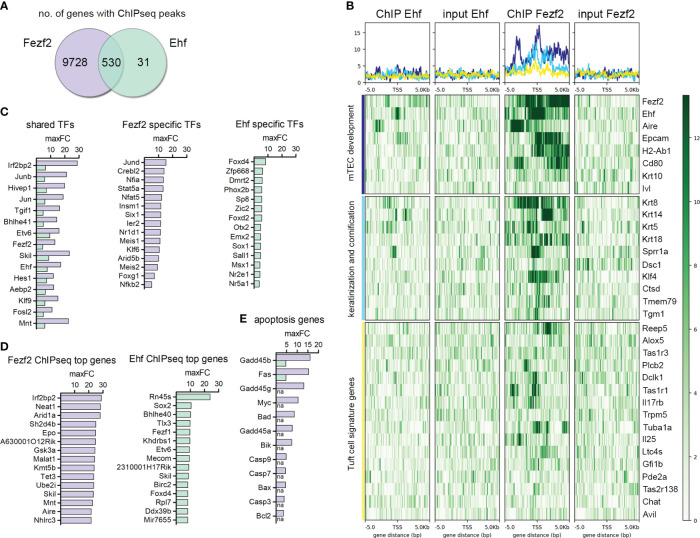
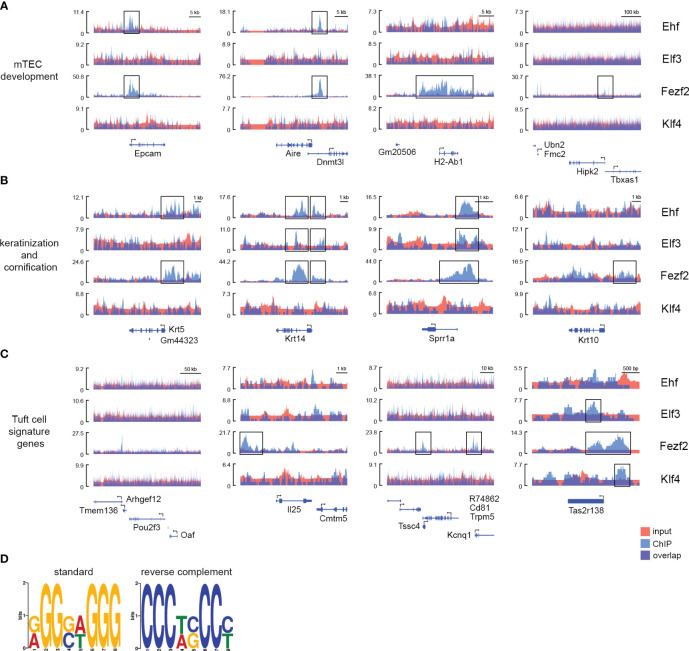
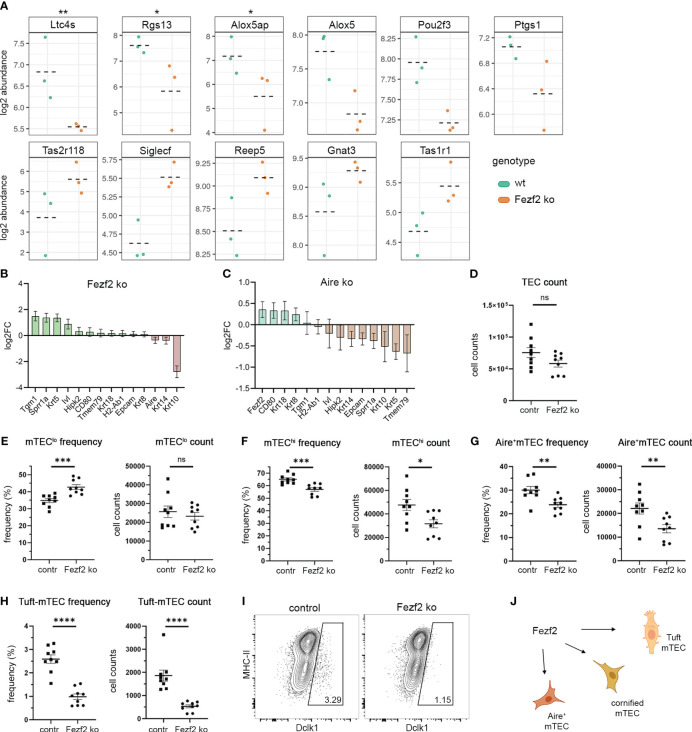
Thymic epithelial cells are indispensable for T cell maturation and selection and the induction of central immune tolerance. The self-peptide repertoire expressed by medullary thymic epithelial cells is in part regulated by the transcriptional regulator Aire (Autoimmune regulator) and the transcription factor Fezf2. Due to the high complexity of mTEC maturation stages (i.e., post-Aire, Krt10+ mTECs, and Dclk1+ Tuft mTECs) and the heterogeneity in their gene expression profiles (i.e., mosaic expression patterns), it has been challenging to identify the additional factors complementing the transcriptional regulation. We aimed to identify the transcriptional regulators involved in the regulation of mTEC development and self-peptide expression in an unbiased and genome-wide manner. We used ATAC footprinting analysis as an indirect approach to identify transcription factors involved in the gene expression regulation in mTECs, which we validated by ChIP sequencing. This study identifies Fezf2 as a regulator of the recently described thymic Tuft cells (i.e., Tuft mTECs). Furthermore, we identify that transcriptional regulators of the ELF, ESE, ERF, and PEA3 subfamily of the ETS transcription factor family and members of the Krüppel-like family of transcription factors play a role in the transcriptional regulation of genes involved in late mTEC development and promiscuous gene expression.

Keywords: Ehf; Fezf2; Tuft cells; central tolerance; medullary thymic epithelial cell; thymus.


Conflict of interest statement

The authors declare that the research was conducted in the absence of any commercial or financial relationships that could be construed as a potential conflict of interest.

Figures

Figure 1
Figure 1
Co-expression groups in MHCII low and high Tspan8pos mTEC populations analyzed by RNA sequencing. (A) FACS gating strategy for Tspan8pos mTEC isolation. Pregated on life-singlets-CD45neg, mTECs are isolated as EpcamposCDR1neg. (B) Principal component analysis of Tspan8negMHCIIlo (blue), Tspan8negMHCIIhi (red), Tspan8posMHCIIlo (green), and Tspan8posMHCIIhi (orange) mTECs using the top 1000 variable genes from the RNA sequencing. (C) Volcano plots of differential gene expression between Tspan8negMHCIIlo (blue) compared to Tspan8posMHCIIlo (green) left panel and Tspan8negMHCIIhi (red) compared to Tspan8posMHCIIhi (orange) right panel. (D) Normalized gene expression counts for Tspan8, MHCII, CD80, Ivl, Krt10, Aire, and Epcam in Tspan8negMHCIIlo (blue), Tspan8negMHCIIhi (red), Tspan8posMHCIIhi (orange) and Tspan8posMHCIIlo (green) mTEC populations. Normalized mean counts ± SEM. See also Supplementary Figure 1.
Figure 2
Figure 2
Differential ATAC-seq reads in Tspan8pos compared to Tspan8neg mTEC subpopulations. (A) Differential ATAC reads in Tspan8posMHCIIlo compared to Tspan8negMHCIIlo on the left and Tspan8posMHCIIhi compared to Tspan8negMHCIIhi on the right. Heatmaps show normalized reads within +/- 1.5 kb around the differential regions. (B) Volcano plot showing differential ATAC reads between Tspan8negMHCIIlo (blue) compared to Tspan8posMHCIIlo (green), left panel and Tspan8negMHCIIhi (red) compared to Tspan8posMHCIIhi (orange), right panel. The nearest genes to the differential distal regions and promoter regions are depicted. Numbers indicate the total amount of genes identified for each classification. See also Supplementary Figures 2, 3.
Figure 3
Figure 3
Identification of candidate transcription factors responsible for the regulation of gene expression in Tspan8pos mTECs by correlation of differential ATAC-seq footprinting with the corresponding transcription factor and target gene expression. (A) Schematic representation of the experimental setup. A combinatorial enrichment analysis (Tspan8pos vs. Tspan8neg) was performed for transcription factor expression with corresponding enrichment of the specific TFBM in the promoter region, ATAC footprint signal, and target gene expression. (B) Area under the curve (AUC) values of differential footprint enrichment in TRA gene promoters are plotted for Tspan8pos MHCIIlo compared to Tspan8neg MHCIIlo mTECs. Dot size shows the transcription factor (TF) expression in log2 transcripts per million (TPM). Color code indicates the log2 fold change of TF expression between Tspan8pos and Tspan8neg. (C) Expression of nearest genes (log2 fold change) to differential ATAC peak with respective TF footprint for Tspan8pos compared to Tspan8neg mTECs. Numbers indicate the total number of target genes of the corresponding TF for non-TRAs (left bar) and TRAs (right bar) each. (D) Expression of nearest genes to differential ATAC peak with respective TF footprint; shown is the log2 fold change of gene expression (Tspan8pos vs. Tspan8neg) for the transcription factors Elf5, Ehf, and Klf1. (E) Normalized gene expression counts for Ehf, Fezf2, Klf1, Klf4, Elf3, and Elf5 in Tspan8negMHCIIlo (blue), Tspan8negMHCIIhi (red), Tspan8posMHCIIhi (orange) and Tspan8posMHCIIlo (green) mTEC populations. Normalized mean counts ± SEM. See also Supplementary Figure 4.
Figure 4
Figure 4
ChIP-seq for Fezf2 and Ehf on mTECs identifies regulation of late mTEC development-associated gene expression and Tuft cell signatures. (A) Venn-diagram comparison of genes with a Fezf2 and/or Ehf binding site within +/- 5000 bp from their TSS in mTECs. (B) ChIP-seq signal distribution within +/- 5000 bp from the TSS of mTEC developmental marker genes, genes with annotated functions in keratinization, cornification, and Tuft cell signature genes. From left to right, the four panels indicate the peak distribution in the Ehf ChIP, Ehf input control, Fezf2 ChIP, and Fezf2 input control. Y-axis and color scale represent the number of reads per 50bp bin. (C) Transcription factors with the highest maxFC enrichment in the ChIP compared to the input control targeted by Fezf2 and Ehf (shared TFs, left panel), targeted specifically by Fezf2 (middle panel), or targeted specifically by Ehf (right panel). For each gene, maxFC represents the maximum value for the signal enrichment among all peaks within +/- 5000bp from their TSS. (D) Fezf2 (left) and Ehf (right) target genes with the highest maxFC enrichment in the ChIP compared to the input control. (E) Apoptosis and DNA damage-related genes targeted by Fezf2 and/or Ehf. Indicated is the maxFC enrichment of the respective ChIP compared to its input control. See also Supplementary Figure 5.
Figure 5
Figure 5
ChIP-seq peaks for Fezf2, Ehf, Elf3, and Klf4 on mTECs overlap in the promoter region of late mTEC development-associated genes and Tuft cell signature genes. Signal density plots indicating the read density around the TSS (A) of mTEC maturation and marker genes Epcam, Aire, H2-Ab1, and Hipk1, (B) of keratinization and cornification markers Krt5, Krt14, Sprr1a, and Krt10, (C) of the Tuft cell signature genes Pou2f3, Il25, Trpm5, and Tas2r138. ChIP (blue) and input control (red) tracks for the transcription factors Ehf, Elf3, Fezf2, and Klf4 are shown. The Y-axis represents the λ score from MACS2, i.e., Read length (nt) * Total read number/Effective genome length (nt). (D) Logo of the predicted consensus sequence for the Fezf2 TFBM in mice based on our Fezf2 ChIP-seq experiment and a Stamp-based species comparison to the Fezf2 TFBM in zebrafish published by Chen et al. The predicted Fezf2 binding motif found in MEME (E-value 5.5e-008, 3456 associated sites) was statistically similar to the MEME motif from the supplementary file in Chen et al., according to STAMP (E-value 2.0902e-02).
Figure 6
Figure 6
Fezf2 regulates maturation and Tuft cell gene signatures in mTECs. (A) Gene expression plots indicate the log2 abundance of transcript for Tuft cell signature genes, which are differentially expressed in the Fezf2 ko compared to the wt RNA-seq dataset by Tomofuji et al.; wt (green), Fezf2 ko (orange), dashed lines indicate the mean; upper panel: down-regulated genes; lower panel: up-regulated genes; **≤0.05; *≤0.1 (B) Gene expression plots indicate the log2FC of transcript for keratinization and maturation marker genes in Fezf2 ko mice compared to wild-type mice. Mean +/- SD. (C) Gene expression plots indicate the log2FC of transcript for keratinization and maturation marker genes in Aire ko mice compared to wild-type mice. Mean +/- SD. (D) FACS analysis of FoxN1-cre/Fezf2-flox mice, comparing FoxN1-creneg/Fezf2-floxed (cre-) to FoxN1-crepos/Fezf2-floxed (cre+) mice for their absolute TEC numbers (CD11cnegCD45negEpCAMpos), (E) mTEClo (CD45negEpCAMposLy51negMHCIIlow) frequency and absolute numbers, (F) mTEChi (CD45negEpCAMposLy51negMHCIIhigh) frequency and absolute numbers, (G) Airepos mTEC (CD45negEpCAMposLy51negAirepos) frequency and absolute numbers, (H) Dclk1pos Tuft-mTEC (CD45negEpCAMposLy51negDclk1pos) frequency and absolute numbers, depicted are the results from two independent biological replicates with 4-5 mice per experiment. Statistics are calculated using unpaired Student’s t-test +/- SEM. (I) Representative FACS plots of Dclk1pos Tuft-mTEC analysis for control (left) and Fezf2 ko (right) mice. (J) Model of the regulatory role of Fezf2 on Tuft-mTEC gene signature expression and cell development, on cornified mTEC gene signature expression, and on Aire+mTEC gene signature expression and cell development. See also Supplementary Figure 6 and 7. ns (P > 0.05), * (P ≤ 0.05), ** (P ≤ 0.01), *** (P ≤ 0.001), **** (P ≤ 0.0001).

Similar articles

Cited by

References

    1. Yamano T, Nedjic J, Hinterberger M, Steinert M, Koser S, Pinto S, et al. . Thymic B cells are licensed to present self antigens for central T cell tolerance induction. Immunity (2015) 42(6):1048–61. doi: 10.1016/j.immuni.2015.05.013 - DOI - PubMed
    1. Starr TK, Jameson SC, Hogquist KA. Positive and negative selection of T cells. Annu Rev Immunol (2003) 21(1):139–76. doi: 10.1146/annurev.immunol.21.120601.141107 - DOI - PubMed
    1. Takaba H, Takayanagi H. The mechanisms of T cell selection in the thymus. Trends Immunol (2017) 38(11):805–16. doi: 10.1016/j.it.2017.07.010 - DOI - PubMed
    1. Klein L, Kyewski B, Allen PM, Hogquist KA. Positive and negative selection of the T cell repertoire: what thymocytes see (and don't see). Nat Rev Immunol (2014) 14:377–91. doi: 10.1038/nri3667 - DOI - PMC - PubMed
    1. Vollmann EH, Rattay K, Barreiro O, Thiriot A, Fuhlbrigge RA, Vrbanac V, et al. . Specialized transendothelial dendritic cells mediate thymic T-cell selection against blood-borne macromolecules. Nat Commun (2021) 12(1):6230. doi: 10.1038/s41467-021-26446-x - DOI - PMC - PubMed

Publication types

MeSH terms