. 2023 Dec;2023(215):1-56.

Chemical and Cellular Formation of Reactive Oxygen Species from Secondary Organic Aerosols in Epithelial Lining Fluid

Affiliations

Chemical and Cellular Formation of Reactive Oxygen Species from Secondary Organic Aerosols in Epithelial Lining Fluid

M Shiraiwa et al. Res Rep Health Eff Inst. 2023 Dec.

Abstract

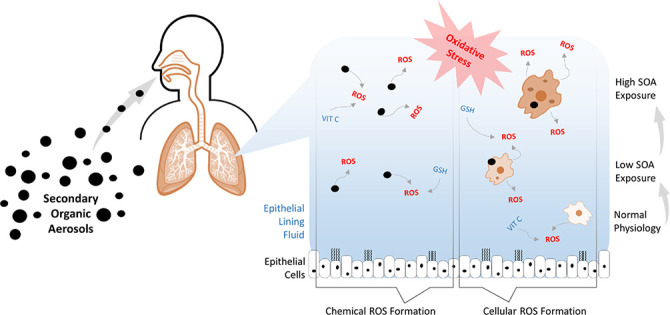
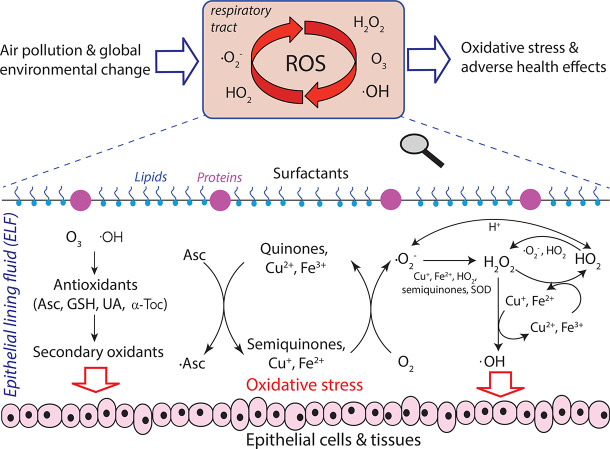
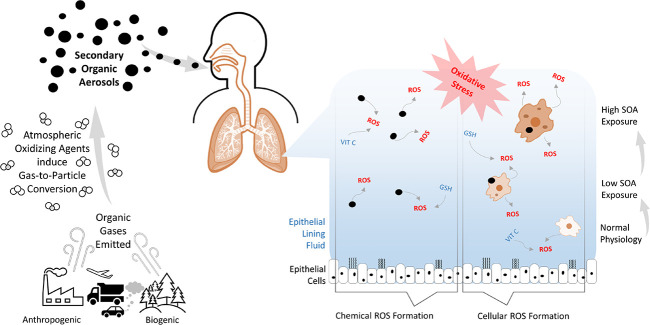
Introduction: Oxidative stress mediated by reactive oxygen species (ROS) is a key process for adverse aerosol health effects. Secondary organic aerosols (SOA) account for a major fraction of particulate matter with aerodynamic diameter ≤2.5 µm (PM2.5). PM2.5 inhalation and deposition into the respiratory tract causes the formation of ROS by chemical reactions and phagocytosis of macrophages in the epithelial lining fluid (ELF), but their relative contributions are not well quantified and their link to oxidative stress remains uncertain. The specific aims of this project were (1) elucidating the chemical mechanism and quantifying the formation kinetics of ROS in the ELF by SOA; (2) quantifying the relative importance of ROS formation by chemical reactions and macrophages in the ELF.

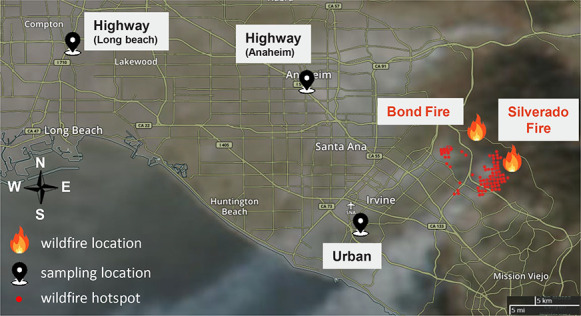
Methods: SOA particles were generated using reaction chambers from oxidation of various precursors including isoprene, terpenes, and aromatic compounds with or without nitrogen oxides (NOx). We collected size-segregated PM at two highway sites in Anaheim, CA, and Long Beach, CA, and at an urban site in Irvine, CA, during two wildfire events. The collected particles were extracted into water or surrogate ELF that contained lung antioxidants. ROS generation was quantified using electron paramagnetic resonance (EPR) spectroscopy with a spin-trapping technique. PM oxidative potential (OP) was also quantified using the dithiothreitol assay. In addition, kinetic modeling was applied for analysis and interpretation of experimental data. Finally, we quantified cellular superoxide release by RAW264.7 macrophage cells upon exposure to quinones and isoprene SOA using a chemiluminescence assay as calibrated with an EPR spin-probing technique. We also applied cellular imaging techniques to study the cellular mechanism of superoxide release and oxidative damage on cell membranes.

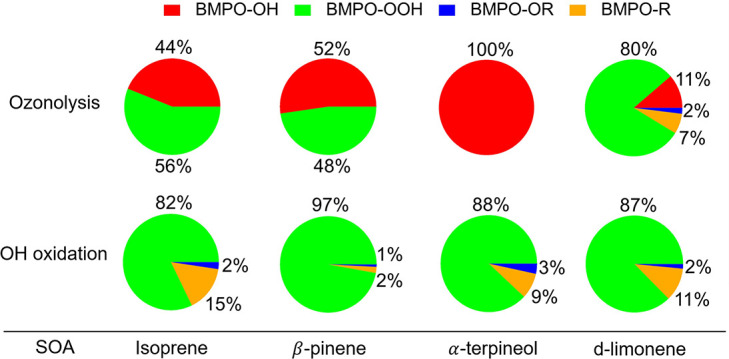
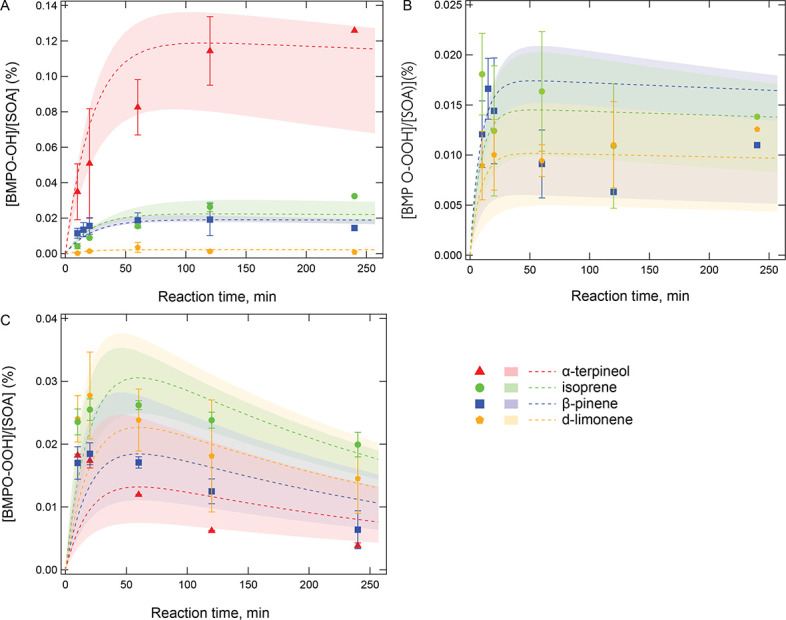
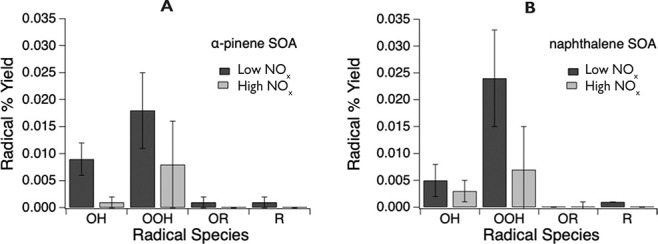
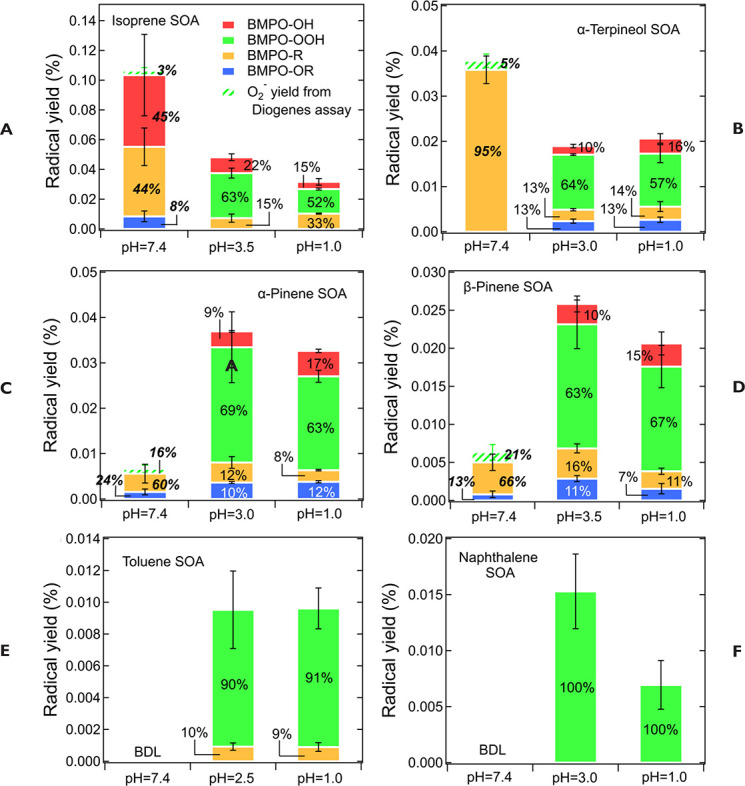
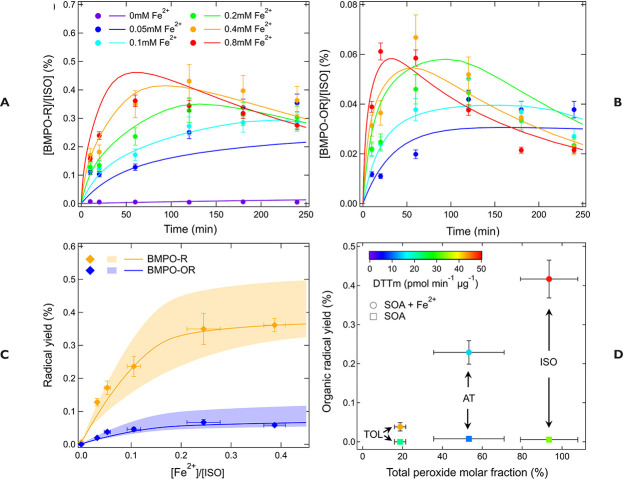
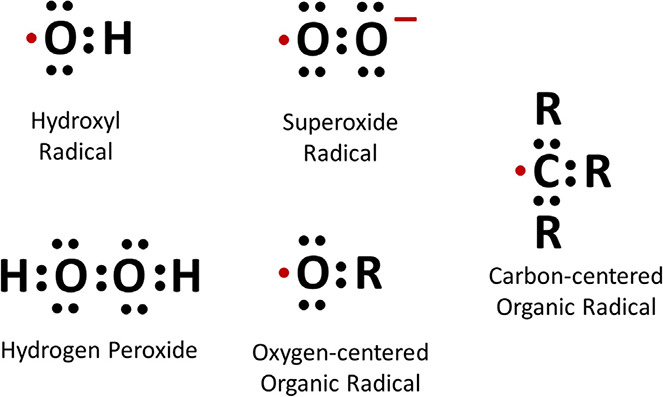
Results: Superoxide radicals (·O2-) were formed from aqueous reactions of biogenic SOA generated by hydroxy radical (·OH) photooxidation of isoprene, β-pinene, α-terpineol, and d-limonene. The temporal evolution of ·OH and ·O2- formation was elucidated by kinetic modeling with a cascade of aqueous reactions, including the decomposition of organic hydroperoxides (ROOH), ·OH oxidation of primary or secondary alcohols, and unimolecular decomposition of α-hydroxyperoxyl radicals. Relative yields of various types of ROS reflected the relative abundance of ROOH and alcohols contained in SOA, which generated under high NOx conditions, exhibited lower ROS yields. ROS formation by SOA was also affected by pH. Isoprene SOA had higher ·OH and organic radical yields at neutral than at acidic pH. At low pH ·O2- was the dominant species generated by all types of SOA. At neutral pH, α-terpineol SOA exhibited a substantial yield of carbon-centered organic radicals (R·), while no radical formation was observed by aromatic SOA.

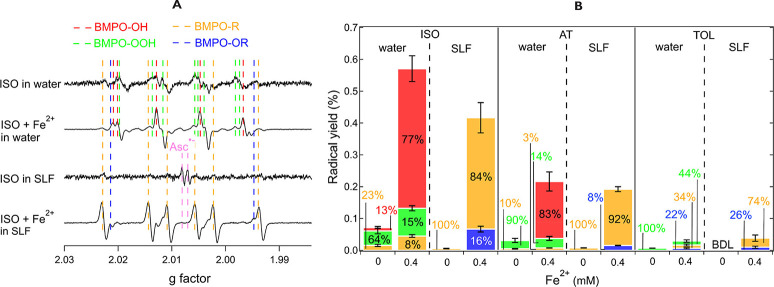
Organic radicals in the ELF were formed by mixtures of Fe2+ and SOA generated from photooxidation of isoprene, α-terpineol, and toluene. The molar yields of organic radicals by SOA were 5-10 times higher in ELF than in water. Fe2+ enhanced organic radical yields by a factor of 20-80. Ascorbate mediated redox cycling of iron ions and sustained organic peroxide decomposition, as supported by kinetic modeling reproducing time- and concentration-dependence of organic radical formation, as well as by additional experiments observing the formation of Fe2+ and ascorbate radicals in mixtures of ascorbate and Fe3+. ·OH and superoxide were found to be efficiently scavenged by antioxidants.

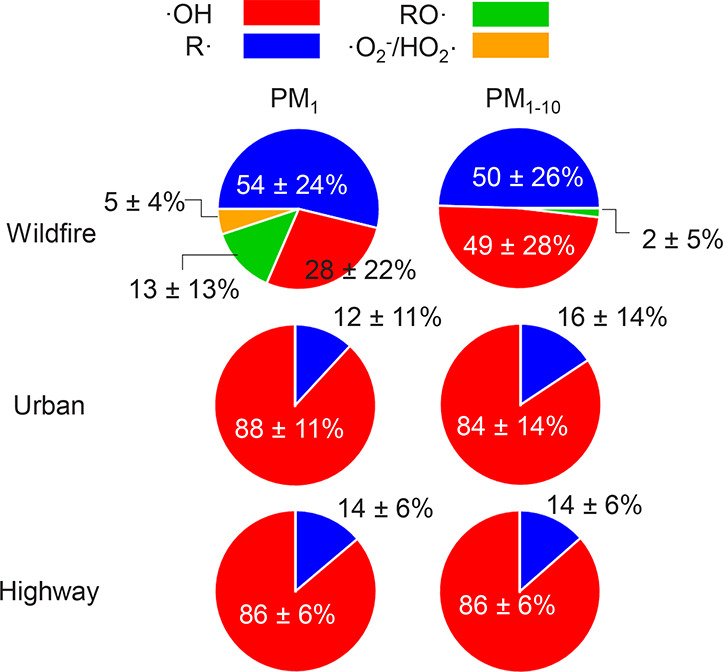
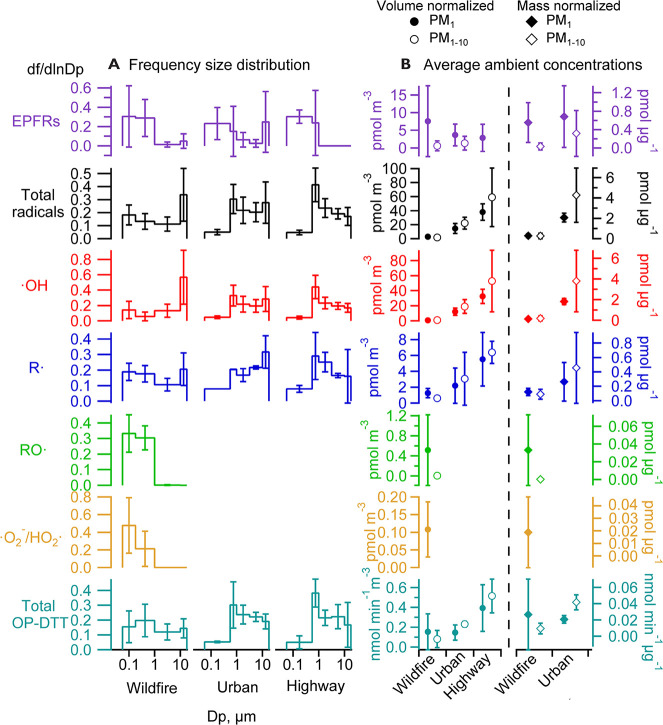
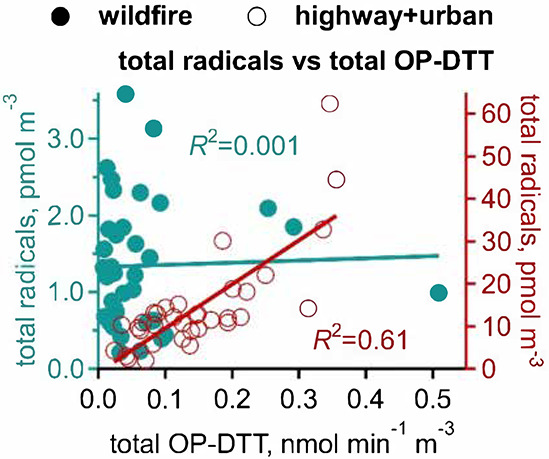
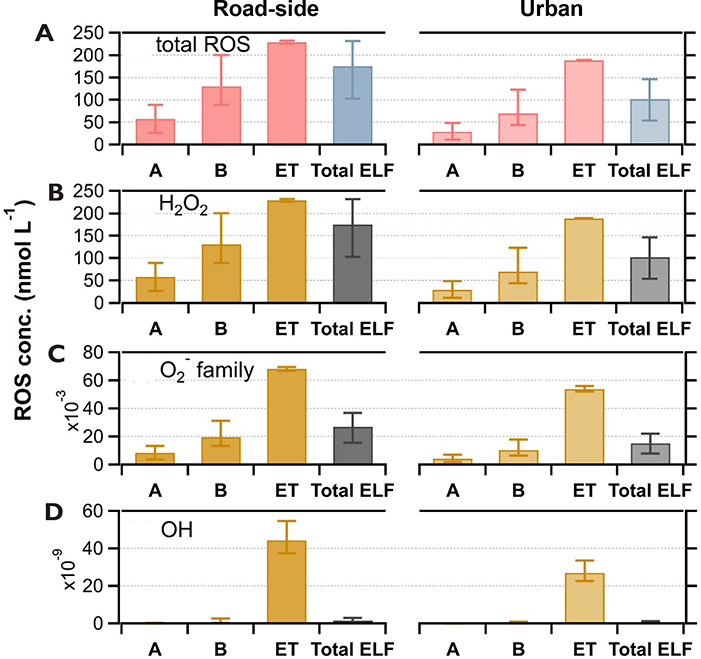
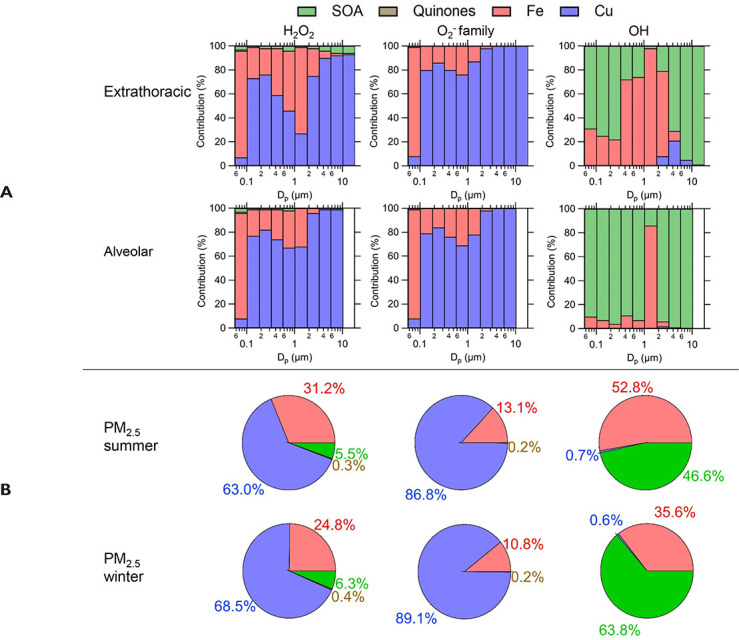
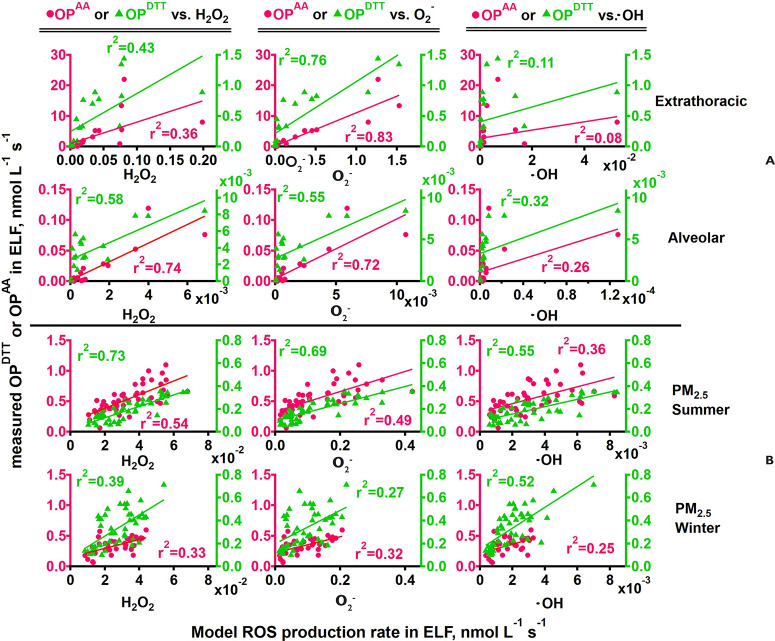
Wildfire PM mainly generated ·OH and R· with minor contributions from superoxide and oxygen-centered organic radicals (RO·). PM OP was high in wildfire PM, exhibiting very weak correlation with radical forms of ROS. These results were in stark contrast with PM collected at highway and urban sites, which generated much higher amounts of radicals dominated by ·OH radicals that correlated well with OP. By combining field measurements of size-segregated chemical composition, a human respiratory tract model, and kinetic modeling, we quantified production rates and concentrations of different types of ROS in different regions of the ELF by considering particle-size-dependent respiratory deposition. While hydrogen peroxide (H2O2) and ·O2- production were governed by Fe and Cu ions, ·OH radicals were mainly generated by organic compounds and Fenton-like reactions of metal ions. We obtained mixed results for correlations between PM OP and ROS formation, providing rationale and limitations of the use of oxidative potential as an indicator for PM toxicity in epidemiological and toxicological studies.

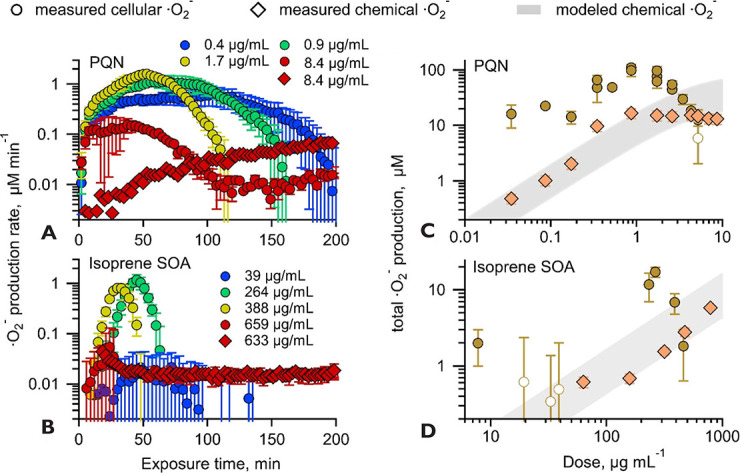
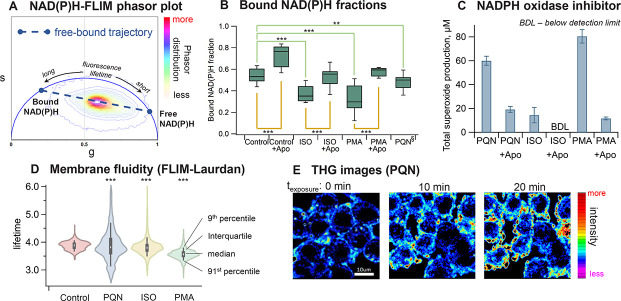
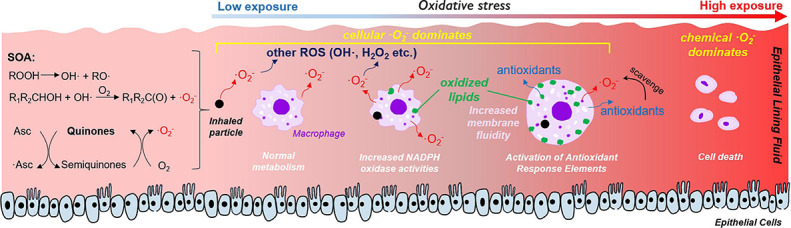
Quinones and isoprene SOA activated nicotinamide adenine dinucleotide phosphate (NADPH) oxidase in macrophages, releasing massive amounts of superoxide via respiratory burst and overwhelming the superoxide formation by aqueous chemical reactions in the ELF. The threshold dose for macrophage activation was much smaller for quinones compared with isoprene SOA. The released ROS caused lipid peroxidation to increase cell membrane fluidity, inducing oxidative damage and stress. Further increases of doses led to the activation of antioxidant response elements, reducing the net cellular superoxide production. At very high doses and long exposure times, chemical production became comparably important or dominant if the escalation of oxidative stress led to cell death.

Conclusions: The mechanistic understandings and quantitative information on ROS generation by SOA particles provided a basis for further elucidation of adverse aerosol health effects and oxidative stress by PM2.5. For a comprehensive assessment of PM toxicity and health effects via oxidative stress, it is important to consider both chemical reactions and cellular processes for the formation of ROS in the ELF. Chemical composition of PM strongly influences ROS formation; further investigations are required to study ROS formation from various PM sources. Such research will provide critical information to environmental agencies and policymakers for the development of air quality policy and regulation.


Figures

Statement Figure.
Statement Figure.
After inhalation of air pollutants, ROS are formed in lung fluid through chemical reactions and released by macrophages under normal physiological conditions. Excess ROS can lead to oxidative stress and inflammation, but the relative importance of the two pathways is unclear. GSH = glutathione; VIT C = vitamin C.
Figure 1.
Figure 1.
Interaction of air pollutants and ROS in the ELF of the human respiratory tract. Redox-active components trigger and sustain catalytic reaction cycles generating ROS. Asc = ascorbate; ·Asc = ascorbate radicals; H2O2 = hydrogen peroxide; HO2 = hydroperoxyl radical; GSH = glutathione; O2 = molecular oxygen; ·O2- = superoxide radical; O3 = ozone; ·OH = hydroxyl radical; SOD = superoxide dismutase; UA = uric acid; α-Toc = α-tocopherol. Adapted from Lakey et al. .
Figure 2.
Figure 2.
Sampling and wildfire locations, with smoke plumes and wildfire hotspots from the Silverado Fire as viewed by moderate resolution imaging spectroradiometer. Adapted from Fang et al. .
Figure 3.
Figure 3.
Relative yields of BMPO-radical adduct from aqueous reactions of SOA generated by dark ozonolysis (SOAO3) versus ·OH photooxidation (SOAOH) of isoprene, β-pinene, α-terpineol, and d-limonene. Reprinted with permission from Wei et al. . Copyright 2021 American Chemical Society.
Figure 4.
Figure 4.
Temporal evolution of molar yields of A. BMPO-OH and B. BMPO-OOH adducts from aqueous reactions of SOA generated from dark ozonolysis (SOAO3), and C. BMPO-OOH adducts from SOA generated from ·OH photooxidation (SOAOH) of α-terpineol), isoprene, β-pinene, and d-limonene. The markers and error bars are experimental data with one standard deviation. The dashed lines represent the best fits of kinetic model with the shaded area denoting the modeling uncertainties. The ·O2-/HO2· formation from α-terpineol SOAO3 and ·OH formation from all SOAOH are below detection limits. Reprinted with permission from Wei et al. . Copyright 2021 American Chemical Society.
Figure 5.
Figure 5.
Molar yields of BMPO radical adducts (BMPO-OH, BMPO-OOH, BMPO-OR, and BMPO-R) generated from aqueous reactions of A. α-pinene SOA and B. naphthalene SOA, generated with NOx concentrations of 0 and 700 ppb. Error bars represent one standard deviation of 5 replicate measurements. Adapted from Edwards et al. .
Figure 6.
Figure 6.
Yields and relative abundance of different radical species from A. isoprene SOA, B. α-terpineol SOA, C. α-pinene SOA, D. β-pinene SOA, E. toluene SOA, and F. naphthalene SOA at different pH in the presence of spin-trapping agent BMPO. The solid-colored bars represent BMPO-radical adducts measured by EPR, while the green dashed bars represent superoxide yields estimated from the Diogenes assay. Note the italic bold numbers at pH 7.4 are calculated combining the results of EPR and the Diogenes assay. The error bars represent the error propagation from the two duplicates in EPR measurements or the Diogenes assay with the uncertainty in SOA mass measurements. Adapted from Wei et al. .
Figure 7.
Figure 7.
A. EPR spectra of isoprene SOA with 0 or 0.4 mM Fe2+ in water and SLF in the presence of spin-trapping agent BMPO. The dashed vertical lines represent different BMPO-radical adducts and Asc·-. B. Yields and relative abundance of different radical species including BMPO-OH (red), BMPO-OOH (green), BMPO-R (yellow) and BMPO-OR (blue) from isoprene (ISO), α-terpineol (AT), and toluene (TOL) SOA in water and SLF with 0 or 0.4 mM Fe2+. The radical yields shown peaked at a reaction time of 20 min in water and 60 min in SLF, respectively. The error bars represent the error propagation from the two duplicates in EPR measurement and the uncertainty in SOA mass measurements. BDL = below the detection limit. Reprinted with permission from Wei et al. . Copyright 2021 American Chemical Society.
Figure 8.
Figure 8.
Temporal evolution of molar yields of A. BMPO-R and B. BMPO-OR from aqueous reactions of isoprene SOA and Fe2+ (0–0.8 mM) in SLF. C. Yields of R· (yellow) and RO· (blue) from isoprene SOA in SLF as a function of [Fe2+]/[ISO] molar ratios. The markers are experimental data. The solid lines represent the best fits of the kinetic model and the shaded areas represent the modeling uncertainties. D. Organic radical yields (BMPO-R + BMPO-OR) are plotted against total peroxide molar fractions in isoprene, α-terpineol, and toluene SOA with 0 (square) or 0.4 mM (circle) Fe2+. The color scale represents the DTT consumption rate normalized by SOA mass (DTTm). The error bars in all panels represent the error propagation from the two duplicates in EPR measurement or total peroxide measurement and the uncertainty in SOA mass measurements. Reprinted with permission from Wei et al. . Copyright 2021 American Chemical Society.
Figure 9.
Figure 9.
Averaged fractions of ·OH, R·, RO·, and ·O2-/HO2· in total radical formation in the aqueous extracts of PM1 and PM1–10 collected during wildfire events and at highway and urban sites in the Los Angeles area (see sampling locations in Figure 2). Adapted from Fang et al. .
Figure 10.
Figure 10.
A. Average frequency distributions and B. air volume-normalized and PM mass-normalized concentrations of EPFRs, ROS, and total OP-DTT of ambient PM collected during wildfire events (N = 8) and at highway (N = 3) and urban (N = 3) sites. Data are presented as mean and the standard deviation from different sampling days. PM1 and PM1–10 are sum of all MOUDI stages up to 1 μm and between 1 and 10 μm, respectively. PM mass concentrations are not available at the highway sites. Adapted from Fang et al. .
Figure 11.
Figure 11.
Correlations of total radicals with total OP-DTT during wildfire events and at highway and urban sites. Each data point represents data obtained from an individual MOUDI stage. Adapted from Fang et al. .
Figure 12.
Figure 12.
Estimates of ROS concentrations in the epithelial lining fluid in various respiratory compartments after 1.5 hours of inhalation and deposition of ambient size-segregated water-soluble Fe and Cu, SOA, and quinones at road-side and urban sites in Atlanta, GA. A. Total ROS; B–D. Individual ROS. Respiratory compartments include alveolar (A), bronchial (B), and extrathoracic (ET) regions. The blue and grey bars (denoted as Total ELF) represent ROS concentrations without considering particle-size dependence of ELF deposition in different regions and assuming homogeneous PM deposition in the total ELF volume. Uncertainties associated with the ELF thickness are represented by the error bars. Other model uncertainties are discussed in the text. Reprinted with permission from Fang et al. . Copyright 2019 American Chemical Society.
Figure 13.
Figure 13.
Modeled contributions of Cu, Fe, SOA, and quinones to production rates of H2O2, ·O2- family, and ·OH. A. in the extrathoracic and alveolar regions based on size-dependent deposition of particles collected at the road-side site and B. in the respiratory tract (without considering size-dependent deposition) based on PM2.5 particles collected at the urban site in Atlanta in summer and winter. Reprinted with permission from Fang et al. . Copyright 2019 American Chemical Society.
Figure 14.
Figure 14.
Correlations between oxidative potential measured by the dithiothreitol (OPDTT) and ascorbic acid (OPAA) assays and H2O2, the ·O2- family, and ·OH production rates. A. by size-dependent respiratory deposition of the size-segregated particles collected from both road-side and urban sites in extrathoracic and alveolar regions and B. by respiratory deposition of PM2.5 particles collected at the urban site in summer and winter in the total ELF. Reprinted with permission from Fang et al. . Copyright 2019 American Chemical Society.
Figure 15.
Figure 15.
Total ·O2- production upon exposure to PQN and isoprene-derived SOA. Cellular ·O2- release from RAW264.7 macrophages (circles) and chemical (diamonds) is shown in time profiles (A, B) and in dose–response curves (C, D). A & B. Markers are color-coded with dose (in g/mL). Data points with error bars represent the average and uncertainties calculated from error propagation based on variabilities from samples and controls (see Statistical Analyses section for details). C & D. Statistically insignificant (P > 0.05, unpaired t test) comparisons of exposure groups with vehicle controls are plotted as open circles. Chemical production of ·O2- was also simulated using kinetic models with shaded areas representing model uncertainties. Adapted from Fang et al. .
Figure 16.
Figure 16.
NADPH oxidase activities and oxidative stress on cell membranes. A. Phasor plot of the FLIM images from RAW 264.7 macrophage treated with control (vehicle) and all samples. B. NAD(P)H bound fractions based on phasor locations in A for macrophage treated with control and samples with and without NADPH oxidase inhibitor apocynin (Apo). The box plots show the median, 10, 25, 75, and 90 percentiles. C. Effect of apocynin on total ·O2- production. Bars with error bars represent the average from triplicates and the standard deviation. D. Membrane fluidity measured with FLIM with a Laurdan probe. E. Locations and intensity of lipid accumulation from THG imaging on cells treated with 9,10-phenanthrenequinone (PQN). Unpaired t test, ***P < 0.0001, ** P < 0.001. §FLIM images were taken from cells after 10-min exposure of PQN, washed with PBS buffer, and replaced with fresh incomplete media. BDL = below detectable limit; ISO = isoprene-derived SOA; PMA = phorbol 12-myristate 13-acetate. Adapted from Fang et al. .
Figure 17.
Figure 17.
Multitier chemical and cellular response mechanisms upon PM deposition in epithelial lining fluid. Cellular ·O2- release by alveolar macrophages via activation of NADPH oxidase dominates over chemical ·O2- production, causing lipid peroxidation and activation of antioxidant response elements. Adapted from Fang et al. .
Commentary Figure 1.
Anthropogenic and biogenic volatile organic gases are emitted into the atmosphere and react with oxidizing agents such as ozone in a gas-to-particle conversion to form SOAs. SOAs (and other aerosols) are inhaled into the respiratory tract and can form ROS in the ELF through chemical reactions. ROS are also formed cellularly by macrophages under normal physiological conditions. However, aerosols exposure can increase cellular ROS formation. Antioxidants like vitamin C and glutathione (GSH) scavenge and neutralize ROS. When antioxidant systems are overwhelmed, ROS can accumulate and induce oxidative stress, which leads to cell damage and death.
Commentary Figure 2.
ROS Chemical Formulas quantified. Red dots represent unpaired electrons.

Similar articles

Cited by

References

    1. Abbas AK, Lichtman AH, Pillai S. 2010. Basic immunology. Functions and Disorders of the Immune system. Philadelphia, PA:Saunders Elsevier.
    1. Adams G, Boag J, Currant J, Michael B. 1965. Absolute Rate Constants for the Reaction of the Hydroxyl radical with Organic Compounds. New York:Academic Press.
    1. Alpert PA, Dou J, Corral Arroyo P, Schneider F, Xto J, Luo B, et al. . 2021. Photolytic radical persistence due to anoxia in viscous aerosol particles. Nat Commun 12:1769. - PMC - PubMed
    1. Anderson GH, Smith JG. 1968. Acid-catalyzed rearrangement of hydroperoxides. II. Phenylcycloalkyl hydroperoxides. Can J Chem 46:1561–1570.
    1. Arangio AM, Tong H, Socorro J, Pöschl U, Shiraiwa M. 2016. Quantification of environmentally persistent free radicals and reactive oxygen species in atmospheric aerosol particles. Atmos Chem Phys 16:13105–13119.