. 2024 Aug 16;230(2):e318-e326.
doi: 10.1093/infdis/jiae036.

Type I Interferon Autoantibodies Correlate With Cellular Immune Alterations in Severe COVID-19

Collaborators, Affiliations

Type I Interferon Autoantibodies Correlate With Cellular Immune Alterations in Severe COVID-19

Benedikt Strunz et al. J Infect Dis. .

Abstract

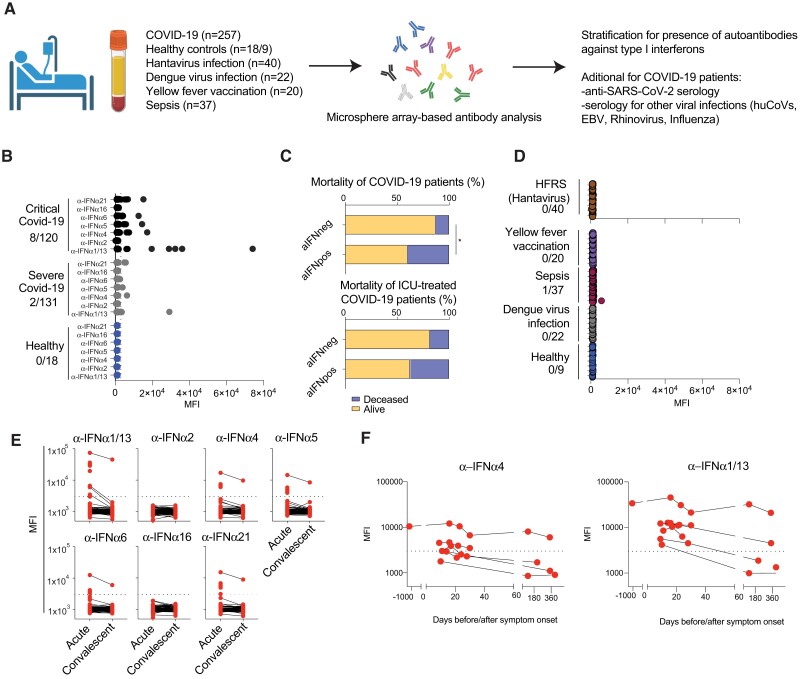
Background: Infection with severe acute respiratory syndrome coronavirus 2 (SARS-CoV-2) can lead to severe disease with increased morbidity and mortality among certain risk groups. The presence of autoantibodies against type I interferons (aIFN-Abs) is one mechanism that contributes to severe coronavirus disease 2019 (COVID-19).

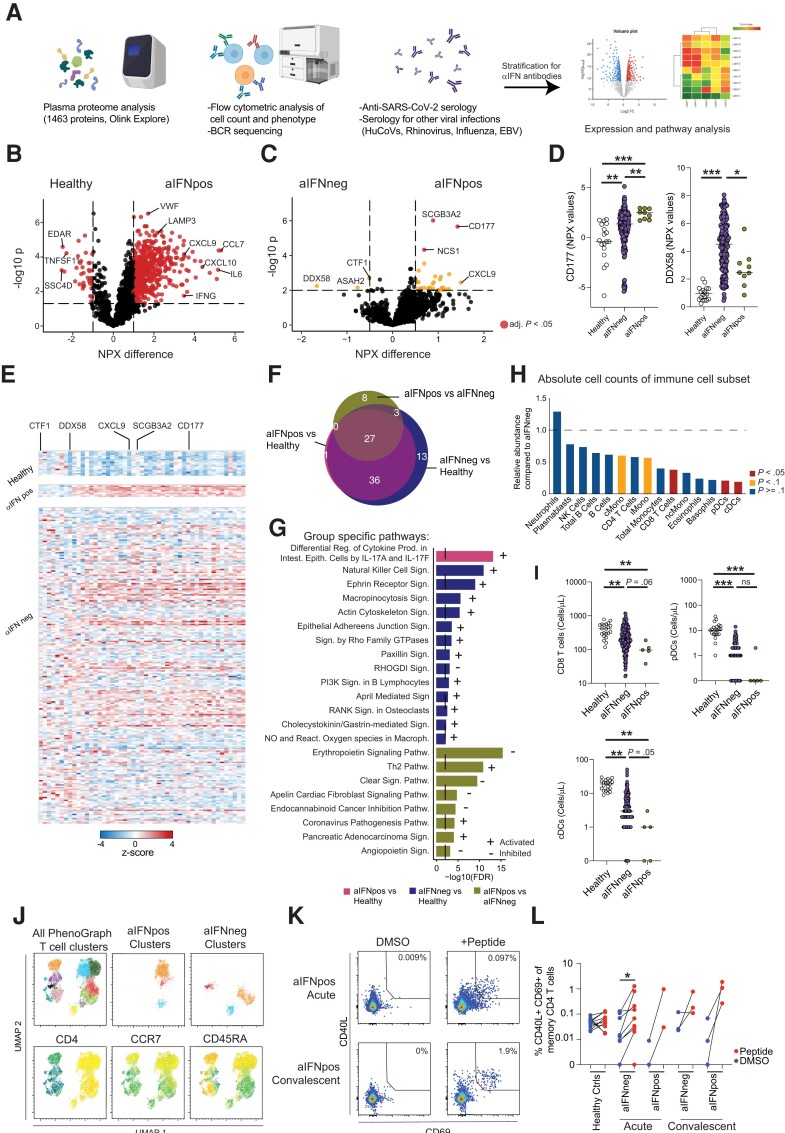
Methods: This study aimed to investigate the presence of aIFN-Abs in relation to the soluble proteome, circulating immune cell numbers, and cellular phenotypes, as well as development of adaptive immunity.

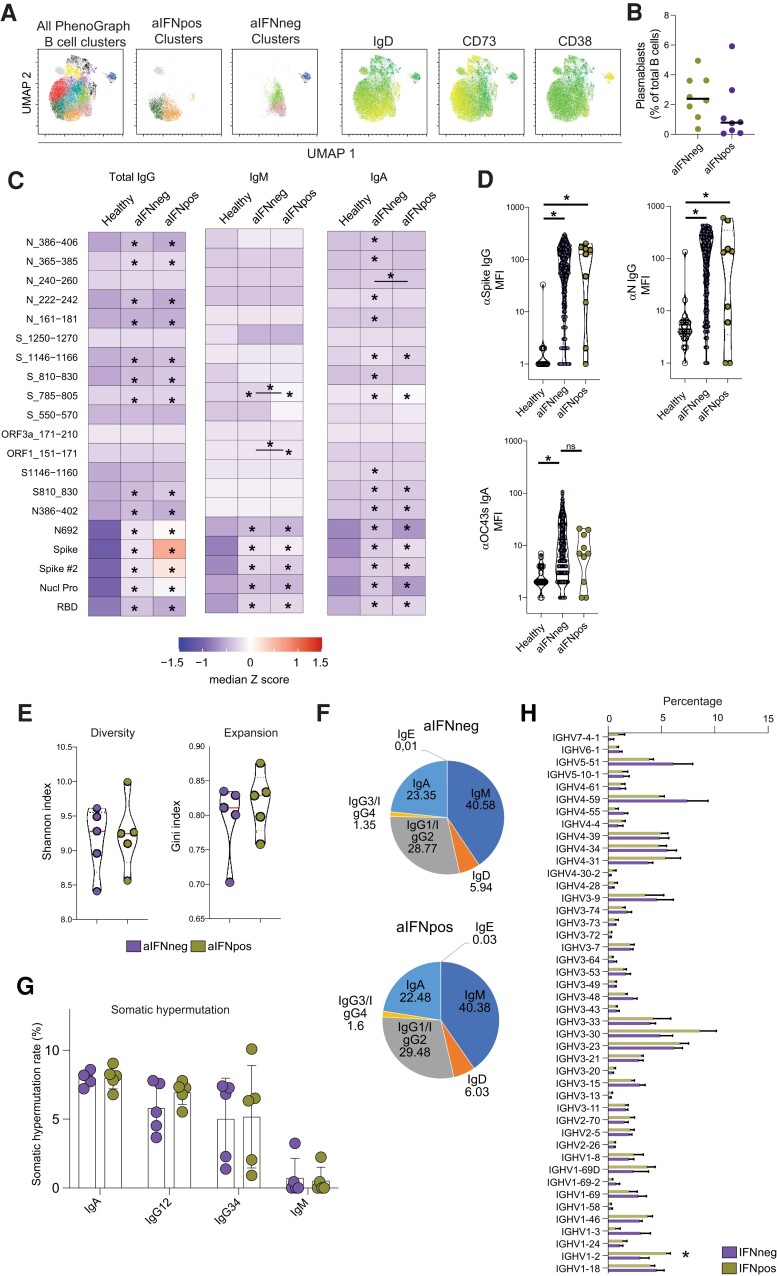
Results: aIFN-Abs were more prevalent in critical compared to severe COVID-19 but largely absent in the other viral and bacterial infections studied here. The antibody and T-cell response to SARS-CoV-2 remained largely unaffected by the presence aIFN-Abs. Similarly, the inflammatory response in COVID-19 was comparable in individuals with and without aIFN-Abs. Instead, presence of aIFN-Abs had an impact on cellular immune system composition and skewing of cellular immune pathways.

Conclusions: Our data suggest that aIFN-Abs do not significantly influence development of adaptive immunity but covary with alterations in immune cell numbers.

Keywords: COVID-19; autoantibodies; immunity; interferon.


Conflict of interest statement

Potential conflicts of interest . S. A. has received honoraria for lectures and educational events from Gilead, AbbVie, MSD, and Biogen; and reports grants from Gilead and AbbVie. All other authors report no potential conflicts. All authors have submitted the ICMJE Form for Disclosure of Potential Conflicts of Interest. Conflicts that the editors consider relevant to the content of the manuscript have been disclosed.

Figures

Figure 1.
Figure 1.
Assessment of aIFN-Abs in COVID-19 and other infections and their impact on antiviral antibody response. A, Schematic study design. B and D, Autoantibodies against the indicated type I IFN subtypes were measured via multiplexed bead assay. Displayed are MFI values in (B) healthy controls (n = 18), patients with severe (hospitalized not ICU, n = 131), or critical COVID-19 (ICU patients, n = 120); and (D) hantavirus mediated HFRS (n = 40), healthy controls (n = 9), acute dengue virus infection (n = 22), sepsis (n = 37), and yellow fever vaccination at day 7 (n = 20). C, Proportion of patients that died or survived COVID-19 infection stratified for positivity for aIFN-Abs; upper plot includes all patients with known outcome (n = 256), lower plot is restricted to ICU patients (n = 121). Fisher exact test was used to determine statistical differences among the groups. *P < .05. E, MFI of autoantibodies against indicated IFN subtype in COVID-19 patient samples from the acute (n = 251) or convalescent phase (n = 119). F, Analysis of IFN-α4 and IFN-α1/13 as examples of aIFN-Abs in patients with samples acquired before (n = 1, 3 years before) or during the acute phase (n = 7), at convalescent phase (3–6 months follow-up, n = 3), and at 1 year follow-up (n = 3). Abbreviations: aIFN-Abs, IFN autoantibodies; aIFNneg, IFN autoantibodies negative; aIFNpos, IFN autoantibodies positive; COVID-19, coronavirus disease 2019; EBV, Epstein-Barr virus; HFRS, hemorrhagic fever with renal syndrome; huCoV, human coronavirus; ICU, intensive care unit; IFN, interferon; MFI, mean fluorescence intensity; SARS-CoV-2, severe acute respiratory syndrome coronavirus 2.
Figure 2.
Figure 2.
Autoantibodies against type 1 IFN modulate the cellular immune compartment. A, Schematic of performed analysis. B and C, Volcano plot of soluble proteome (1463 proteins) analyzed with proximity extension analysis (OLINK Explore panel) of healthy controls (n = 18) or COVID-19 patients at the first time point of sampling during acute disease stratified for absence (n = 225, aIFNneg) or presence (n = 9, aIFNpos) of autoantibodies against IFN: (B) comparison of healthy controls and aIFNpos individuals; and (C) aIFNpos and aIFNneg patients. Samples were tested for significant differences with t test and false discovery rate-adjusted P values for multiple comparison, displayed are unadjusted P values in yellow for P<0.05 and in red adjusted P values <.05. D, Exemple plot displaying raw NPX values for CD177 and DDX58; differences among the groups were calculated with Kruskal-Wallis test followed by Dunn correction for multiple comparison. E, Heatmap displaying z scores of the differentially expressed genes between aIFNpos and aIFNneg patients, as in (C), for healthy controls, and aIFNpos and aIFNneg patients. F, Venn diagram displaying shared and distinct pathways calculated with the IPA for the different comparisons of the 3 groups. G, Overview of the specific IPA pathways in (F) for the indicated comparisons. H, Ratio of average absolute lymphocyte counts when comparing aIFNpos (n = 5) to aIFNneg (n = 174) patients in the acute phase of COVID-19. Groups were compared with Mann-Whitney test; blue P > = .1, yellow P < .1, red P < .05. I, Absolute counts of CD8 T cells, pDC, and cDC for healthy controls (n = 10), and aIFNneg (n = 174) and aIFNpos COVID-19 patients (n = 5). J, UMAP and PhenoGraph clustering analysis from flow cytometric phenotyping of T cells. Included were aIFNpos and aIFNneg donors (each n = 7) at first time point of sampling that were concatenated and split according to aIFN positivity after the respective analysis. To determine the most frequent clusters in aIFNneg and aIFNpos individuals the relative contribution to the cluster was calculated (see also Supplementary Figure 4). K and L, T-cell function in healthy controls (n = 11), and aIFNneg (n = 9) and aIFNpos patients (n = 5) upon DMSO or SARS-CoV-2 peptide stimulation. *P < .05, **P < .01, ***P < .001. Abbreviations: aIFNneg, IFN autoantibodies negative; aIFNpos, IFN autoantibodies positive; UMAP, uniform manifold approximation and projection; BCR, B cell receptor; cDC, conventional dendritic cells; COVID-19, coronavirus disease 2019; DMSO, dimethyl sulfoxide; EBV, Epstein-Barr virus; huCoV, human coronavirus; IFN, interferon; IPA, ingenuity pathway analysis; ns, not significant; pDC, plasmocytoid dendritic cells; SARS-CoV-2, severe acute respiratory syndrome coronavirus 2.
Figure 3.
Figure 3.
Intact humoral immunity despite type I IFN autoantibodies. A and B, Flow cytometric analysis of the B-cell compartment. Displayed are UMAP and PhenoGraph analysis for the most enriched clusters (A, see also Supplementary Figure 4) as well as exemplary summary data (B) for aIFNpos and aIFNneg patients (each n = 8). C and D, Microsphere array-based analysis of antibodies specific against SARS-CoV-2 or other virus proteins or peptides. C, Levels of IgG, IgM, and IgA antibodies against the indicated SARS-CoV-2 peptides or full-length proteins. Displayed are median z-scores for healthy (n = 18), and aIFNneg (n = 225) and aIFNpos (n = 9) patients during acute stage of COVID-19. D, Exemple data of IgG antibody levels against SARS-CoV-2 and IgA response against spike protein from the seasonal cold coronavirus OC43 (n = 18 healthy, n = 241 aIFNneg, and n = 10 aIFNpos patients). E–H, Results from B-cell receptor sequencing from aIFNpos and matched aIFNneg patients during acute disease (each n = 5). Displayed are diversity and expansion indices (E), antibody isotype composition (F), somatic hypermutation rate (G), and IGHV preference (H). The median of somatic hypermutation rate and IGHV frequency were calculated for each sample. C and D, significant differences were tested with Kruskal-Wallis test followed by Dunn test for multiple comparisons. E–G, Differences were calculated by Mann-Whitney test. *P < .05. Abbreviations: aIFNneg, IFN autoantibodies negative; aIFNpos, IFN autoantibodies positive; UMAP, uniform manifold approximation and projection; COVID-19, coronavirus disease 2019; IFN, interferon; Ig, immunoglobulin; MFI, mean fluorescence intensity; ns, not significant; SARS-CoV-2, severe acute respiratory syndrome coronavirus 2.

Similar articles

Cited by

References

    1. Blanco-Melo D, Nilsson-Payant BE, Liu W-C, et al. . Imbalanced host response to SARS-CoV-2 drives development of COVID-19. Cell 2020; 181:1036–45.e9. - PMC - PubMed
    1. Galani I-E, Rovina N, Lampropoulou V, et al. . Untuned antiviral immunity in COVID-19 revealed by temporal type I/III interferon patterns and flu comparison. Nat Immunol 2021; 22:32–40. - PubMed
    1. Zhang Q, Bastard P, Liu Z, et al. . Inborn errors of type I IFN immunity in patients with life-threatening COVID-19. Science 2020; 370:eabd4570. - PMC - PubMed
    1. Bastard P, Hsiao K-C, Zhang Q, et al. . A loss-of-function IFNAR1 allele in Polynesia underlies severe viral diseases in homozygotes. J Exp Med 2022; 219:e20220028. - PMC - PubMed
    1. Duncan CJA, Skouboe MK, Howarth S, et al. . Life-threatening viral disease in a novel form of autosomal recessive IFNAR2 deficiency in the Arctic. J Exp Med 2022; 219:e20212427. - PMC - PubMed