

Sleep deprivation-induced anxiety-like behaviors are associated with alterations in the gut microbiota and metabolites
- PMID: 38421192
- PMCID: PMC10986621
- DOI: 10.1128/spectrum.01437-23
Sleep deprivation-induced anxiety-like behaviors are associated with alterations in the gut microbiota and metabolites
Abstract
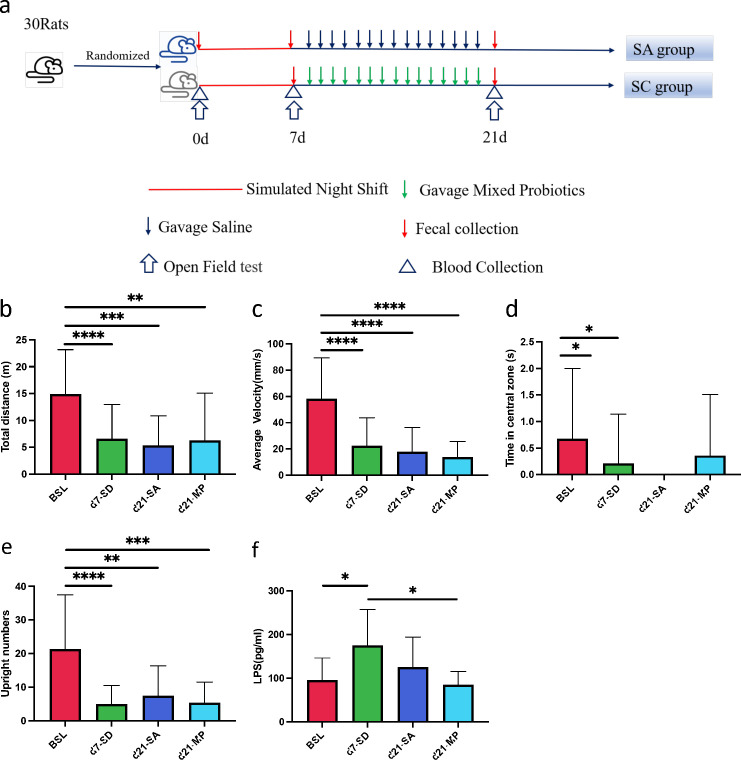
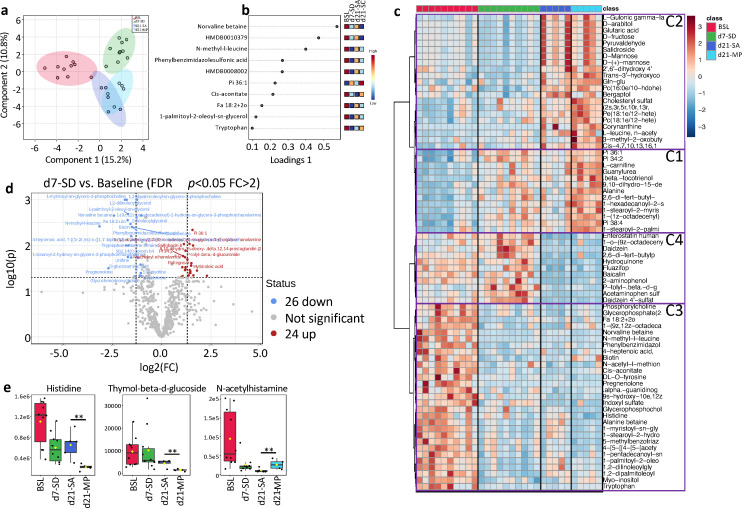
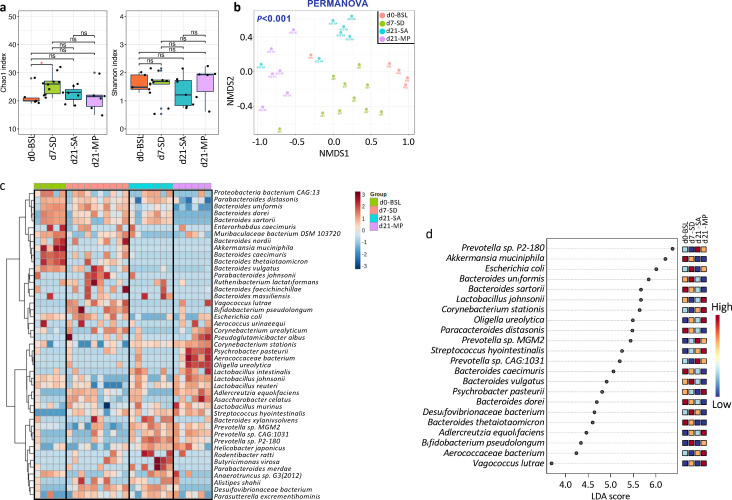
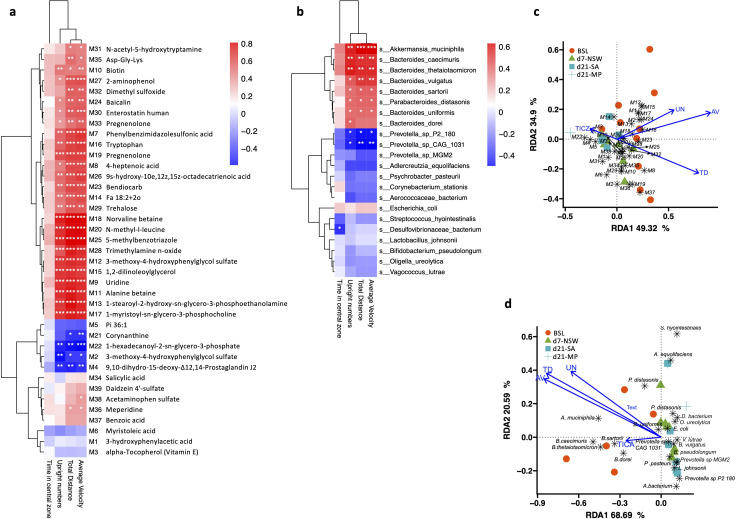
The present study aimed to characterize the gut microbiota and serum metabolome changes associated with sleep deprivation (SD) as well as to explore the potential benefits of multi-probiotic supplementation in alleviating SD-related mental health disorders. Rats were subjected to 7 days of SD, followed by 14 days of multi-probiotics or saline administration. Open-field tests were conducted at baseline, end of SD (day 7), and after 14 days of saline or multi-probiotic gavage (day 21). Metagenomic sequencing was conducted on fecal samples, and serum metabolites were measured by untargeted liquid chromatography tandem-mass spectrometry. At day 7, anxiety-like behaviors, including significant decreases in total movement distance (P = 0.0002) and staying time in the central zone (P = 0.021), were observed. In addition, increased levels of lipopolysaccharide (LPS; P = 0.028) and decreased levels of uridine (P = 0.018) and tryptophan (P = 0.01) were detected in rats after 7 days of SD. After SD, the richness of the gut bacterial community increased, and the levels of Akkermansia muciniphila, Muribaculum intestinale, and Bacteroides caecimuris decreased. The changes in the host metabolism and gut microbiota composition were strongly associated with the anxiety-like behaviors caused by SD. In addition, multi-probiotic supplementation for 14 days modestly improved the anxiety-like behaviors in SD rats but significantly reduced the serum level of LPS (P = 0.045). In conclusion, SD induces changes in the gut microbiota and serum metabolites, which may contribute to the development of chronic inflammatory responses and affect the gut-brain axis, causing anxiety-like behaviors. Probiotic supplementation significantly reduces serum LPS, which may alleviate the influence of chronic inflammation.
Importance: The disturbance in the gut microbiome and serum metabolome induced by SD may be involved in anxiety-like behaviors. Probiotic supplementation decreases serum levels of LPS, but this reduction may be insufficient for alleviating SD-induced anxiety-like behaviors.
Keywords: anxiety; gut microbiota; metabolomics; probiotics; sleep deprivation.
Conflict of interest statement
The authors declare no conflict of interest.
Figures
Similar articles
-
Probiotic consumption during puberty mitigates LPS-induced immune responses and protects against stress-induced depression- and anxiety-like behaviors in adulthood in a sex-specific manner.Brain Behav Immun. 2019 Oct;81:198-212. doi: 10.1016/j.bbi.2019.06.016. Epub 2019 Jun 15. Brain Behav Immun. 2019. PMID: 31212008
-
Melatonin Ameliorates Neuropsychiatric Behaviors, Gut Microbiome, and Microbiota-Derived Metabolites in Rats with Chronic Sleep Deprivation.Int J Mol Sci. 2023 Nov 27;24(23):16820. doi: 10.3390/ijms242316820. Int J Mol Sci. 2023. PMID: 38069141 Free PMC article.
-
Acute sleep deprivation exacerbates systemic inflammation and psychiatry disorders through gut microbiota dysbiosis and disruption of circadian rhythms.Microbiol Res. 2023 Mar;268:127292. doi: 10.1016/j.micres.2022.127292. Epub 2022 Dec 23. Microbiol Res. 2023. PMID: 36608535
-
A systematic review of microbiome changes and impact of probiotic supplementation in children and adolescents with neuropsychiatric disorders.Prog Neuropsychopharmacol Biol Psychiatry. 2021 Jun 8;108:110187. doi: 10.1016/j.pnpbp.2020.110187. Epub 2020 Dec 1. Prog Neuropsychopharmacol Biol Psychiatry. 2021. PMID: 33271210 Free PMC article.
-
Sleep, circadian rhythm, and gut microbiota.Sleep Med Rev. 2020 Oct;53:101340. doi: 10.1016/j.smrv.2020.101340. Epub 2020 May 13. Sleep Med Rev. 2020. PMID: 32668369 Review.
Cited by
-
The Effect of Sleep Disruption on Cardiometabolic Health.Life (Basel). 2025 Jan 7;15(1):60. doi: 10.3390/life15010060. Life (Basel). 2025. PMID: 39860000 Free PMC article. Review.
-
Limosilactobacillus reuteri Alleviates Anxiety-like Behavior and Intestinal Symptoms in Two Stressed Mouse Models.Nutrients. 2024 Sep 22;16(18):3209. doi: 10.3390/nu16183209. Nutrients. 2024. PMID: 39339809 Free PMC article.
-
Psychobiotics in Depression: Sources, Metabolites, and Treatment-A Systematic Review.Nutrients. 2025 Jun 27;17(13):2139. doi: 10.3390/nu17132139. Nutrients. 2025. PMID: 40647242 Free PMC article. Review.
-
The microbiota-gut-brain axis and central nervous system diseases: from mechanisms of pathogenesis to therapeutic strategies.Front Microbiol. 2025 Jun 13;16:1583562. doi: 10.3389/fmicb.2025.1583562. eCollection 2025. Front Microbiol. 2025. PMID: 40584038 Free PMC article. Review.
-
Modifications in the Composition of the Gut Microbiota in Rats Induced by Chronic Sleep Deprivation: Potential Relation to Mental Disorders.Nat Sci Sleep. 2024 Sep 4;16:1313-1325. doi: 10.2147/NSS.S476691. eCollection 2024. Nat Sci Sleep. 2024. PMID: 39247907 Free PMC article.
References
MeSH terms
Substances
LinkOut - more resources
Full Text Sources
