. 2024;44(3):37-52.
doi: 10.1615/CritRevImmunol.2023050325.

Enhancing Human Treg Cell Induction through Engineered Dendritic Cells and Zinc Supplementation

Affiliations

Enhancing Human Treg Cell Induction through Engineered Dendritic Cells and Zinc Supplementation

Nisar Ali Shaikh et al. Crit Rev Immunol. 2024.

Abstract

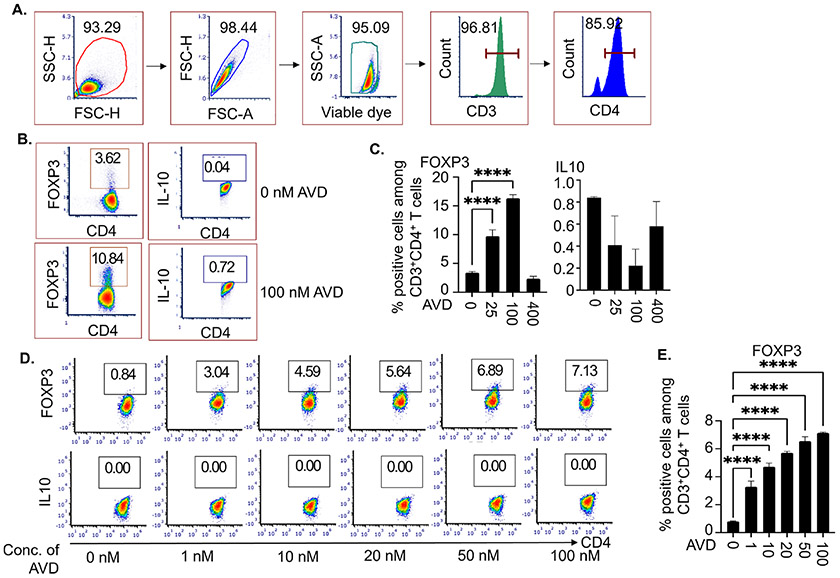
Regulatory T (Treg) cells hold promise for the ultimate cure of immune-mediated diseases. However, how to effectively restore Treg function in patients remains unknown. Previous reports suggest that activated dendritic cells (DCs) de novo synthesize locally high concentrations of 1,25-dihydroxy vitamin D, i.e., the active vitamin D or 1,25(OH)2D by upregulating the expression of 25-hydroxy vitamin D 1α-hydroxylase. Although 1,25(OH)2D has been shown to induce Treg cells, DC-derived 1,25(OH)2D only serves as a checkpoint to ensure well-balanced immune responses. Our animal studies have shown that 1,25(OH)2D requires high concentrations to generate Treg cells, which can cause severe side effects. In addition, our animal studies have also demonstrated that dendritic cells (DCs) overexpressing the 1α-hydroxylase de novo synthesize the effective Treg-inducing 1,25(OH)2D concentrations without causing the primary side effect of hypercalcemia (i.e., high blood calcium levels). This study furthers our previous animal studies and explores the efficacy of the la-hydroxylase-overexpressing DCs in inducing human CD4+FOXP3+regulatory T (Treg) cells. We discovered that the effective Treg-inducing doses of 1,25(OH)2D were within a range. Additionally, our data corroborated that the 1α-hydroxylase-overexpressing DCs synthesized 1,25(OH)2D within this concentration range in vivo, thus facilitating effective Treg cell induction. Moreover, this study demonstrated that 1α-hydroxylase expression levels were pivotal for DCs to induce Treg cells because physiological 25(OH)D levels were sufficient for the engineered but not parental DCs to enhance Treg cell induction. Interestingly, adding non-toxic zinc concentrations significantly augmented the Treg-inducing capacity of the engineered DCs. Our new findings offer a novel therapeutic avenue for immune-mediated human diseases, such as inflammatory bowel disease, type 1 diabetes, and multiple sclerosis, by integrating zinc with the 1α-hydroxylase-overexpressing DCs.


Figures

FIG. 1:
FIG. 1:
1,25(OH)2D at doses significantly higher than physiological levels, but not at super high concentrations, increases the induction of CD4+FOXP3+ T cells. Human naïve CD4+ T cells were activated by anti-CD3 and anti-CD28 antibodies as described in materials and methods in the presence of the indicated 1,25(OH)2D (AVD) concentrations. IL-2 (50 IU/ml) was added every two days. Ten days later, the activated CD4+ T cells were analyzed by flow cytometry. (A) Gating strategy shows cells are gated on CD4+ T cells. (B) Representative flow cytometry plots show the expressions of FOXP3 and IL-10 in the activated CD4+ T cells in the presence of 0 nM and 100 nM AVD. (C) Cumulative data show the expressions of FOXP3 and IL-10 in the activated CD4+ T cells in the presence of 0 nM, 25 nM, 100 nM, and 400 nM AVD. (D) Representative data show the expressions of FOXP3 and IL-10 in the activated CD4+ T cells in the presence of 0 nM, 1 nM, 10 nM, 20 nM, 50 nM, and 100 nM AVD. (E) Cumulative data show the expressions of FOXP3 in the activated CD4+ T cells in the presence of 0 nM, 1 nM, 10 nM, 20 nM, 50 nM, and 100 nM AVD. Bars represent the mean ± standard error of the mean (SEM). ****P < 0.0001. Ordinary two-way ANOVA (n = 3).
FIG. 2:
FIG. 2:
Human monocyte-derived DCs, when engineered to overexpress the CYP27B1 gene, de novo synthesize high 1,25(OH)2D concentrations. Human monocyte-derived DCs were generated, activated, and transduced with a control lentiviral vector (hDC-Ctr) or the lentiviral vector expressing CYP27B1 (hDC-CYP) as described in the materials and methods section. (A) Representative images show non-transduced and transduced DCs under bright and fluorescent fields (transduced DCs express GFP and therefore show green color). (B) Data show CYP27B1 mRNA expressions in hDC-Ctr and hDC-CYP cells. (C) hDC-Ctr and hDC-CYP cells were cultured with 25(OH)D (75 nM) at 37°C and 5% CO2. Twenty-four hours later, the supernatants were examined for AVD concentrations. (D) Data show the expressions of CD80 and CD86 in parental DCs (hDC-Parent) before and after activation by LPS (100 ng/ml). (E) Data show the expressions of CD80 (left panel) and CD86 (right panel) in hDC-Ctr and hDC-CYP cells. Bars represent the mean ± standard error of the mean (SEM). ****P < 0.0001. Two-way ANOVA (n = 3).
FIG. 3:
FIG. 3:
The CYP27B1 expression levels, not the 25(OH)D concentrations, are critical for human DCs to augment the induction of FOXP3+ Treg cells. Human hDC-Ctr and hDC-CYP cells were generated as described in materials and methods. Subsequently, naïve CD4+ T cells from healthy subjects were activated by the DCs and an anti-CD3 monoclonal antibody (5 μg/ml) in the presence of the indicated 25(OH)D concentrations and IL-2 (50 IU/ml). The culture media and IL-2 were replenished every three days. Seven days later, the cells were examined for the expressions of FOXP3 and IL-10 by flow cytometry. (A) Representative flow cytometry plots show the expressions of FOXP3 and IL-10 in the activated CD4+ T Cells in the presence of 0 nM, 20 nM, 75 nM, and 300 nM 25(OH)D. (B) Cumulative data of (B). (C) Representative flow cytometry plots show the expressions of FOXP3 and IL-10 in the activated CD4+ T cells in the presence of 75 nM 25(OH)D. (D) Cumulative data of (C). Bars represent the mean ± standard error of the mean (SEM). ****P < 0.0001. Two-way ANOVA (n = 3).
FIG. 4:
FIG. 4:
CD4+ T cells activated by hDC-CYP cells showed significantly enhanced capacity to suppress the proliferation of autologous T cells. Naïve CD4+ T cells from healthy subjects were activated for seven days by hDC-Ctr or hDC-CYP cells, as described in materials and methods, and designated as Treg cells. Subsequently, the Treg cells were cocultured with autologous naïve CD4+ T cells (effector T cells or Teff) labeled with a fluorescence dye (cell trace violet) and activated by anti-CD3/CD28 monoclonal antibodies at the indicated Teff:Treg ratios for seven days. The proliferation of the labeled CD4+ T cells was then determined by flow cytometry. (A) Representative flow cytometry plots show the proliferation of the labeled effector T cell (Teff). hDC-Ctr: hDC-Ctr-activated Treg cells. hDC-CYP: hDC-CYP-activated Treg cells. (B) Cumulative data show % suppression of the Treg cells. ****P < 0.0001. Two-way ANOVA (n = 3).
FIG. 5:
FIG. 5:
Zn at physiological concentrations suppresses AVD-augmented induction of FOXP3+ Treg cells. Human naïve CD4+ T cells from healthy subjects were activated by anti-CD3 and anti-CD28 monoclonal antibodies in the presence of the indicated concentrations of AVD and Zn as described in materials and methods. Ten days later, the cells were examined by flow cytometry for the expression of FOXP3. (A) and (C) Representative flow cytometry plots show FOXP3 expression in the activated CD4+ T cells. (B) and (D) Cumulative data of (A) and (C) respectively. Bars represent the mean ± standard error of the mean (SEM). **P < 0.01, ****P < 0.0001. Two-way ANOVA (n = 3).
FIG. 6:
FIG. 6:
Zn at non-toxic concentrations induces tolerogenic phenotype in activated hDC-CYP cells. hDC-Parent (A) and hDC-CYP (B) cells were generated and activated, as described in materials and methods, in the presence of the indicated Zn concentrations. The DCs were then examined by RT-qPCR for the mRNA expressions of CD80, CD86, HLA-DR, PDL-1, PDL-2, IDO1, and Arg1. Bars represent the mean ± standard error of the mean (SEM). *P < 0.05, **P < 0.01, ***P < 0.001, ****P < 0.0001. Two-way ANOVA (n = 3).
FIG. 7:
FIG. 7:
Zn at non-toxic concentrations enhances the ability of hDC-CYP cells to induce FOXP3+ Treg cells. Human hDC-Ctr and hDC-CYP cells from healthy subjects were generated and used to stimulate autologous naïve CD4+ T cells, as described in materials and methods. In addition, the indicated Zn concentrations were added throughout the cell culture, including DC culture and DC-T cell coculture. Ten days after the DC-T cell coculture, the activated CD4+ T cells were analyzed by flow cytometry. (A) Representative flow cytometry plots show FOXP3 expression in the activated CD4+ T cells. (B) Cumulative data of (A). (C) Representative flow cytometry plots show IL-10 expression in the activated CD4+ T cells. (D) Cumulative data of (C). Bars represent the mean ± standard error of the mean (SEM). ***P < 0.001, ****P < 0.0001. Two-way ANOVA (n = 3).

References

    1. Kim JM, Rasmussen JP, Rudensky AY. Regulatory T cells prevent catastrophic autoimmunity throughout the lifespan of mice. Nat Immunol. 2007;8(2):191–7.Epub 2006/12/01. - PubMed
    1. Fontenot JD, Gavin MA, Rudensky AY. Foxp3 programs the development and function of CD4+CD25+ regulatory T cells. Nat Immunol. 2003;4(4):330–6. Epub 2003/03/04. - PubMed
    1. Hori S, Nomura T, Sakaguchi S. Control of regulatory T cell development by the transcription factor Foxp3. Science. 2003;299(5609):1057–61. Epub 2003/01/11. - PubMed
    1. Bennett CL, Christie J, Ramsdell F, Brunkow ME, Ferguson PJ, Whitesell L, Kelly TE, Saulsbury FT, Chance PF, Ochs HD. The immune dysregulation, polyendocrinopathy, enteropathy, X-linked syndrome (IPEX) is caused by mutations of FOXP3. Nat Genet. 2001;27(1):20–1. Epub 2001/01/04. - PubMed
    1. Khattri R, Cox T, Yasayko SA, Ramsdell F. An essential role for Scurfin in CD4+CD25+ T regulatory cells. Nat Immunol. 2003;4(4):337–42. Epub 2003/03/04. - PubMed