. 2024 Feb 29;134(8):e161941.
doi: 10.1172/JCI161941.

Small molecules that disrupt RAD54-BLM interaction hamper tumor proliferation in colon cancer chemoresistance models

Affiliations

Small molecules that disrupt RAD54-BLM interaction hamper tumor proliferation in colon cancer chemoresistance models

Ekjot Kaur et al. J Clin Invest. .

Abstract

RAD54 and BLM helicase play pivotal roles during homologous recombination repair (HRR) to ensure genome maintenance. BLM amino acids (aa 181-212) interact with RAD54 and enhance its chromatin remodeling activity. Functionally, this interaction heightens HRR, leading to a decrease in residual DNA damage in colon cancer cells. This contributes to chemoresistance in colon cancer cells against cisplatin, camptothecin, and oxaliplatin, eventually promoting tumorigenesis in preclinical colon cancer mouse models. ChIP-Seq analysis and validation revealed increased BLM and RAD54 corecruitment on the MRP2 promoter in camptothecin-resistant colon cancer cells, leading to BLM-dependent enhancement of RAD54-mediated chromatin remodeling. We screened the Prestwick small-molecule library, with the intent to revert camptothecin- and oxaliplatin-induced chemoresistance by disrupting the RAD54-BLM interaction. Three FDA/European Medicines Agency-approved candidates were identified that could disrupt this interaction. These drugs bound to RAD54, altered its conformation, and abrogated RAD54-BLM-dependent chromatin remodeling on G5E4 and MRP2 arrays. Notably, the small molecules also reduced HRR efficiency in resistant lines, diminished anchorage-independent growth, and hampered the proliferation of tumors generated using camptothecin- and oxaliplatin-resistant colon cancer cells in both xenograft and syngeneic mouse models in BLM-dependent manner. Therefore, the 3 identified small molecules can serve as possible viable candidates for adjunct therapy in colon cancer treatment.

Keywords: Colorectal cancer; DNA repair; Oncology.


Figures
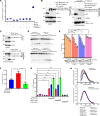
Figure 1
Figure 1. BLM (aa 181–212) enhanced RAD54-mediated chromatin remodeling.
(A) The N-terminal region of RAD54 interacted with BLM (aa 181–212) in cells. N-RAD54-F1, C-RAD54-F1, BLM-F1, and BLM-F2 were transfected in HEK293T cells. Then, Renilla luciferase–based PCAs were carried out with the indicated combination of expressed proteins. (B) Lack of amino acids 181–212 in BLM abrogates its interaction with RAD54 in cells. HCT116 BLM–/– cells were transfected with GFP BLM WT or GFP BLM (aa Δ181–212), and lysates were made. Immunoprecipitations were carried out with anti-GFP antibodies and probed for RAD54. One representative experiment is shown. (C) BLM (aa 181–212) interacts with endogenous RAD54 in cells. As in B, except HCT116 BLM–/– cells were transfected with p3XFlag-Myc-CMV24 BLM (aa 181–212) or the empty vector. (D and E) BLM (aa 181–212) enhanced ATP-dependent RAD54-mediated chromatin remodeling. (D) REA assays were carried out with chromatinized G5E4 array using indicated experimental conditions in presence of ATP. The reactions were stopped after 0, 2, 4, 6, 8, and 10 minutes. (E) Quantitation of D. (F) BLM (aa 181–212) enhanced the ATP binding capacity of RAD54. Quantitation of the ATP binding assays carried out as indicated. (G) BLM (aa 181–212) peptide increased the ATPase activity of RAD54. Quantitation of the ATPase activity carried out as indicated. (H) BLM (aa 181–212) peptide altered the conformation of RAD54. Tryptophan fluorescence assays were carried out with RAD54 WT or RAD54 WT in presence of concentrations of BLM_peptide or SCM_peptide. Experiment was repeated 3 times. One representative experiment is shown. (A and EG) Data are shown as the mean ± SD. Data are from 3 independent experiments. *P < 0.05, **P < 0.01, ***P < 0.001, ****P < 0.0001, (E) 2-way ANOVA, (F) 1-way ANOVA; (G) paired t test.
Figure 2
Figure 2. Interaction between BLM (aa 181–212) and RAD54 enhanced chemoresistance in cells.
(A) Cellular uptake of BLM (aa 181–212) cell-permeable peptide (BLM_CPP) and scrambled cell–permeable peptide (SCM_CPP). The intake of the TAMRA tagged peptides was monitored by live-cell imaging. (B and C) Levels of RAD51, RAD54, and γH2AX were altered after treatment with BLM_CPP. GM03509 GFP cells were grown in presence of HU for 16 hours or 6 more hours after washing away HU, in presence of (B) 180 nM BLM_CPP or SCM_CPP or (C) BLM_NP or SCM_NP. Lysates made were probed with indicated antibodies. Experiment was repeated 4 times, and representative blots are presented. (D) RAD51 and RAD54 foci numbers were increased after treatment with BLM (aa 181–212) peptide. As in B and C, except HCT116 BLM–/– cells were fixed and processed for immunofluorescence with indicated antibodies. (D and H) Experiment was repeated 3 times, and representative images and quantitation (foci/cell) are presented. Number of cells analyzed = 45. (E) Presence of BLM_CPP allowed GM03509 GFP cells to proliferate. As in B and C, except cells released after HU treatment were grown for 4 hours with 180 nM BLM_CPP or SCM_CPP, washed, and allowed to grow for the indicated time intervals. Cells were analyzed by flow cytometry. (F and G) Presence of BLM_CPP or BLM_NP decreased the levels of the CDK inhibitors. GM03509 GFP-BLM and GM03509 GFP cells released after HU treatment were grown for 6 hours with (F) 180 nM BLM_CPP or SCM_CPP or (G) BLM_NP or SCM_NP. Lysates made were probed with indicated antibodies. Experiment was repeated 4 times, and representative blots are presented. The asterisk represents a cross-reactive band in G. (H) γH2AX foci numbers were decreased after treatment with BLM_CPP. As in B and C, except HCT116 BLM–/– cells were processed for immunofluorescence with γH2AX antibody. (I) BLM_CPP decreased the levels of cellular DNA damage. Cells treated with HU (16 hours) were grown for 6 hours with 180 nM BLM_CPP or SCM_CPP, after which Comet assays were carried out. (J and K) BLM_CPP increased cellular resistance to cisplatin and camptothecin. Cells were treated with 180 nM BLM_CPP or SCM_CPP in presence of (J) 1, 2, 3, 4, or 5 nM CDDP or (K) 10 nM, 50 nM, 100 nM, 150 nM, 200 nM of CPT. The percentage of viable cells was determined by MTT assays. The data are from (J) 4 and (I and K) 3 independent experiments. Data are shown as the mean ± SD. *P < 0.05, **P < 0.01, ****P < 0.0001, (I) 1-way ANOVA; (D, H, J, and K) 2-way ANOVA. Scale bar: 5 μM.
Figure 3
Figure 3. Chromatin remodeling by RAD54-BLM complex on MRP2 promoter enhances chemoresistance.
(A) Circos plot obtained from BLM Chip-Seq analysis carried out on GM03509 BLM Clone 9.6 cells. (B and C) Both BLM and RAD54 were corecruited to MRP2 promoter. Chromatin isolated from HCT116 WT and HCT116 IC60 CPTR cells was used for (B) ChIP or (C) Re-ChIP. DNA obtained was used to determine the enrichment on (B) MRP2, MRP3, MDR1, and GAPDH promoters and (C) MRP2, MDR1, and GAPDH promoters by qPCR. Data are from 3 independent experiments. (D and E) BLM (aa 1–212) enhanced ATP-dependent RAD54-mediated chromatin remodeling. (D) REA assays were carried out with chromatinized MRP2 array. Reactions were stopped after 1, 5, and 10 minutes. (E) Quantitation of D. Data are from 4 independent experiments. (F) Enhanced transcription of MDR genes occurred in HCT116 IC60 CPTR cells. RNA isolated from HCT116 WT and HCT116 IC60 CPTR cells was used for RT-qPCR. The levels of MRP1, MRP2, MRP3, MRP4, MRP5, MXR, MDR1, BSEP, ABCA2, and ABCB5 were quantitated from 3 independent experiments. (G) HCT116 WT IC60 CPTR cells have enhanced MRP2 efflux activity. HCT116 WT and HCT116 WT IC60 CPTR cells were incubated with MRP2 substrate (CDF) for 30 minutes at 37°C. The accumulation of fluorescent product CDF was determined as a measure of MRP2 activity. The experiment was carried out 9 times. (H) BLM_CPP enhanced the anchorage-independent growth of HCT116 BLM–/– cells. Soft agar assay was carried out in HCT116 BLM–/– cells by treating them with 180 nM BLM_CPP or SCM_CPP in absence or presence of CPT (120 nM). The number of soft agar colonies in each condition was counted. Data are from 3 independent experiments. (I) Treatment with CPT-BLM-Gel enhanced tumor growth in a xenograft mice model. HCT116 BLM–/– cells were injected into SCID mice (n = 7 in each group). On day 1, when the tumors were 50 mm3, CPT-Gel was injected at the base of the tumors alone or along with the injection of CPT-BLM-Gel or CPT-SCM-Gel. The volume of the tumors was estimated for the indicated days. (J) BLM (aa 181–212) region enhanced tumor growth in xenograft mice model. HCT116 BLM–/– cells stably expressing EGFP or EGFP-BLM (aa 181–212) were injected into SCID mice (n = 7 in each group). The volume of the tumors was estimated for the indicated days. Data are shown as the mean ± SD. *P < 0.05, **P < 0.01, ***P < 0.001, ****P < 0.0001, (B, C, E, F, I) 2-way ANOVA; (G) Mann-Whitney test; (H) 1-way ANOVA; (J) Wilcoxon’s test.
Figure 4
Figure 4. Disruption of RAD54-BLM interaction by small molecules decreased chromatin remodeling.
(A) Disruption of RAD54-BLM interaction by small molecules was done by screening the Prestwick chemical library using Renilla luciferase–based PCA. Percentage disruption of the interaction between BLM F2 and N-RAD54 F1 was plotted in form of a heatmap. (B) C3, C7, and C17 disrupted RAD54-BLM interaction in vitro. In vitro interactions were carried out between bound GST-BLM WT and soluble His-RAD54 WT in the absence or presence of 10 μM C3, C7, or C17. Levels of bound RAD54 were determined by immunoblotting. (C and D) C3, C7, and C17 decreased the efficiency of BLM-dependent enhancement of RAD54 chromatin remodeling activity. (C) REA assays were carried out as indicated using MRP2 array. The reactions were stopped after 1, 5, and 10 minutes. (D) Quantitation of C. The data are from 3 independent experiments. (E) C3, C7, and C17 decreased BLM-dependent enhancement of the binding of ATP by RAD54. Quantitation of the ATP binding assays was carried out. Data are from 3 independent experiments. (F) C3, C7, and C17 decreased BLM-dependent enhancement of the ATPase activity of RAD54. Quantitation of the ATPase activity was carried out. Data are from 4 independent experiments. (G) C17 altered the conformation of RAD54. Tryptophan fluorescence assays were carried out with His-RAD54 WT, alone or in presence of the indicated concentrations of C17. RAD54 fluorescence was measured in a fluorometer. Experiment was repeated 3 times, and a representative experiment is shown. (H) The affinity of RAD54 to C17 was similar to that of biotinylated BLM (aa 181–212) peptide. Octet BLI-based studies were performed to determine the dissociation constant of the interaction of different concentrations of biotin BLM_peptide and C17 with His-RAD54 WT immobilized onto Ni-NTA-sensor. The affinity constant (KD) ± SD is shown. The experiment was repeated 3 times, and 1 representative experiment is shown. Data are shown as the mean ± SD. *P < 0.05, ***P < 0.001, ****P < 0.0001, (D) 2-way ANOVA; (E and F) 1-way ANOVA.
Figure 5
Figure 5. C3, C7, and C17 enhanced the effect of CPT and 1-OHP–mediated decrease in tumor volume in preclinical mice model.
(A) C3, C7, and C17 decreased the levels of the HRR in HCT116 IC60 CPTR cells. HCT116 IC60 CPTR cells were transfected with the HR substrate for 72 hours, and the levels of HRR were determined in absence or presence of 100 nM C3, C7, and C17. Data are from 3 independent experiments. (B) C3, C7, and C17 decreased anchorage-independent cell growth of HCT116 IC60 CPTR cells. Soft agar assay was carried out in HCT116 IC60 CPTR cells by treating them with 100 nM C3, C7, and C17 along with 120 nM CPT. The number of soft agar colonies in each condition was counted. Data are from 3 independent experiments. (CE) C3, C7, and C17 decreased tumor formation by camptothecin- and oxaliplatin-resistant cells in 2 xenograft models. HCT116 IC60 CPTR or HCT116 1-OHPR cells were injected into SCID mice (n = 5 in each group) or NSG mice (n = 3 in each group). The groups were made as indicated. The volume of the tumors was estimated for the indicated days. Data are shown as the mean ± SD. Data for C3 are shown in C, C7 in D, and C17 in E. (F and G) Treatment with both CPT and C17 decreased MRP2 transcript and protein levels. (F) RNA and (G) protein was isolated from tumors obtained at the end point of the xenograft experiment. RNA and the protein levels of MRP2 were determined by (F) RT-qPCR and (G) Western blotting with anti-MRP2 antibody. For each group, 3 tumor samples were analyzed. Data for F are from 3 mice. Data for G are from 1 mouse and are representative of the 3 mice analyzed. Data are shown as the mean ± SD. *P < 0.05, **P < 0.01, ***P < 0.001, ****P < 0.0001, (A, B, and F) 1-way ANOVA; (CE) 2-way ANOVA.
Figure 6
Figure 6. Lack of BLM (aa 181–212) rescues decrease in tumor volume due to CPT and C17 treatment.
(AD) Ablation of MRP2, RAD54, and BLM in xenograft mice models. HCT116 IC60 CPTR cells were injected into SCID mice to form tumors. The groups made are indicated. When tumors were approximately 50 mm3, they were delivered with (A) siControl (n = 5 mice in each group), (B) siMRP2 (n = 6 mice in each group), (C) siRAD54 (n = 5 mice in each group), and (D) siBLM (n = 3 mice in each group) via TAC6 polymer–mediated in vivo delivery. The volume of the tumors was estimated for the indicated days. (EG) Lack of BLM (aa 181–212) residues abrogates C3-, C7-, and C17-mediated decreased tumor formation by camptothecin-resistant cells in xenograft model. HCT116 (aa Δ181–212) CPTR cells were injected into NSG mice (n = 3 in each group). The groups were made as indicated. The volume of the tumors was estimated for the indicated days. Data for C3 are shown in E, C7 in F, and C17 in G. (H and I) Lack of BLM (aa 181–212) residues prevents the decreased MRP2 transcript and protein levels due to treatment with both CPT and C17. (H) RNA and (I) protein were isolated from tumors obtained at the end point of the xenograft experiment. RNA and the protein levels of the indicated MDR genes were determined by (H) RT-qPCR for MRP2 and MRP3 and (I) Western blotting with anti-MRP2 antibody. For each group, 3 tumor samples were analyzed. Data for H are from 3 mice. Data for I are from 1 mouse and are representative of the 3 mice analyzed. Data are shown as the mean ± SD. *P < 0.05, **P < 0.01, ***P < 0.001, ****P < 0.0001, (AF and H) 2-way ANOVA.

References

    1. Li LY, et al. DNA repair pathways in cancer therapy and resistance. Front Pharmacol. 2020;11:629266. doi: 10.3389/fphar.2020.629266. - DOI - PMC - PubMed
    1. Sakthivel KM, Hariharan S. Regulatory players of DNA damage repair mechanisms: role in cancer chemoresistance. Biomed Pharmacother. 2017;93:1238–1245. doi: 10.1016/j.biopha.2017.07.035. - DOI - PubMed
    1. Helleday T. Homologous recombination in cancer development, treatment and development of drug resistance. Carcinogenesis. 2010;31(6):955–960. doi: 10.1093/carcin/bgq064. - DOI - PubMed
    1. Kaur E, et al. Functions of BLM helicase in cells: is it acting like a double-edged sword? Front Genet. 2021;12:634789. doi: 10.3389/fgene.2021.634789. - DOI - PMC - PubMed
    1. Tripathi V, et al. MRN complex-dependent recruitment of ubiquitylated BLM helicase to DSBs negatively regulates DNA repair pathways. Nat Commun. 2018;9(1):1016. doi: 10.1038/s41467-018-03393-8. - DOI - PMC - PubMed

LinkOut - more resources