. 2024 Feb 25;16(1):598-618.
doi: 10.14336/AD.2024.0222. Online ahead of print.

MKK3 K329 Mutation Attenuates Diabetes-Associated Cognitive Dysfunction by Blocking the MKK3-RAGE Interaction and Inhibiting Neuroinflammation

Affiliations

MKK3 K329 Mutation Attenuates Diabetes-Associated Cognitive Dysfunction by Blocking the MKK3-RAGE Interaction and Inhibiting Neuroinflammation

Changjiang Ying et al. Aging Dis. .

Abstract

The receptor for advanced glycation end products (RAGE) contributes to diabetes-associated cognitive dysfunction (DACD) through the interaction of its C-terminal AAs 2-5 with mitogen-activated protein kinase kinase 3 (MKK3). However, the associated MKK3 binding site is unknown. Here, db/db mice were used as a model for type 2 diabetes. GST pull-down assays and AutoDock Vina simulations were conducted to identify the key RAGE binding site in MKK3. This binding site was mutated to investigate its effects on DACD and to elucidate the underlying mechanisms. The interaction of MKK3 and RAGE, the levels of inflammatory factors, and the activation of microglia and astrocytes were tested. Synaptic morphology and plasticity in hippocampal neurons were assessed via electrophysiological recordings and Golgi staining. Behavioral tests were used to assess cognitive function. In this study, MKK3 bound directly to RAGE via its lysine 329 (K329), leading to the activation of the nuclear factor-κB (NF-κB) signaling pathway, which in turn triggered neuroinflammation and synaptic dysfunction, and ultimately contributed to DACD. MKK3 mutation at K329 reversed synaptic dysfunction and cognitive deficits by downregulating the NF-κB signaling pathway and inhibiting neuroinflammation. These results confirm that neuroinflammation and synaptic dysfunction in the hippocampus rely on the direct binding of MKK3 and RAGE. We conclude that MKK3 K329 binding to C-terminal RAGE (ct-RAGE) is a key mechanism by which neuroinflammation and synaptic dysfunction are induced in the hippocampus. This study presents a novel mechanism for DACD and proposes a novel therapeutic avenue for neuroprotection in DACD.


Conflict of interest statement

The authors declare no competing interests.

Figures

Figure 1.
Figure 1.
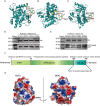
MKK3 binds directly to RAGE. NG: normal glucose group (25 mM glucose); HG: high-glucose group (50 mM glucose); FPS: RAGE-inhibitor group (high-glucose group with 2.5 μM FPS-ZM1 dissolved in DMSO); DMSO: solvent control group (high-glucose group with 2.5 μM DMSO); MG: mannitol control group (isosmotic pressure control, normal glucose group treated with 25 mM mannitol). (A) Analytical result from GEPIA 2 (cancer-pku.cn) showing a positive correlation between MKK3 and RAGE. (B) Representative laser scanning confocal microscopy images showing colocalization of RAGE and MKK3 in HT-22 cells in the high glucose condition. Red, RAGE; green, MKK3; blue, cellular nuclei labeled by DAPI. Colocalization of RAGE and MKK3 is shown in yellow. The scale bar is 10 μm (magnification ×400). (C) Overlap values showing RAGE and MKK3 colocalization. Overlap data were analyzed by one-way ANOVA followed by Tukey's test. F (4, 35) = 338.20. *** p < 0.001. n = 8 in each group. (D and E) Typical blots showing His-labeled pcDNA3.1-MKK3 and GST-labeled PGEX-4T-1-ct-RAGE after purification and overexpression. (F) Blots showing His-marked MKK3 pulled down by GST-tagged ct-RAGE.
Figure 2.
Figure 2.
K329 is the key site for MKK3 binding to RAGE. (A-C) Cartoon linear docking figure showing possible sites of MKK3 binding to the cytoplasmic RKRQ motif in ct-RAGE. The cytoplasmic RKRQ motif are shown as sticks (colored by atom) and the related residues (Q104, H203, K205 and K329) in MKK3 are also shown as sticks. The polar binding sites between ct-RAGE and MKK3 are marked with yellow dotted lines. (D) Histagged site mutants (Q104A, H203A, K205A, and K329A) of MKK3 were packaged in PcDNA3.1 plasmid and overexpressed in HEK-293T cells, then tested by western blotting with anti-His. (E) K329A mutation specifically blocked the MKK3-RAGE interaction. GST-tagged ct-RAGE was expressed in BL21 cells and then subjected to GST pull-down analysis. MKK3 in the HEK-293T cells lysate was pulled down by GST-tagged ct-RAGE, but MKK3 with the K329A mutation could not bind to ct-RAGE. (F) Diagram showing the structure of MKK3. K329 is located in the DVD site. (G) Vacuum electrostatics map showing the spatial structure of ct-RAGE in combination with MKK3. In MKK3, positively charged surfaces are shown in blue, negatively charged surfaces are shown in red, and neutral surfaces are shown in white. K329 of MKK3 and AAs 362-365 of ct-RAGE are shown.
Figure 3.
Figure 3.
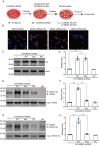
Mutation of K329A disrupts the RAGE-MKK3 interaction in a high-glucose environment. HG + LVMKK3-shRNA: MKK3-knockdown cells treated with high glucose; HG + LV-MKK3-shRNA + WT: HG + LVMKK3-shRNA cells with overexpression of wild-type MKK3; HG + LV-RAGE-shRNA + Mut: HG + LV-MKK3-shRNA cells with overexpression of the MKK3 K329 mutant; HG + LV-RAGE-shRNA + NC: HG + LV-MKK3-shRNA cells transfected with a nonsense control. (A) Schematic overview of the experimental design. (B) MKK3 wild-type and mutant were packaged in lentivirus and transfected into MKK3 knockdown HT-22 cells. (C) Expression of wild-type and mutant MKK3-His detected by western blotting with the His anti-body. (D) Optical density is presented as the fold change relative to the LV-MKK3-shRNA group. Data were assessed with a one-way ANOVA followed by Tukey's test. F (3, 12) = 129.00. *** p < 0.001. n = 4 in each group. (E and F) The combination of RAGE and His-MKK3 was detected by co-IP followed by western blotting with the His and RAGE antibodies respectively. (G and H) Optical density is shown as the fold change relative to the HG + MKK3-shRNA group. Data were analyzed with one-way ANOVAs followed by Tukey’s test. F (3, 12) =148.80 in D2 and 204.40 in E2. ***p < 0.001. n = 4 in each group.
Figure 4.
Figure 4.
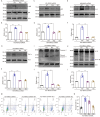
MKK3 mutation decreases p65 nuclear transcription, TNF-α and IL-6 levels, and caspase-1 and IL-1β cleavage in HT-22 cells by disrupting the RAGE-MKK3 interaction. (A) Phosphorylated p65 detected by Western blotting. (B) Relative intensity represented as the fold change relative to the HG + MKK3-shRNA group. Data were analyzed with a one-way ANOVA followed by Tukey’s test. F (3, 12) = 118.30. *** p < 0.001. n = 4 in each group. (C and D) Typical bands for p65 nuclear transcription and the relative intensity displayed as the fold change relative to the HG + MKK3-shRNA group. Data were analyzed with a one-way ANOVA followed by Tukey’s test. F (3, 12) = 93.32. *** p < 0.001. n = 4 in each group. (E-L) Expression of IL-6, TNF-α, cleaved caspase-1, and pro-IL-1β, and the relative intensity of these proteins presented as fold change relative to the HG + MKK3-shRNA group. Data were analyzed with one-way ANOVAs followed by Tukey’s test. F (3. 13) = 187.40 (C2), 74.16 (D2), 308.80 (E2) and 44.77 (F2) respectively. *** p < 0.001. n = 4 in each group. (M) Representative cellular flow cytometry images emerged cellular apoptosis. Dead cells in Q1, late apoptotic cells in Q2, viable apoptotic cells in Q3 and normal cells in Q4. (N) Apoptotic rate (number of cells in Q2 and Q3/total number of cells) were presented. One-way ANOVA followed by Tukey’s test was used. F(3, 28) = 102.50. *** p < 0.001; ** p = 0.003. n = 8 in each group.
Figure 5.
Figure 5.
K329A mutation reduces the RAGE-MKK3 interaction in the hippocampus of db/db mice. db/m: ageand sex-matched normoglycemic heterozygous littermates; db/db: diabetic model group; db/db + LV-MKK3-shRNA: db/db male mice that received LV-MKK3-shRNA; db/db + LV-MKK3-shRNA + WT: MKK3-knockdown db/db mice injected with wild-type MKK3; db/db + LV-MKK3-shRNA + Mut: MKK3-knockdown db/db mice injected with mutant MKK3; db/db + LV-MKK3-shRNA + NC: MKK3-knockdown db/db mice injected with nonsense control. (A) Schematic of the experimental design. (B and C) Inhibition of MKK3 was assessed by Western blotting; fold change is relative to the NC group. Data were analyzed with t tests, ** p = 0.002. (D and E) The level of wild-type and mutant MKK3 detected by western blotting; fold change is relative to the db/m group. Data were assessed with a one-way ANOVA followed by Tukey’s test. F (8, 18) = 93.04. ** p = 0.002; *** p < 0.001. n = 4 in each group. (F and G) Co-precipitation of RAGE with wild-type or mutant MKK3 was detected by co-IP followed by western blotting with RAGE and His antibodies respectively. (H and I) Optical density presented as the fold change relative to the db/db + MKK3-shRNA group. Results were analyzed with one-way ANOVAs followed by Tukey’s test. F (3, 12) = 63.64 (D2) and 115.30 (E2). *** p < 0.001. n = 4 in each group.
Figure 6.
Figure 6.
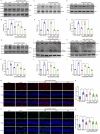
K329A mutation ameliorates neuroinflammation in the hippocampus by disrupting the interaction of MKK3 and RAGE. (A and B) Level of p-p65 assessed by western blotting with anti-p-65 antibody; optical density is shown as the fold change relative to the db/m group. Data were analyzed with a one-way ANOVA followed by Tukey’s test. F (5, 18) = 64.54. ** p = 0.002 (db/db + MKK3-shRNA + WT group vs db/db + MKK3-shRNA group); ** p = 0.001 (db/db + MKK3-shRNA + Mut group vs db/db + MKK3-shRNA + WT group); *** p < 0.001. n = 4 in each group. (C and D) Protein level of p65 assessed by western blotting; fold change is relative to the db/m group. Data were analyzed by one-way ANOVA followed by Tukey’s test. F (5, 18) = 218.70. *** p < 0.001. n = 4 in each group. (E-H) IL-6 and TNF-α expression levels assessed by Western blotting Optical density is presented as the fold change relative to the db/m group. Results were analyzed with one-way ANOVAs followed by Tukey’s test. F (5, 18) = 50.10 and 65.76 respectively. *** p < 0.001. n = 4 in each group. (I-L) Expression of cleaved caspase-1 and IL-1β; the fold change is relative to the db/m group. Data were analyzed with one-way ANOVAs followed with Tukey’s test. F (5, 18) = 47.87 and 81.79 respectively. *** p < 0.001; * p = 0.023 (E2) and 0.041 (F2). n = 4 in each group. (M) Microglia activation in the hippocampus detected by immunofluorescence with anti-IBA-1 antibody. IBA-1 is shown in red and cellular nuclei (DAPI) are shown in blue. IBA-1+ cells were considered to be activated microglia. Scale bar is 20 μm (magnification ×400). (N) Number of IBA-1+ microglia per 1-mm length. n = 4 in each group (two or three brain slices per mouse). Data were analyzed with a one-way ANOVA followed by Tukey’s test. F (5, 48) = 26.82. *** p < 0.001; ** p = 0.004 (db/db + MKK3-shRNA + WT group vs db/db + MKK3-shRNA group) and 0.007 ((db/db + MKK3-shRNA + Mut group vs db/db + MKK3-shRNA + WT group). (O) Representative images of astrocyte activation in the hippocampus. GFAP is shown in green and cellular nuclei (DAPI) are shown in blue. GFAP+ cells were considered to be activated astrocytes. Scale bar is 20 μm (magnification ×400). (P) Number of GFAP+ astrocytes per 1-mm length, n = 4 in each group (two or three brain slices per mouse). Data were assessed with a one-way ANOVA followed by Tukey’s test. F (5, 48) = 31.92. *** p < 0.001; ** p = 0.005.
Fig 7.
Fig 7.
MKK3 mutation ameliorates synaptic dysfunction in db/db mice. db/m: age- and sex-matched normoglycemic heterozygous littermates; db/db: diabetic model group; Mut: MKK3-knockdown db/db mice injected with mutant MKK3. (A and B) Representative traces and time-course of fEPSP slopes during LTP recordings in the hippocampus. Scale bars represent 0.5 mV and 10 ms. (C) MKK mutation rescued the LTP fEPSP deficit in db/db mice. The relative increase in fEPSPs during the last 10 min of recording was analyzed with a one-way ANOVA followed by Tukey’s test. n = 3 (two or three brain slices per mouse). F (2, 17) = 14.94. * p = 0.032, ** p = 0.003. (D) Representative paired-pulse traces. Scale bars represent 0.5 mV and 50 ms. (E) MKK3 mutation rescued the change in PPR in db/db mice. Data were analyzed with a one-way ANOVA followed by Tukey’s test. F (2, 17) = 9.13. * p = 0.042, ** p = 0.002. n = 3 (Two or three brain slices per mouse). (F) MKK3 mutation rescued the deficit in fEPSP amplitude in db/db mice. Data were analyzed by two-way ANOVA followed by Tukey’s test. q (60, 155) = 5.032 (db/db group vs db/m group) and 4.219 (Mut group vs db/db group). ** p = 0.004 (db/db group vs db/m group) and 0.001 (Mut group vs db/db group) respectively. n = 4 (three or four brain slices per mouse). (G) Dendritic branches in hippocampal neurons were detected by Golgi staining. Scale bar is 50 μm (magnification ×200). (H) Thenumber of dendritic intersections was analyzed by Sholl analysis. Data were analyzed with a two-way repeated-measures ANOVA followed by Tukey's test. n = 4 (three brain slices per mouse). 30 μm to 120 μm from the soma, db/db compared with db/m, *** p < 0.001. 40 and 50 μm from the soma, Mut group compared with db/db, * p = 0.025 and 0.021 respectively. 60 μm to 120 μm from the soma, Mut group compared with db/db, *** p < 0.001. (I) Representative images showing dendritic spine density and morphology. Scale bar is 10 μm (magnification ×600). (J) Dendritic spine number was counted in Image J, and data were analyzed with a one-way ANOVA followed by Tukey's test. F (2, 45) = 20.98. *** p < 0.001; ** p = 0.005. n = 4 (three or four sections per mouse). (K and L) Immunoblotting analysis of PSD95 levels in the hippocampus of db/db mice in which endogenous MKK3 was knocked down and replaced with mutated MKK3. Fold change is relative to the db/m group, and data were analyzed with a one-way ANOVA followed by Tukey’s test. *** P < 0.001; ** P = 0.004. F (2, 6) = 254.30. (M and N) Representative bands for synaptophysin; fold change is relative to the db/m group. Data were analyzed with a one-way ANOVA followed by Tukey’s test. F (2, 6) = 137.90. *** p < 0.001. n = 4 in each group.
Figure 8.
Figure 8.
MKK3 mutation ameliorates cognitive impairments in db/db mice. (A) Average escape latency of mice to reach the platform on five consecutive training days in the Morris water maze. Data were analyzed with a two-way ANOVA and Tukey's multiple comparisons test, n = 8 in each group. On the fourth day, *** p < 0.001; ** p = 0.002; * p = 0.028. q (8, 210) = 6.05 (db/db group vs db/m group), 5.50 (db/db + MKK3-shRNA group vs db/db group), 6.64 (db/db + MKK3-shRNA + Wt group vs db/db + MKK3-shRNA group), 4.36 (db/db + MKK3-shRNA + Mut group vs db/db + MKK3-shRNA + Wt group). On the fifth day, *** p < 0.001. q (8, 210) = 13.37 (db/db group vs db/m group), 11.30 (db/db + MKK3-shRNA group vs db/db group), 11.34 (db/db + MKK3-shRNA + Wt group vs db/db + MKK3-shRNA group), 7.03 (db/db + MKK3-shRNA + Mut group vs db/db + MKK3-shRNA + Wt group). (B) Swimming speed during the probe trial (no platform) on the sixth day. Data were analyzed with a one-way ANOVA and Tukey’s test. n = 8 in each group. *** p < 0.001. (C) Track maps of the probe trial on the sixth day (the red dot indicates the start, and the blue dot indicates the end). (D and E) Percentage of distance and time spent in the target quadrant during the probe trial (n = 8 mice per group). Data were analyzed with one-way ANOVAs followed by Tukey’s test. F (5, 42) = 39.21 in A4 and 67.33 in A5. *** p < 0.001. (F) Schematic of the novel object recognition task. (G) Discrimination index. n = 8 in each group. Results were analyzed with a one-way ANOVA followed by Tukey’s test. F (5, 42) = 4.08. *** p < 0.001; ** p = 0.004 (db/db + MKK3-shRNA + Wt group vs db/db + MKK3-shRNA group) and 0.005 (db/db + MKK3-shRNA + Mut group vs db/db + MKK3-shRNA + Wt group). (H) Schematic of the fear conditioning test. (I) Percentage of time spent freezing in the contextual and cued fear conditioning trials. Data were analyzed with one-way ANOVAs followed by Tukey's test. n = 8 in each group. F (4, 35) = 13.02 for contextual fear conditioning, whereas F (4, 35) = 9.27 for cued fear conditioning. In the contextual fear conditioning, ** p = 0.003 (db/db vs db/m), 0.002 (db/db + MKK3-shRNA + Wt group vs db/db + MKK3-shRNA group) and 0.002 (db/db + MKK3-shRNA + Mut group vs db/db + MKK3-shRNA + Wt group); * p = 0.016 (db/db + MKK3-shRNA vs db/db group). In the cued fear conditioning, * p = 0.037 (db/db vs db/m).
Figure 9.
Figure 9.
Graphical abstract illustrating the mechanism by which the MKK3-RAGE interaction regulates cognition in db/db mice. Direct binding of MKK3 K329 to ct-RAGE AAs 2-5 facilitates neuroinflammation, causing cognitive decline. Mutation of K329 ameliorates the cognitive decline by blocking the interaction between MKK3 and RAGE.

Similar articles

Cited by

References

    1. Ahmad E, Lim S, Lamptey R, Webb DR, Davies MJ (2022). Type 2 diabetes. Lancet, 400(10365): 1803-1820. - PubMed
    1. Sun H, Saeedi P, Karuranga S, Pinkepank M, Ogurtsova K, Duncan BB, et al.. (2022). IDF Diabetes Atlas: Global, regional and country-level diabetes prevalence estimates for 2021 and projections for 2045. Diabetes Res Clin Pract, 183: 109-119. - PMC - PubMed
    1. Cukierman T, Gerstein HC, Williamson JD (2005). Cognitive decline and dementia in diabetes-systematic overview of prospective observational studies. Diabetologia, 48: 2460-2469. - PubMed
    1. Dove A, Shang Y, Xu W, Grande G, Laukka EJ, Fratiglioni L, et al.. (2021). The impact of diabetes on cognitive impairment and its progression to dementia. Alzheimers Dement, 17(11):1769-1778. - PubMed
    1. Biessels GJ, Nobili F, Teunissen CE, Simó R, Scheltens P (2020). Understanding multifactorial brain changes in type 2 diabetes: a biomarker perspective. Lancet Neurol, 19(8): 699-710. - PubMed

LinkOut - more resources