. 2024 Mar 26;43(3):113844.
doi: 10.1016/j.celrep.2024.113844. Epub 2024 Feb 27.

Neuron cilia restrain glial KCC-3 to a microdomain to regulate multisensory processing

Affiliations

Neuron cilia restrain glial KCC-3 to a microdomain to regulate multisensory processing

Sneha Ray et al. Cell Rep. .

Abstract

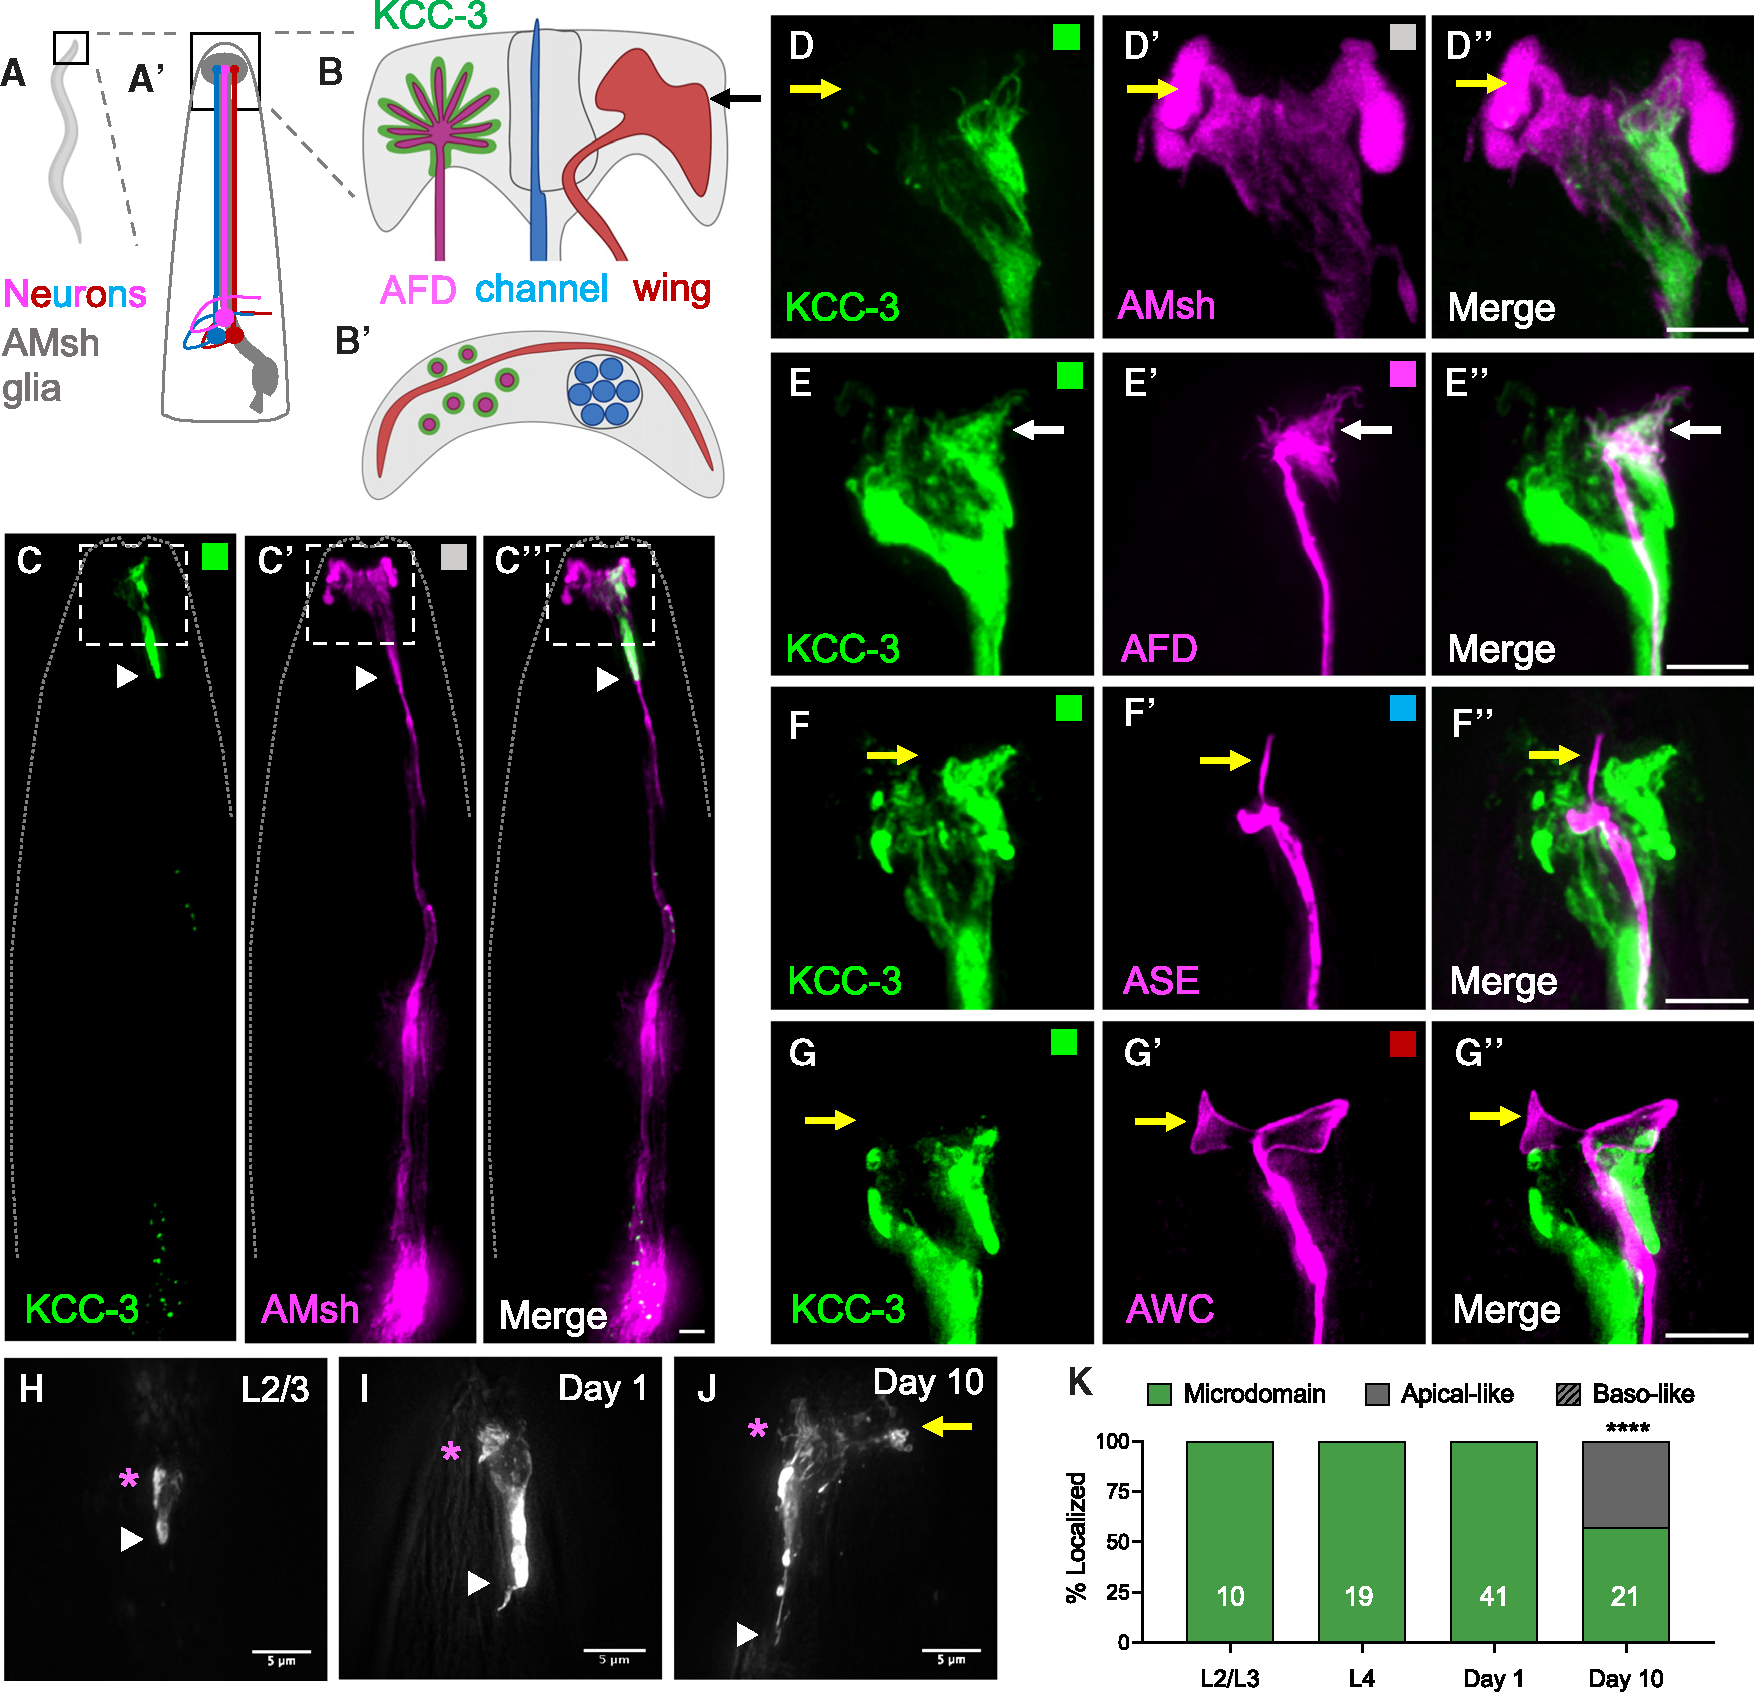
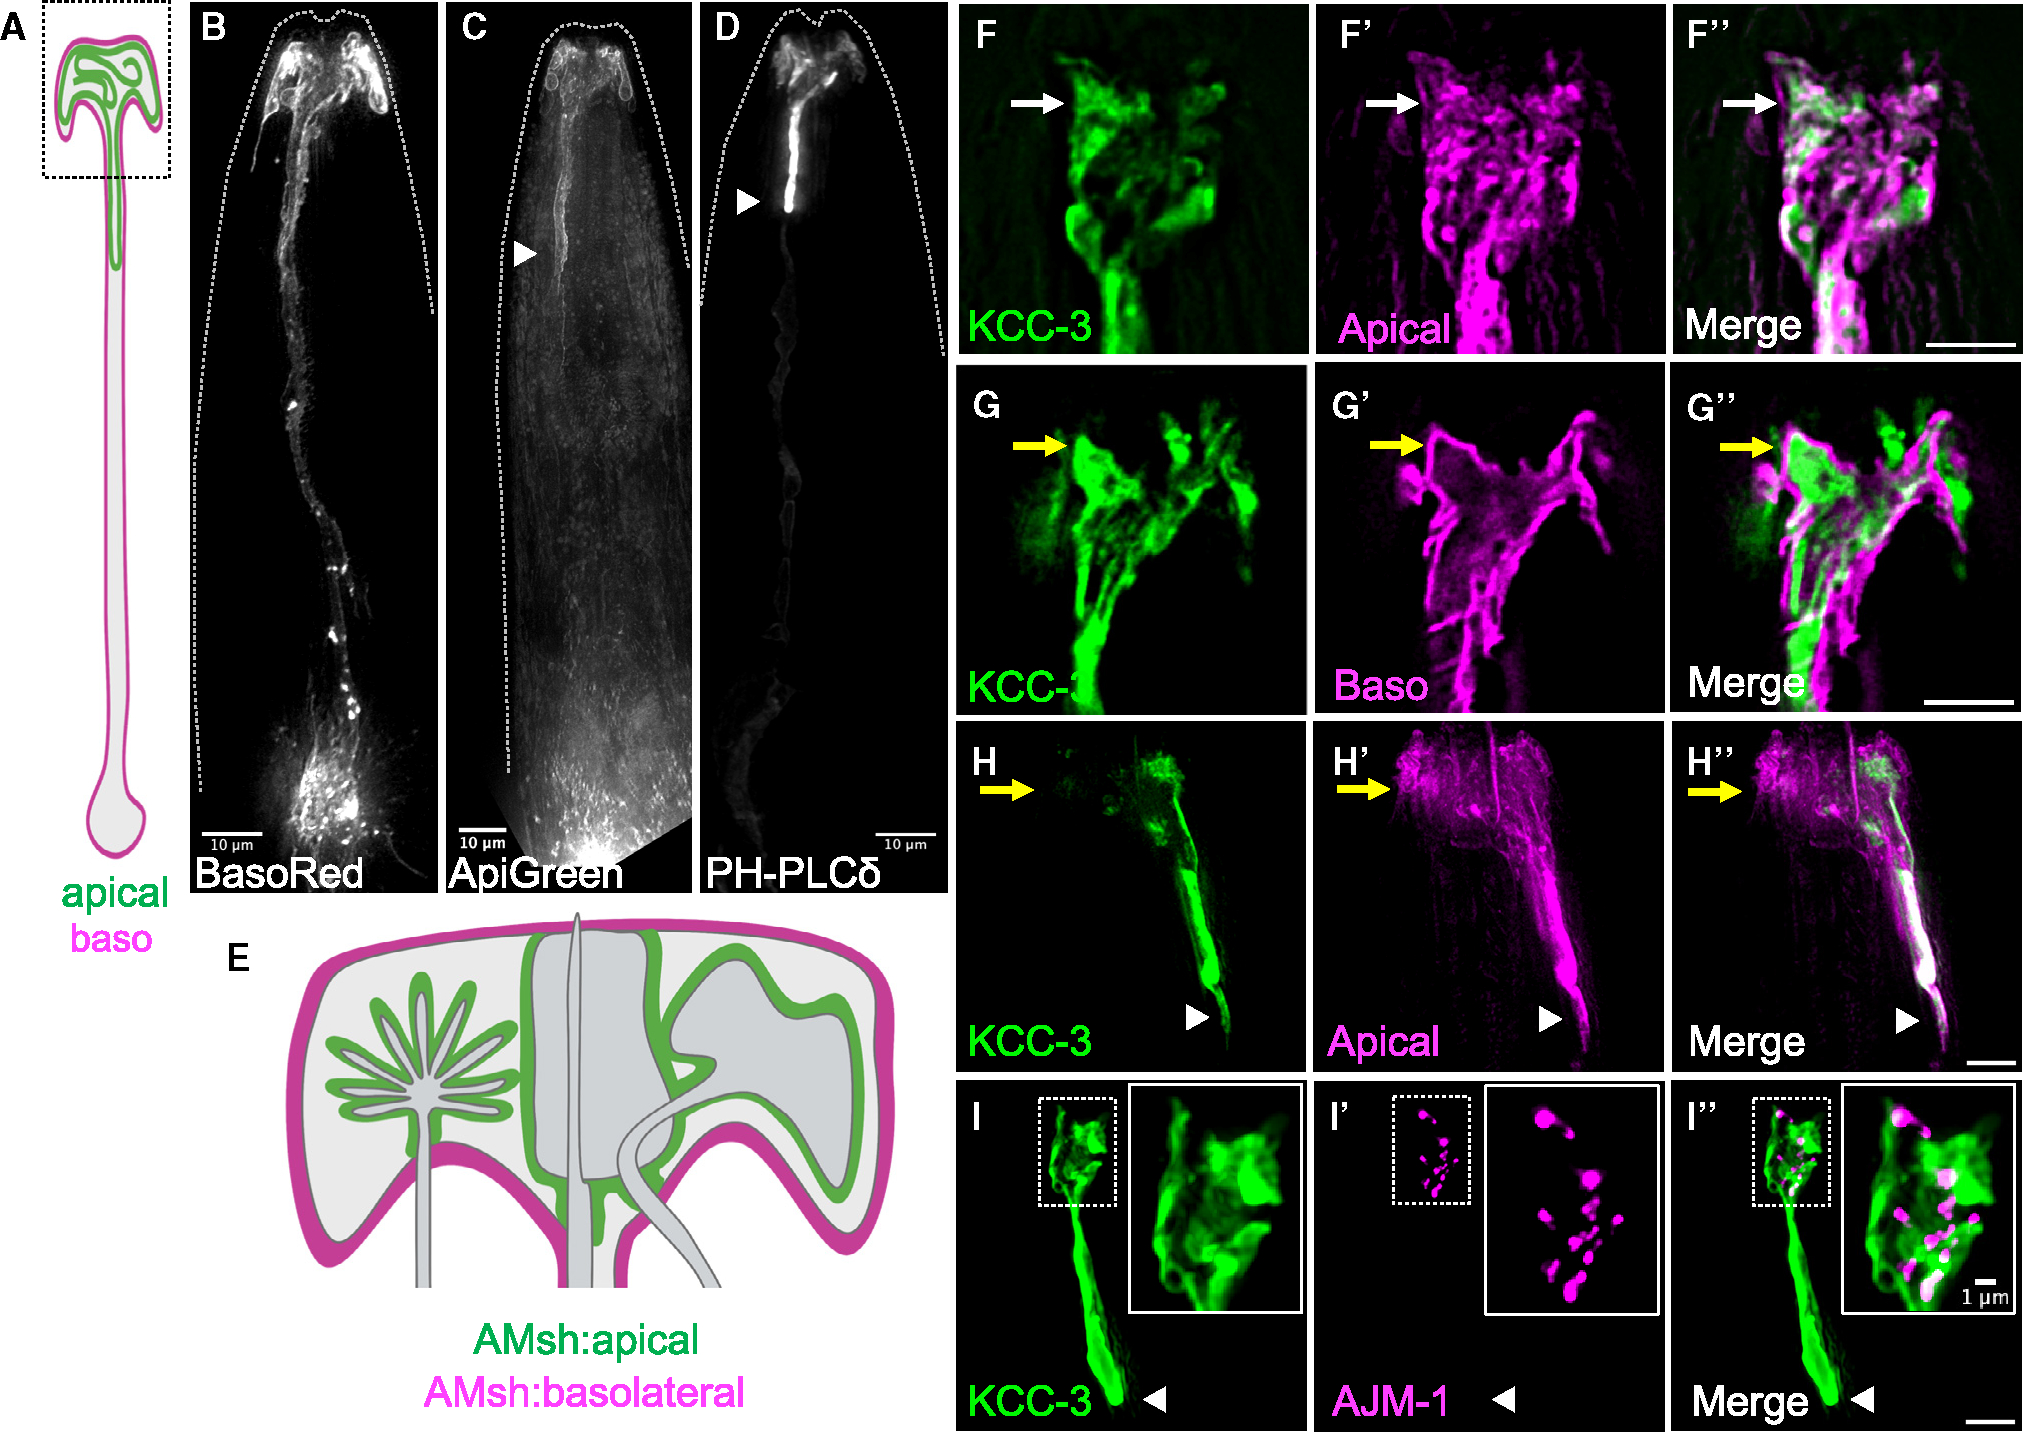
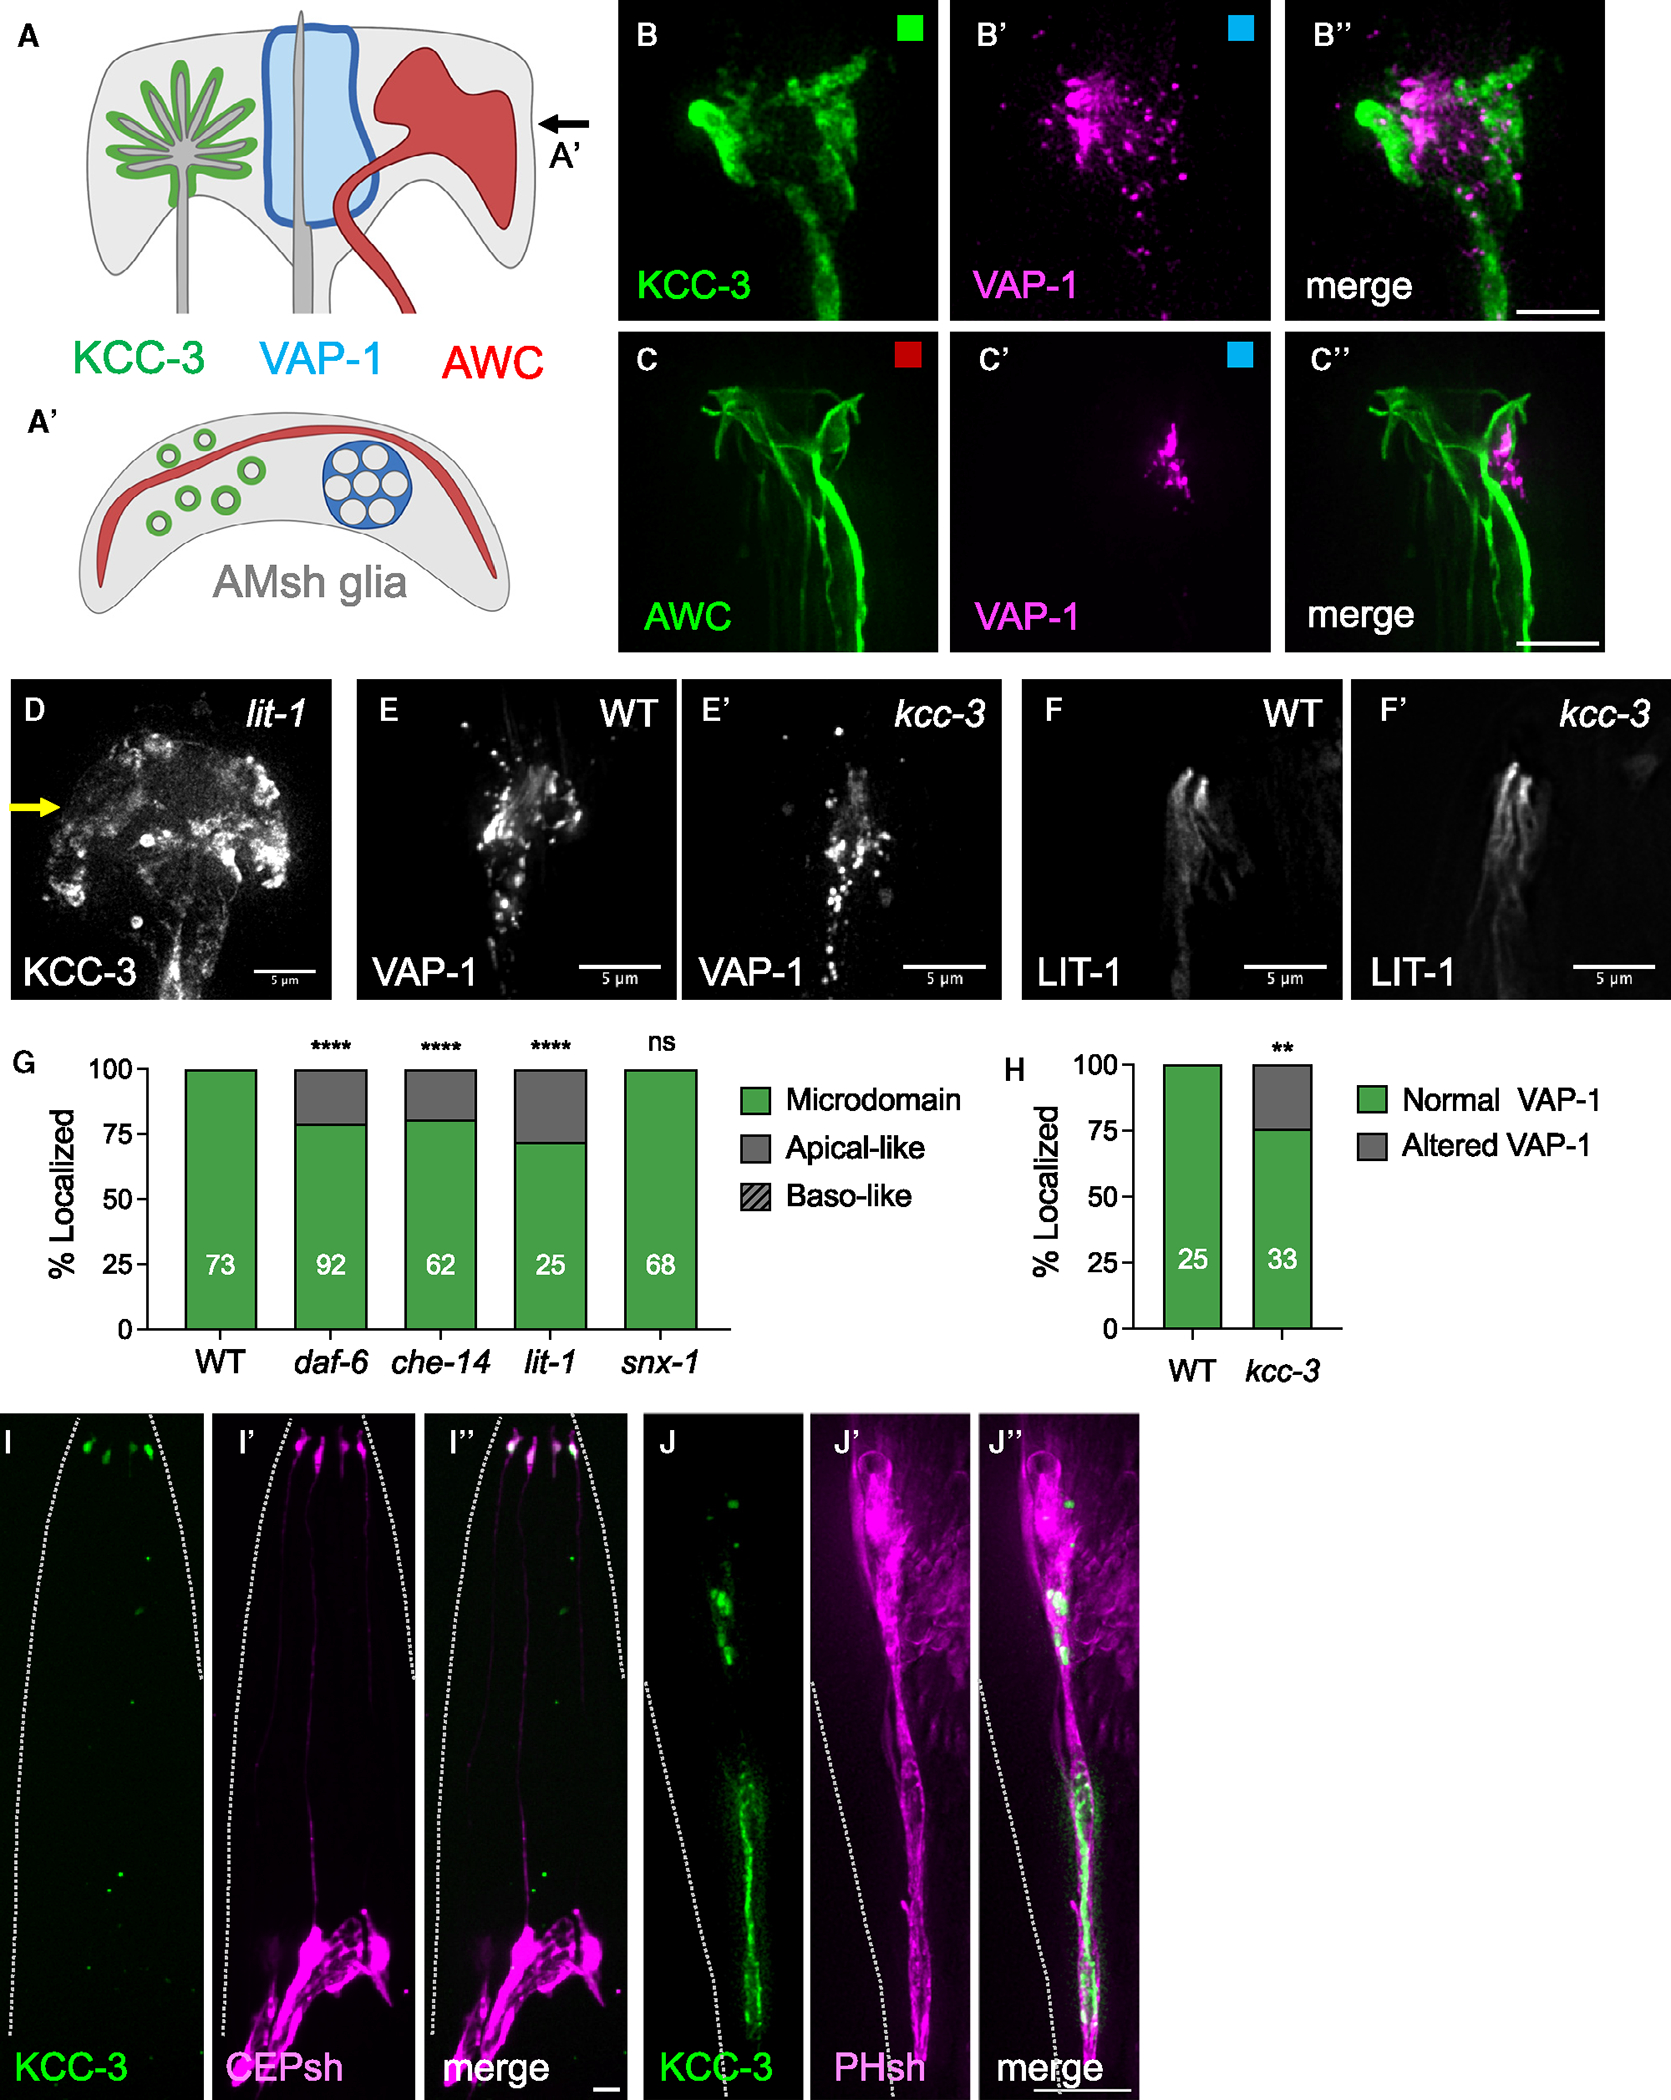
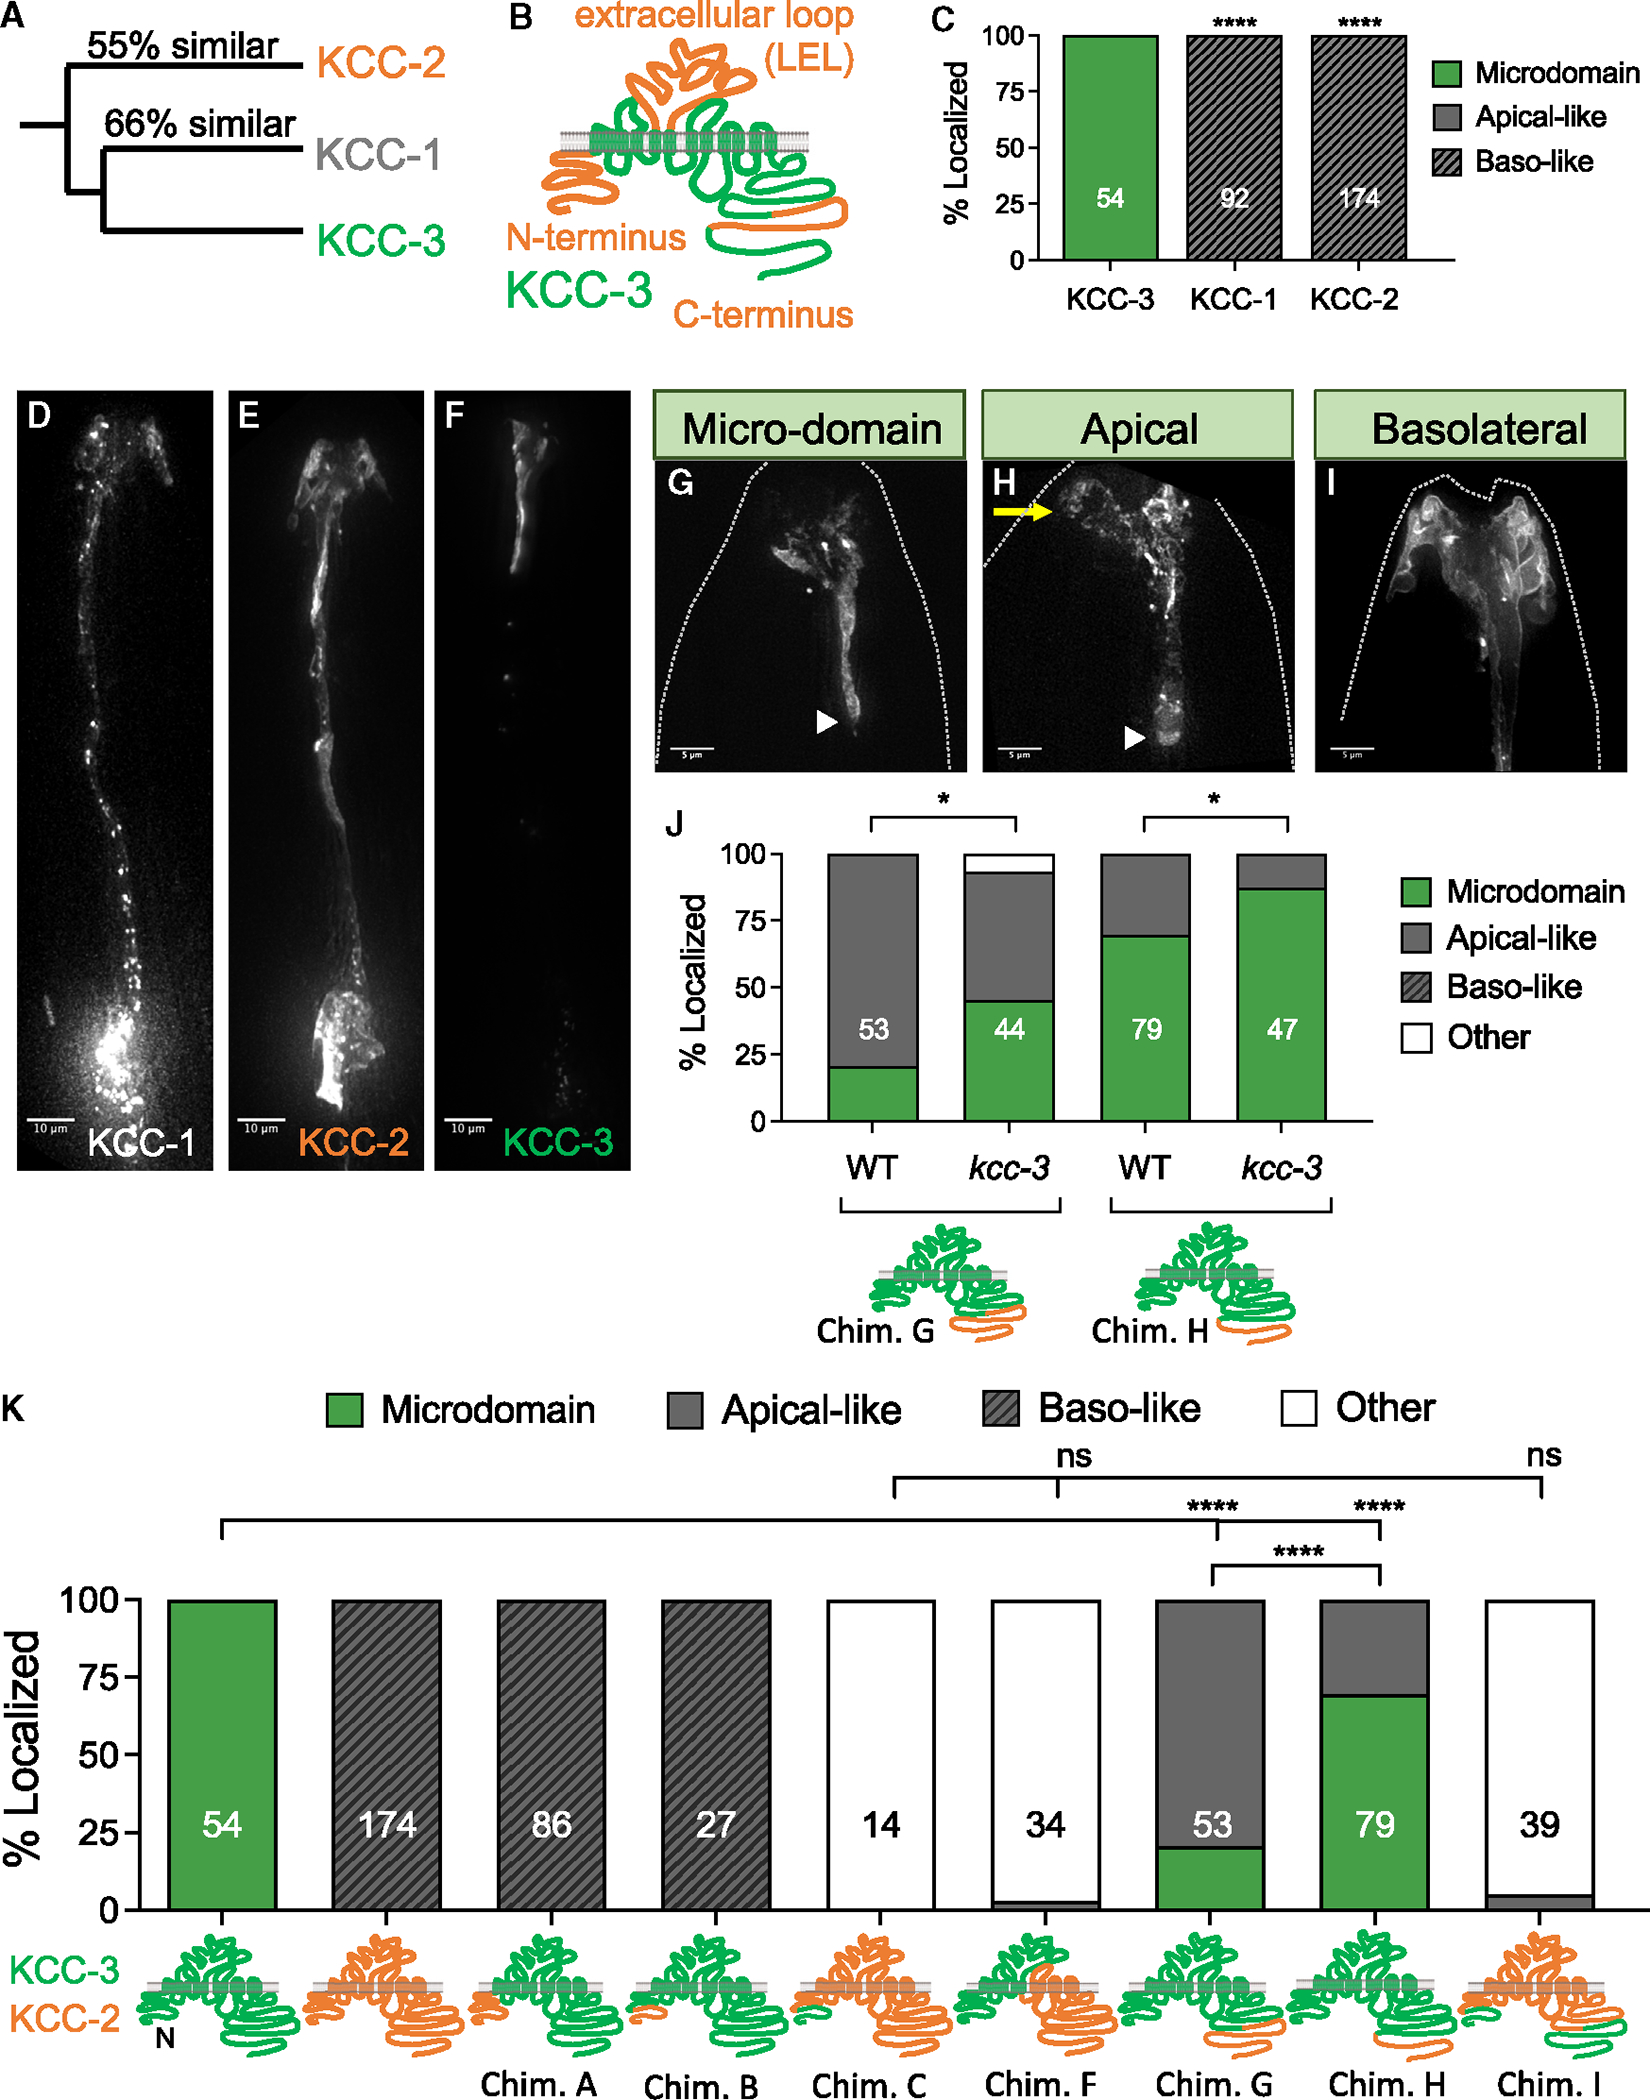
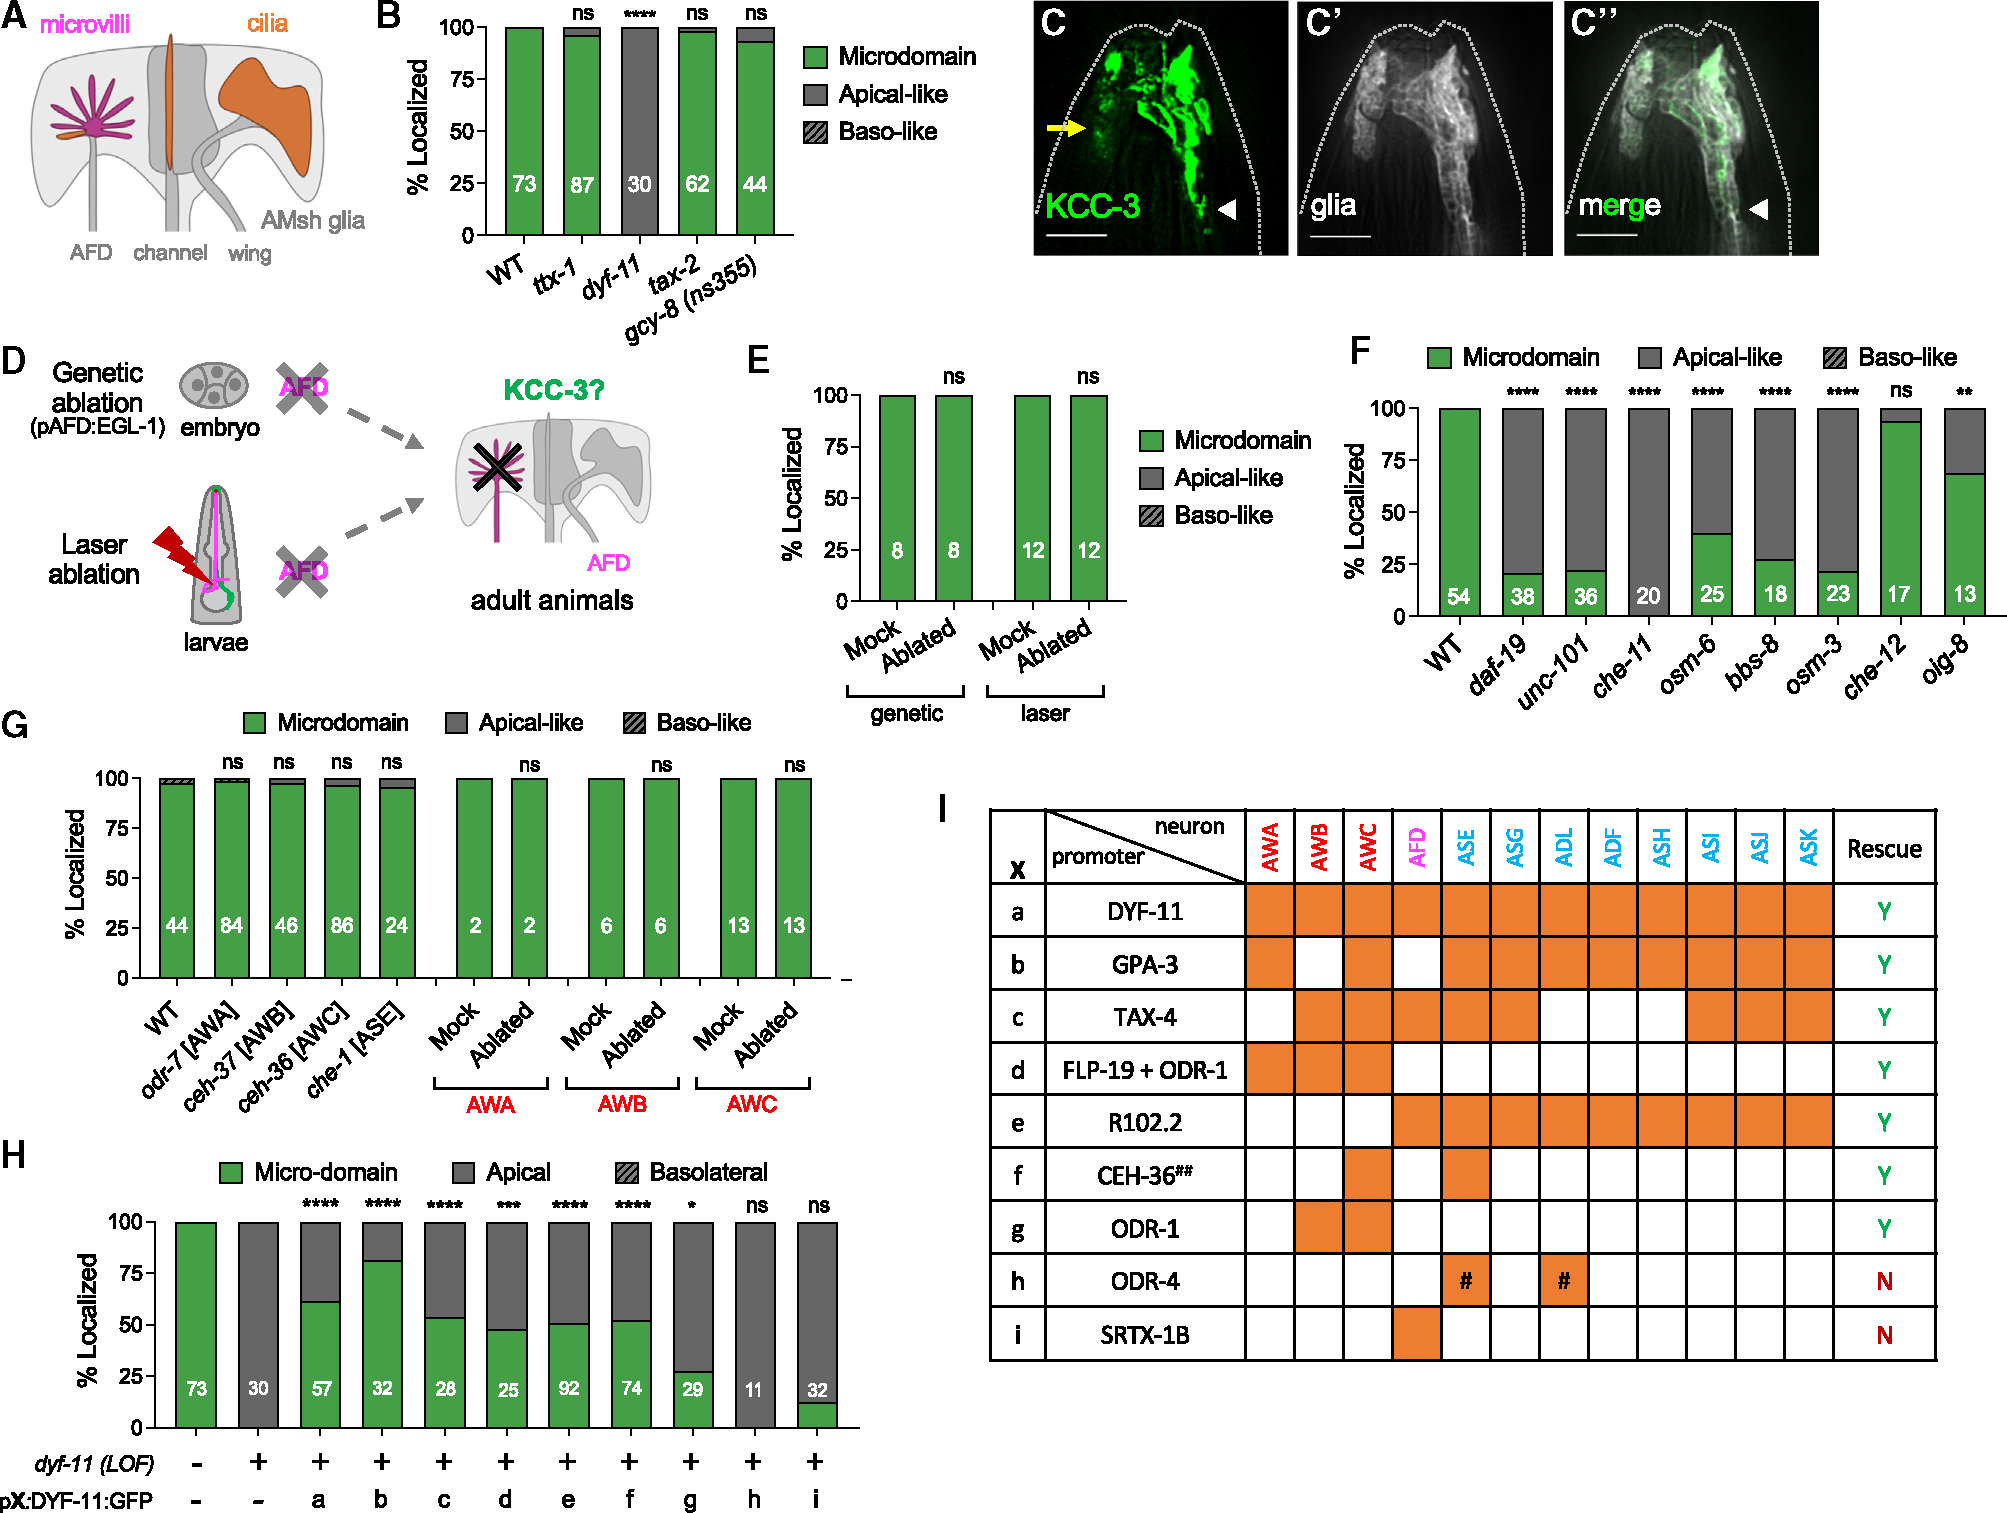
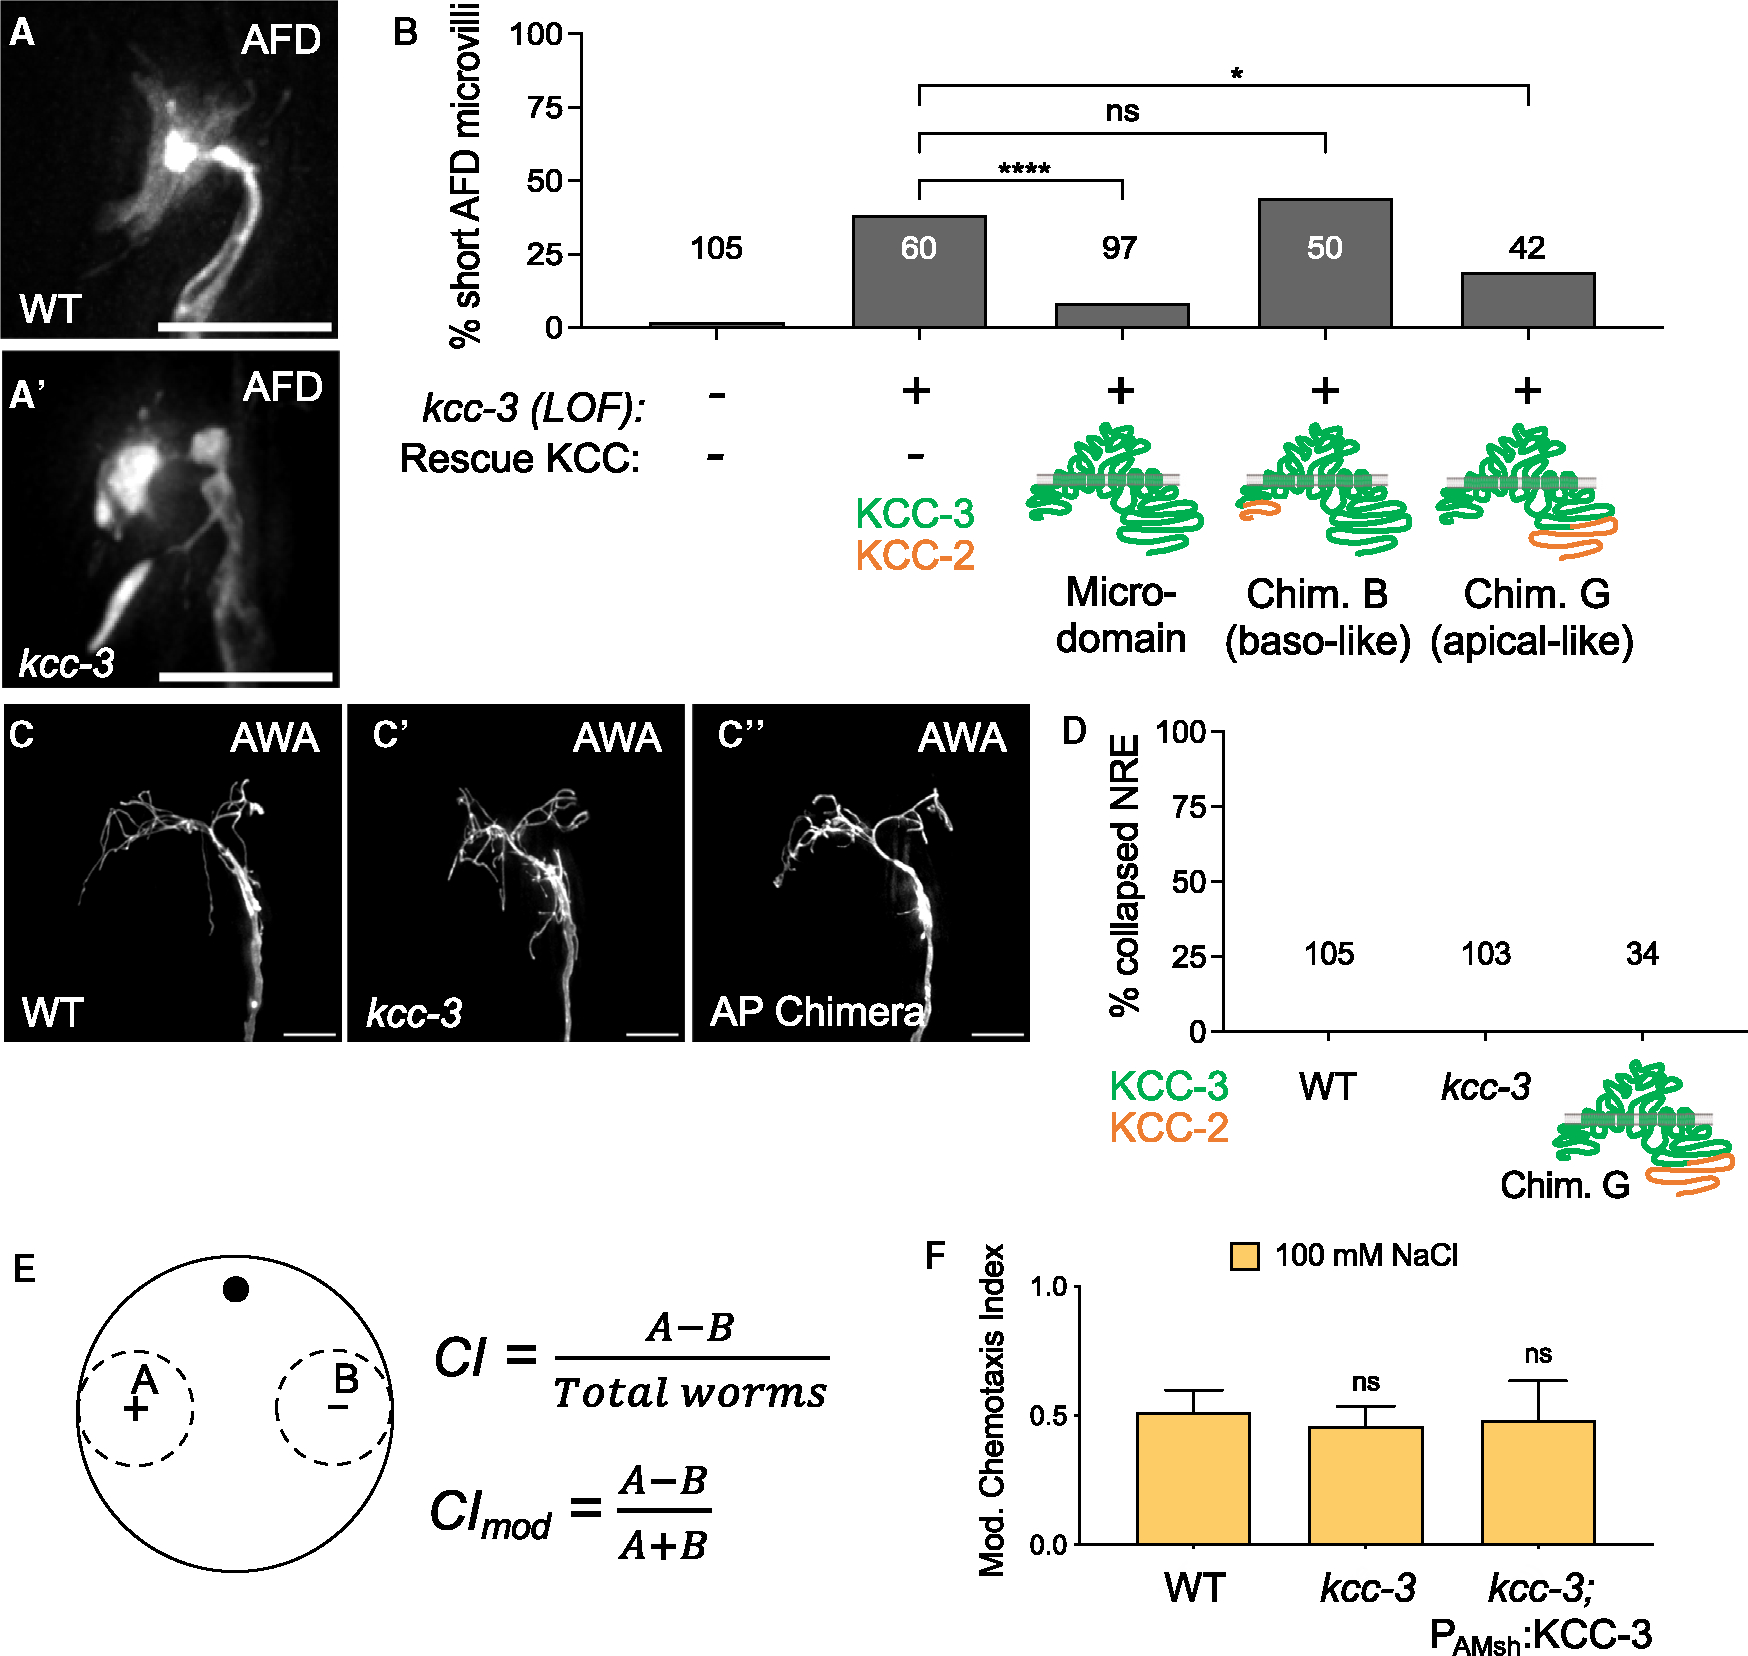
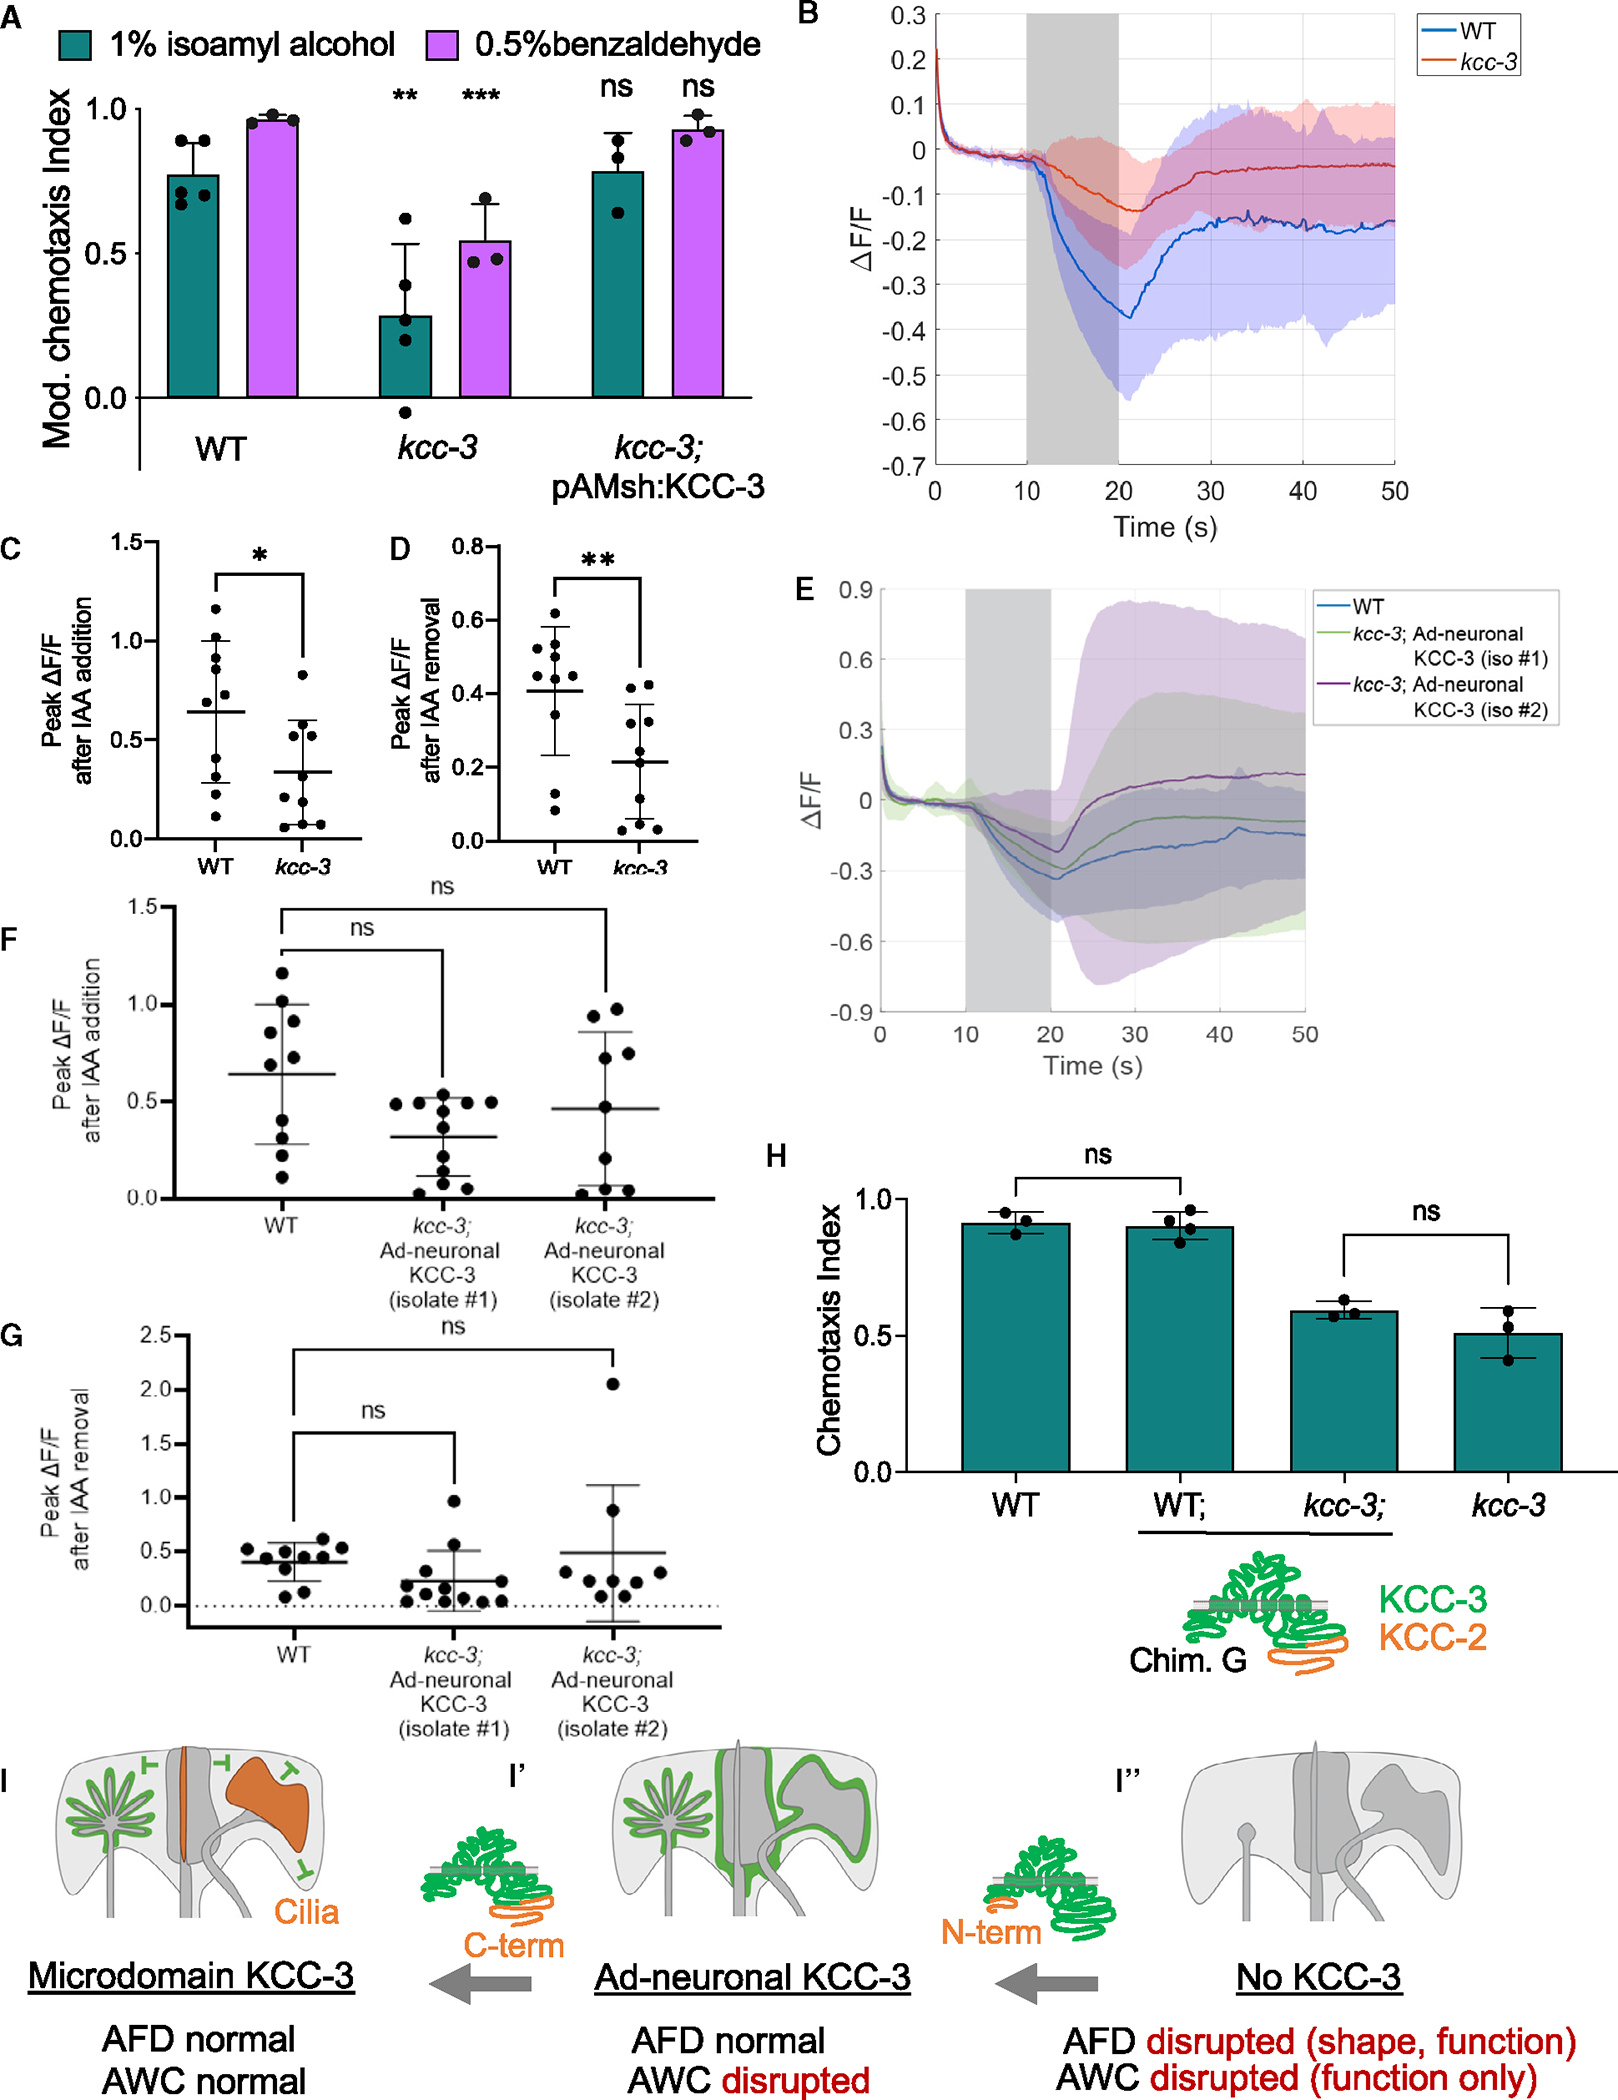
Glia interact with multiple neurons, but it is unclear whether their interactions with each neuron are different. Our interrogation at single-cell resolution reveals that a single glial cell exhibits specificity in its interactions with different contacting neurons. Briefly, C. elegans amphid sheath (AMsh) glia apical-like domains contact 12 neuron-endings. At these ad-neuronal membranes, AMsh glia localize the K/Cl transporter KCC-3 to a microdomain exclusively around the thermosensory AFD neuron to regulate its properties. Glial KCC-3 is transported to ad-neuronal regions, where distal cilia of non-AFD glia-associated chemosensory neurons constrain it to a microdomain at AFD-contacting glial membranes. Aberrant KCC-3 localization impacts both thermosensory (AFD) and chemosensory (non-AFD) neuron properties. Thus, neurons can interact non-synaptically through a shared glial cell by regulating microdomain localization of its cues. As AMsh and glia across species compartmentalize multiple cues like KCC-3, we posit that this may be a broadly conserved glial mechanism that modulates information processing across multimodal circuits.

Keywords: AFD; C. elegans; CP: Neuroscience; KCC-3; cell polarity; cilia; glia; glial microdomain; neuron-glia signaling; sensory processing.


Conflict of interest statement

Declaration of interests The authors declare no competing interests.

Figures

Figure 1.
Figure 1.. KCC-3 localizes specifically around AFD-NRE
(A and A′) Schematic of a whole C. elegans (A) with a magnified region of the head (A′) showing a schematic of AMsh glia (gray) and three contacting neurons (magenta, red, and blue). (B and B′) Schematic of AMsh glial contact sites with microvilli of AFD (magenta), channel (blue), and embedded wing (red) neurons as side profiles (B) and a top-down orthogonal view (B′) at the plane denoted by the arrow line in (B). Only one of the bilateral glia-neuron pairs is shown. (C–C″) Fluorescent images of AMsh KCC-3 (C, green), AMsh glia (C′, magenta), and merge (C″, 8/8 animals). A dashed line indicates the outline of the animal. (D–G″) Magnification the region in the white dotted boxes in C–C″. (D–D″) Fluorescence images of AMsh KCC-3 (D, green), AMsh glia (D′, magenta), and merge (D″) showing restricted microdomain localization of KCC-3 (38/38 animals). Yellow arrows denote the region of AMsh glia that lacks KCC-3. (E–E″) Fluorescence images of AMsh KCC-3 (E, green), an AFD neuron (E′, magenta), and merge (E″) showing KCC-3 localization to AFD-NREs (white arrows, 30/30 animals). (F–F″) Fluorescence images of AMsh KCC-3 (F, green), an ASE neuron (F′, magenta), and merge (F″) showing lack of KCC-3 localization to ASE-NREs (yellow arrows, 15/15 animals). (G–G″) Fluorescence images of AMsh KCC-3 (F, green), AWC neuron (F′, magenta), and merge (F″) showing lack of KCC-3 localization to AWC-NREs (yellow arrows, 20/20 animals). (C–G′) Colored boxes correspond to schematic colors in (B). (H–J) Fluorescence images of KCC-3 expressed under the AMsh-specific promoter (PF53F4.13) in L2/L3 larvae (H), day 1 adults (I), and day 10 adults (J). Magenta asterisks denote regions of AFD enrichment. A yellow arrow denotes expansion of KCC-3 beyond the microdomain. White arrowheads denote the GAB. (K) Quantification of KCC-3 localization with age. n = number of animals on graph. ****p < 0.0001 compared with day 1 adults (Fisher’s exact test). Scale bars: 5 μm. All imaging data were gathered across multiple days/biological replicates. See also Figure S1.
Figure 2.
Figure 2.. KCC-3 localizes to a glial apical microdomain in an age-dependent manner
(A) Schematic of AMsh glia with apical and basolateral (baso) membranes marked. (B–D) Fluorescence images of AMsh membranes tagged with BasoRed (B, 37/37 animals), ApiGreen (C, 24/24 animals), and a PH-PLC apical marker (D, 15/15 animals). Dashed lines indicate the outline of the animal. (E) Magnification of the AMsh glia in the black dotted box in (A). (F–F″) Fluorescence images of AMsh KCC-3 (F, green), truncated SAX-7 labeling AMsh apical membranes (F′, magenta), and merge (F″). White arrows denote overlay between KCC-3 and the AMsh apical marker (5/5 animals). (G–G″) Fluorescence images of Pkcc-3:KCC-3:GFP (G, green), full-length SAX-7 labeling AMsh basolateral membranes (G′, magenta), and merge (G″). KCC-3 present outside of AMsh basolateral membranes is derived from other glia. Yellow arrows denote lack of co-localization between KCC-3 and AMsh basolateral membranes (4/4 animals). (H–H″) Fluorescence images of AMsh KCC-3 (H, green), truncated SAX-7 labeling AMsh apical membranes (H′, magenta), and merge (H″). Yellow arrows denote the region of AMsh apical membranes that lacks KCC-3. KCC-3 and the AMsh apical marker co-localize at the GAB (3/3 animals). (I–I″) Fluorescence images of AMsh KCC-3 (I, green), the tight junction protein AJM-1 (I′, magenta), and merge (I″). Note the lack of AJM-1 protein at the GAB (7/7 animals). Insets: magnification of the white dotted box. White arrowheads denote the GAB. Scale bars: 5 μm unless otherwise noted. All imaging data were collected over multiple days/biological replicates. See also Figure S2.
Figure 3.
Figure 3.. Microdomains as a general feature of glia
(A and A′) Schematic of multiple microdomains in AMsh glia as a side profile (A) and top-down orthogonal view (A′) at the plane denoted by the arrow in (A). The KCC-3 microdomain is shown in green, the VAP-1 channel microdomain in blue, and the AWC wing neuron microdomain in red. (B–B″) Fluorescence images of KCC-3 (B, green), VAP-1 (B′, magenta), and merge (B″) denoting separate microdomains (5/5 animals). (C–C″) Fluorescence images of AWC (C, green), VAP-1 (C′, magenta), and merge (C″) denoting separate microdomains (4/4 animals). (B–C′) Colored boxes in correspond to schematic colors in (A). (D) Fluorescence image of KCC-3 in lit-1 mutants. A yellow arrow indicates expansion of KCC-3 beyond the microdomain. (E and E′) Fluorescence images of VAP-1 in wild-type (E) and kcc-3 mutant (E′) backgrounds. (F and F′) Fluorescence images of LIT-1–1 in wild-type (F) and kcc-3 mutant (F′) backgrounds. (G) Quantification of KCC-3 localization in daf-6, che-14, lit-1, and snx-1 mutants. Data represent 2–4 biological replicates. (H) Quantification of VAP-1 localization in the wild type (WT) and kcc-3 mutant. Data represent 3 biological replicates. (I–I″) Fluorescence images of KCC-3 expressed under the CEPsh-specific Phlh-17 promoter (I, green), CEPsh glia (I′, magenta), and overlay (I″) denoting apical KCC-3 (5/5 animals). (J–J″) Fluorescence images of KCC-3 expressed under the AMsh/PHsh-specific PF53F14.13 promoter (J, green), PHsh glia (J′, magenta), and overlay (J″) denoting apical KCC-3 (7/7 animals). Dashed lines in (I–J″) indicate the outline of the animal. **p < 0.01, ****p < 0.0001. Fisher’s exact test. Scale bars: 5 μm. n = number of animals on graph. All imaging data were collected over multiple days/biological replicates.
Figure 4.
Figure 4.. Glial KCC-3 localizes in a two-step process through two protein regions
(A) Phylogenetic tree denoting the relationship and sequence similarity of the three C. elegans KCC proteins. (B) Regions of high sequence dissimilarity between KCC-3 and KCC-1/2 from in silico sequence alignment studies, with orange denoting regions of high sequence dissimilarity. (C) Quantification of KCC-1 and KCC-2 localization when expressed in AMsh glia compared with KCC-3. Data represent 3–5 biological replicates and 1–2 technical replicates. (D–F) Fluorescence images of KCC-1 (D), KCC-2 (E), and KCC-3 (F). Scale bars: 10 μm. (G–I) Fluorescence images of KCC localization patterns seen in KCC chimeras. A yellow arrow points to apical expression beyond the microdomain. A white arrowhead denotes the glial apical boundary (GAB). Dashed lines indicate the outline of the animal. Scale bar: 5 μm. (J) Quantification of localization patterns seen in KCC chimeras in WT and kcc-3 mutant backgrounds. Data represent 2–3 biological replicates and 1–3 technical replicates. (K) Quantification of localization patterns seen in KCC chimeras. Worms were assessed over 2–5 biological replicates. *p < 0.05, ****p < 0.0001, Fisher’s exact test. n = number of animals on graph. All imaging data were collected over multiple days/biological replicates. See also Figure S14.
Figure 5.
Figure 5.. Glial KCC-3 localization is regulated by distal non-AFD-NRE cilia
(A) Schematic showing distribution of microvilli and cilium structures in amphid NREs. (B) Quantification of KCC-3 localization in ttx-1, dyf-11, tax-2, and gcy-8(ns355) mutants compared with the WT. Data represent 2–3 biological replicates. (C–C″) Fluorescence images of KCC-3 (C, green), AMsh glia (C′, gray), and merge (C″) in dyf-11 cilium mutant animals. A yellow arrow points to apical expression beyond the microdomain. White arrowheads denote the GAB. Dashed lines indicate the outline of the animal. Scale bar: 5 mm. (D) Schematic of genetic and laser ablation protocols to assess KCC-3 localization without AFD. (E) Quantification of KCC-3 localization in adults after genetic and laser ablation compared with mock animals. Data represent 2 biological replicates. (f) KCC-3 localization in cilium mutants. Data represent 1–3 biological replicates. (G) Quantification of KCC-3 localization in amphid neuron identity mutants (odr-7, ceh-37, ceh-36, and che-1) and after wing neuron (AWA, AWB, and AWC) laser ablation. Data represent 1–4 biological replicates. (H and I) Quantification of KCC-3 localization in DYF-11 rescue experiments (H). X refers to promoter(s) used for rescue experiments. The identity of X and the neurons in which the promoter(s) is (are) expressed are expanded in (I). Orange denotes expression in associated neurons. #, ODR-4 expresses in an ASX and an ADX neuron, but the exact identity of these neurons is unclear. ##, the CEH-36 rescue construct also has ODR-10 and R13H4.1, but only CEH-36 showed expression. Data represent 2–5 biological replicates and 1–3 technical replicates. *p < 0.05, **p < 0.01, ***p < 0.001, ****p < 0.0001; Fisher’s exact test to WT. n = number of animals on graph. See also Figure S5.
Figure 6.
Figure 6.. Microdomain localization of KCC-3 regulates AFD shape
(A and A′) Fluorescence images of AFD-NRE in WT (A) and kcc-3(ok228) mutants (A′). (B) Quantification of AFD-NRE shape rescue with WT KCC-3, a basolaterally localized KCC-2/KCC-3 chimera (chimera B), and an apically localized KCC-2/KCC-3 chimera (chimera G). Fisher’s exact test. *p < 0.05, ****p < 0.0001. (C–C″) Fluorescence images of AWA in WT animals (C), kcc-3 mutant animals (C′), and animals that express the apically localized KCC-3 chimera (C″, AP chimera). (D) Quantification of AWA shape in WT animals, kcc-3 mutant animals, and animals that express the apically localized KCC-3 chimera (chimera G). Fisher’s exact test. (E) Schematic of chemotaxis assays, including the equations for the chemotaxis index (CI) and modified chemotaxis index (CImod). (F) Behavioral quantifications for ASE-sensed tastant (100 mM NaCl). Data show mean + SD. One-way ANOVA with Tukey’s post hoc test. Scale bars: 5 μm. n = number of animals on graph. Data represent at least 2 biological replicates. See also Figure S6.
Figure 7.
Figure 7.. Schematic of KCC-3 localization in AMsh glia
(A) Behavioral quantification of AWC-sensed odorants (1% isoamyl alcohol [IAA] and 0.5% benzaldehyde). Data show mean + SD. Significance compared with the WT. One-way ANOVA, Tukey’s post hoc test. **p < 0.01, ***p < 0.001. (B) Averaged raw calcium transients in animals with the addition of 0.01% IAA in AWC neurons expressing GCaMP6s. Solid lines represent the average across 10–12 different animals in WT (blue) and kcc-3 (red) backgrounds. (C) Peak calcium responses when the animal is presented with a stimulus (p = 0.043, Mann-Whitney test). (D) Peak calcium responses when IAA was removed (p = 0.0068, Mann-Whitney test). (E) Averaged raw calcium transients in WT animals and two independently derived transgenic animal strains expressing the ad-neuronal KCC-3 in the kcc-3 mutant background. (F and G) Peak calcium responses when IAA was added and removed, respectively (p = 0.15, p = 0.059, Kruskal-Wallis test). (H) Behavioral quantification of AWC-sensed odorant (1% IAA) with animals expressing ad-neuronal KCC-3. Data show mean + SD. One-way ANOVA, Tukey’s post hoc test. (I–I″) KCC-3 localization in a two-step process regulates multisensory processing. N-terminal sequences dictate ad-neuronal vs. basolateral localization. Neuron cilia as well as C-terminal KCC sequences determine microdomain localization. Data represent at least 2 biological replicates. See also Figure S7.

Similar articles

Cited by

References

    1. von Bartheld CS, Bahney J, and Herculano-Houzel S (2016). The Search for True Numbers of Neurons and Glial Cells in the Human Brain: A Review of 150 Years of Cell Counting. J. Comp. Neurol. 524, 3865. 10.1002/CNE.24040. - DOI - PMC - PubMed
    1. Barres BA (2008). Perspective The Mystery and Magic of Glia : A Perspective on Their Roles in Health and Disease. Neuron 60, 430–440. 10.1016/j.neuron.2008.10.013. - DOI - PubMed
    1. Allen NJ, and Eroglu C (2017). Cell Biology of Astrocyte-Synapse Interactions. Neuron 96, 697–708. 10.1016/j.neuron.2017.09.056. - DOI - PMC - PubMed
    1. Chung WS, Welsh CA, Barres BA, and Stevens B (2015). Do glia drive synaptic and cognitive impairment in disease? Nat. Neurosci. 18, 1539–1545. 10.1038/nn.4142. - DOI - PMC - PubMed
    1. Eroglu Ç, Allen NJ, Susman MW, O’Rourke NA, Park CY, Özkan E, Chakraborty C, Mulinyawe SB, Annis DS, Huberman AD, et al. (2009). Gabapentin Receptor α2δ−1 Is a Neuronal Thrombospondin Receptor Responsible for Excitatory CNS Synaptogenesis. Cell 139, 380–392. 10.1016/j.cell.2009.09.025. - DOI - PMC - PubMed

Publication types

MeSH terms

Substances