. 2024 Mar 5;121(10):e2319366121.
doi: 10.1073/pnas.2319366121. Epub 2024 Feb 29.

Aging and comprehensive molecular profiling in acute myeloid leukemia

Affiliations

Aging and comprehensive molecular profiling in acute myeloid leukemia

Jian-Feng Li et al. Proc Natl Acad Sci U S A. .

Abstract

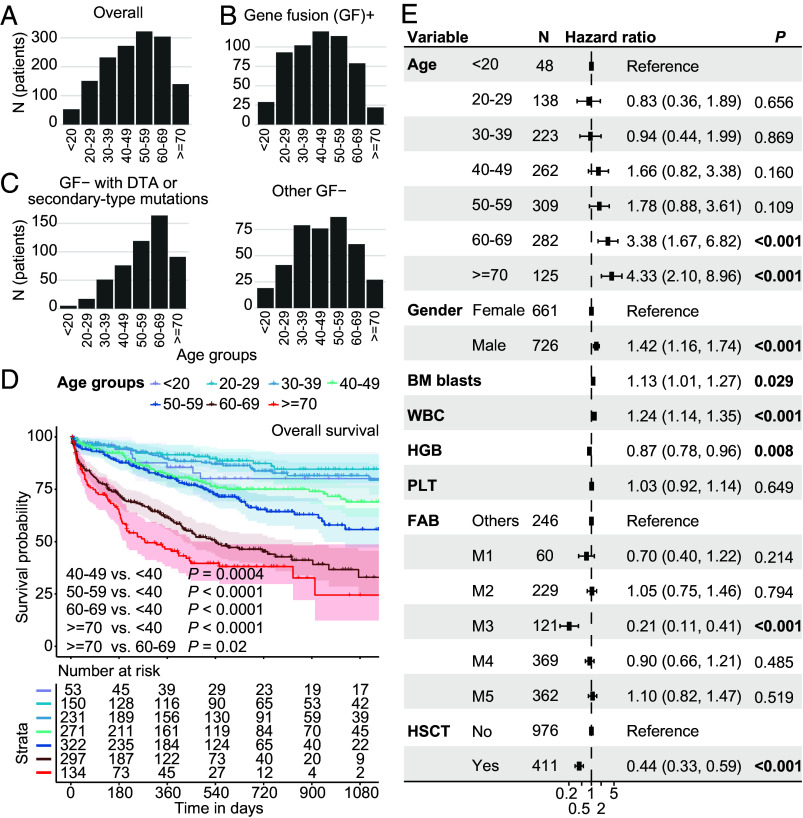
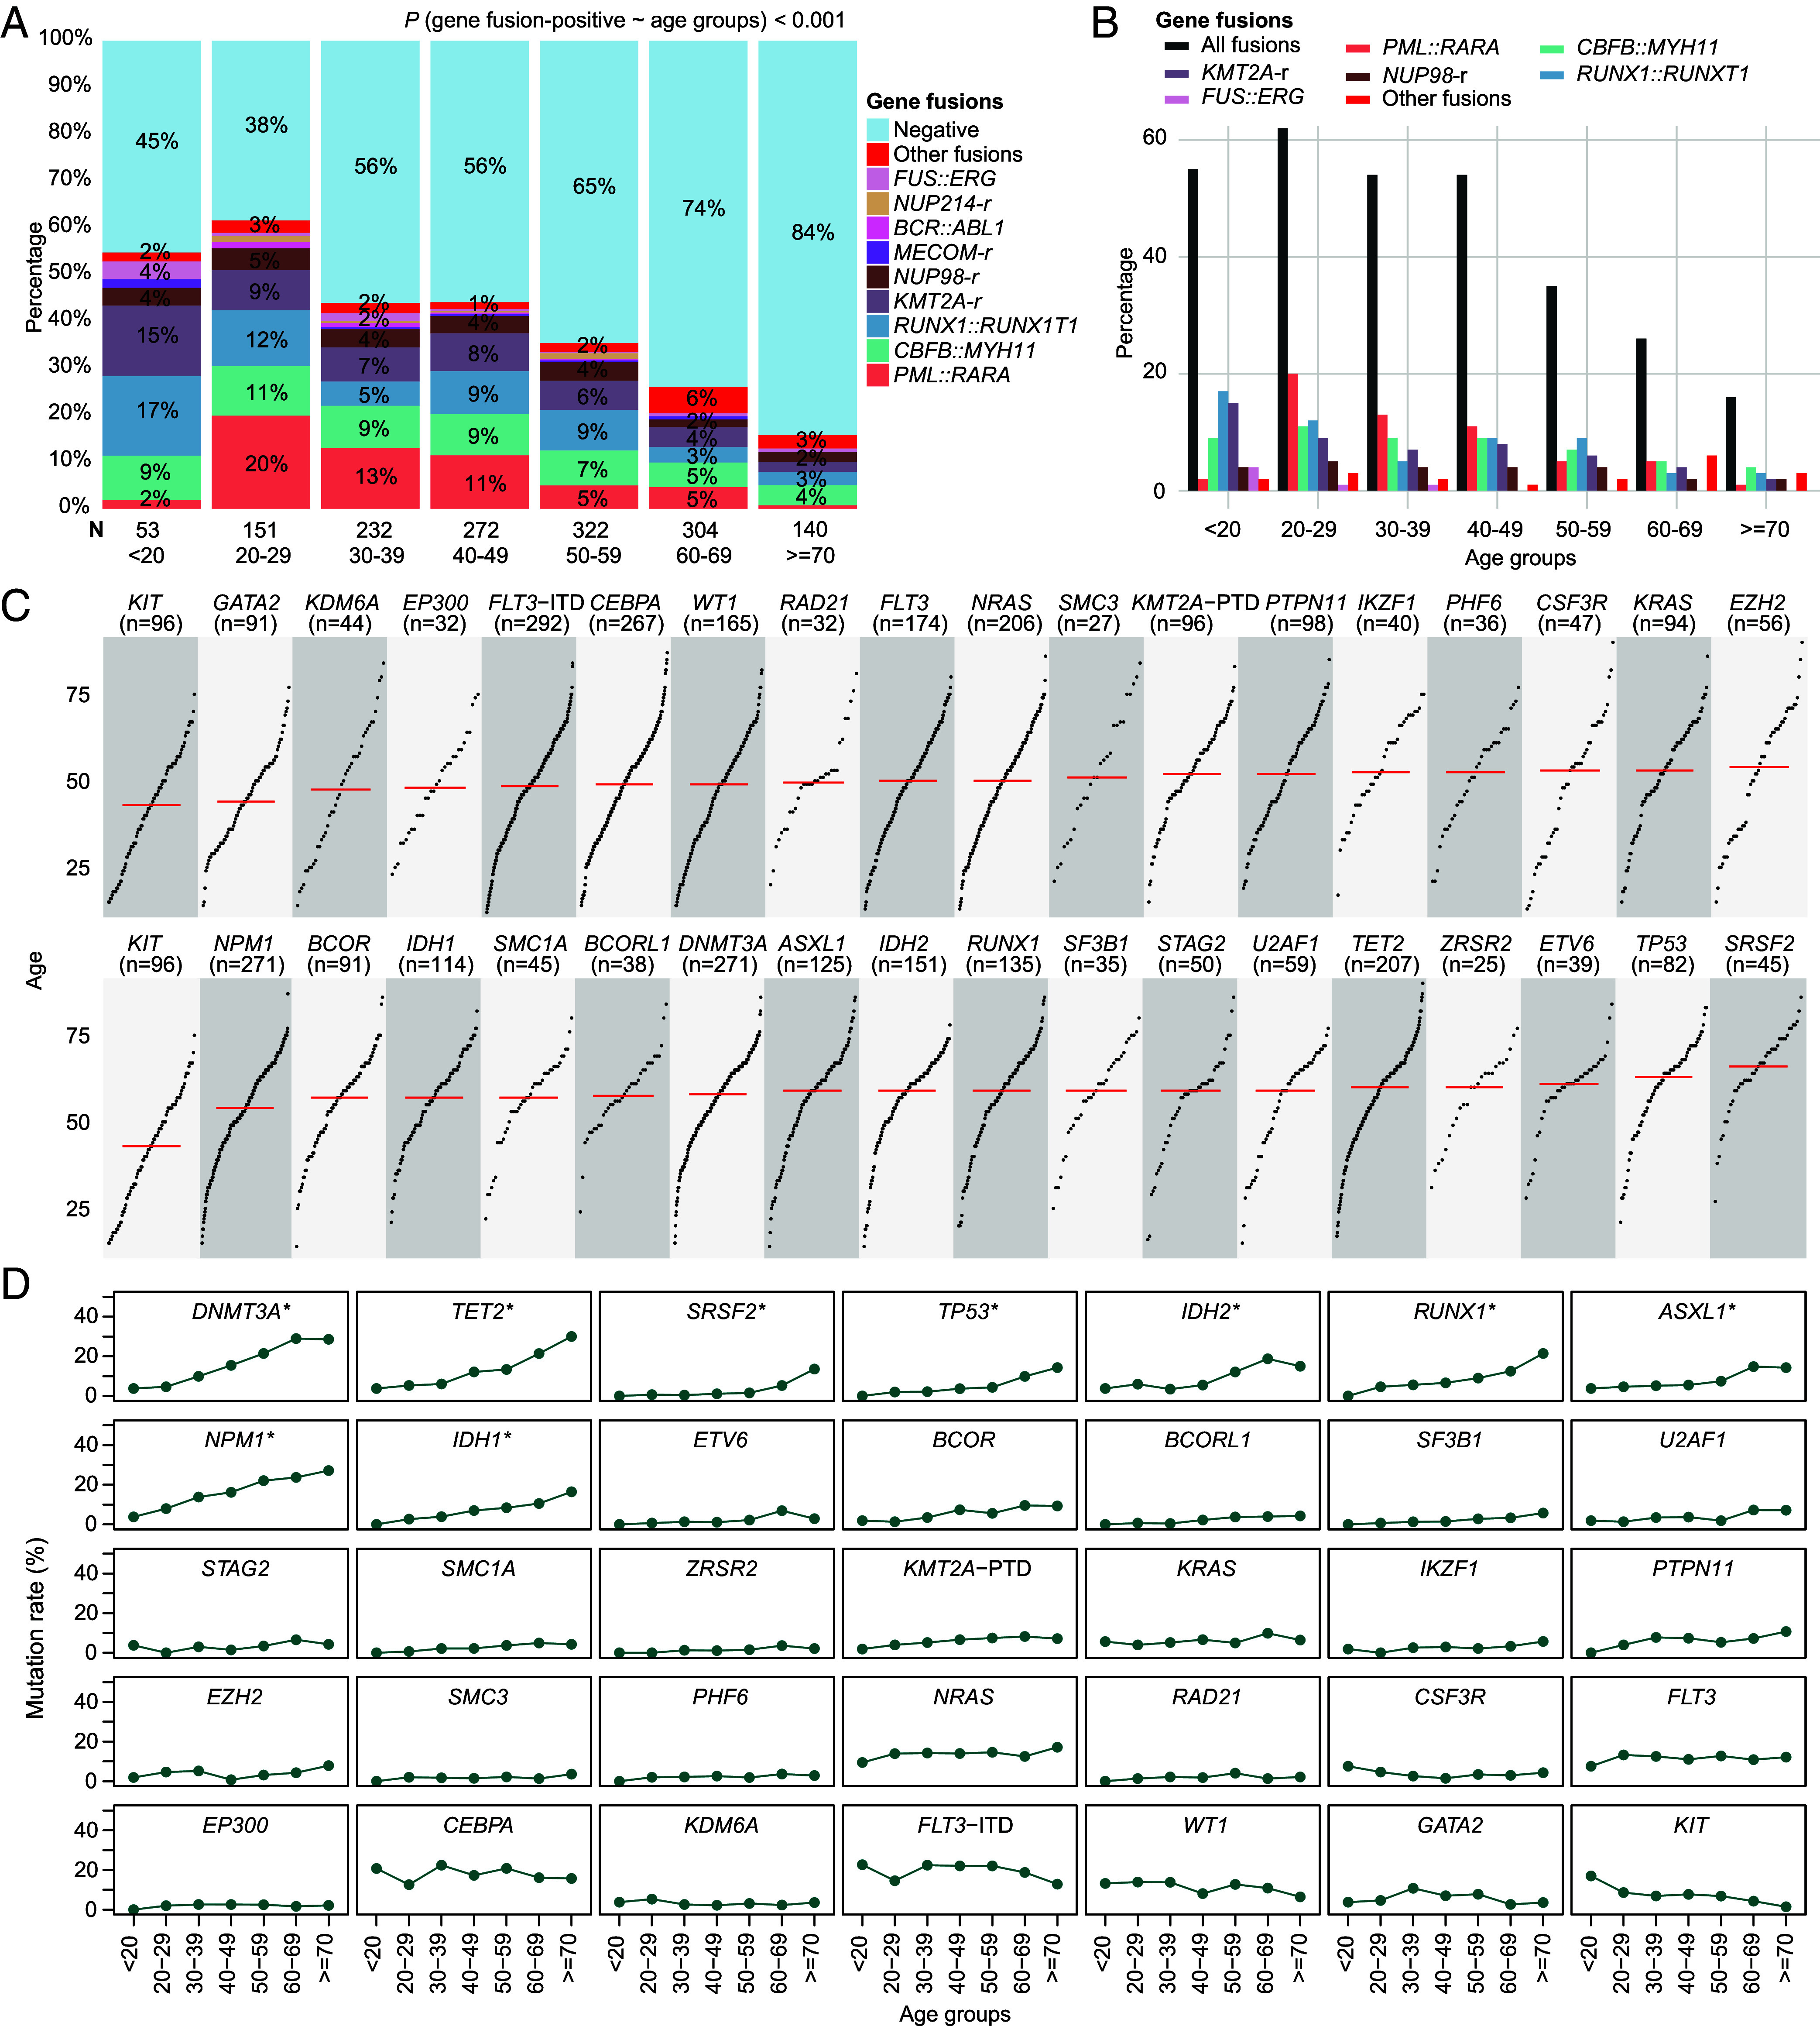
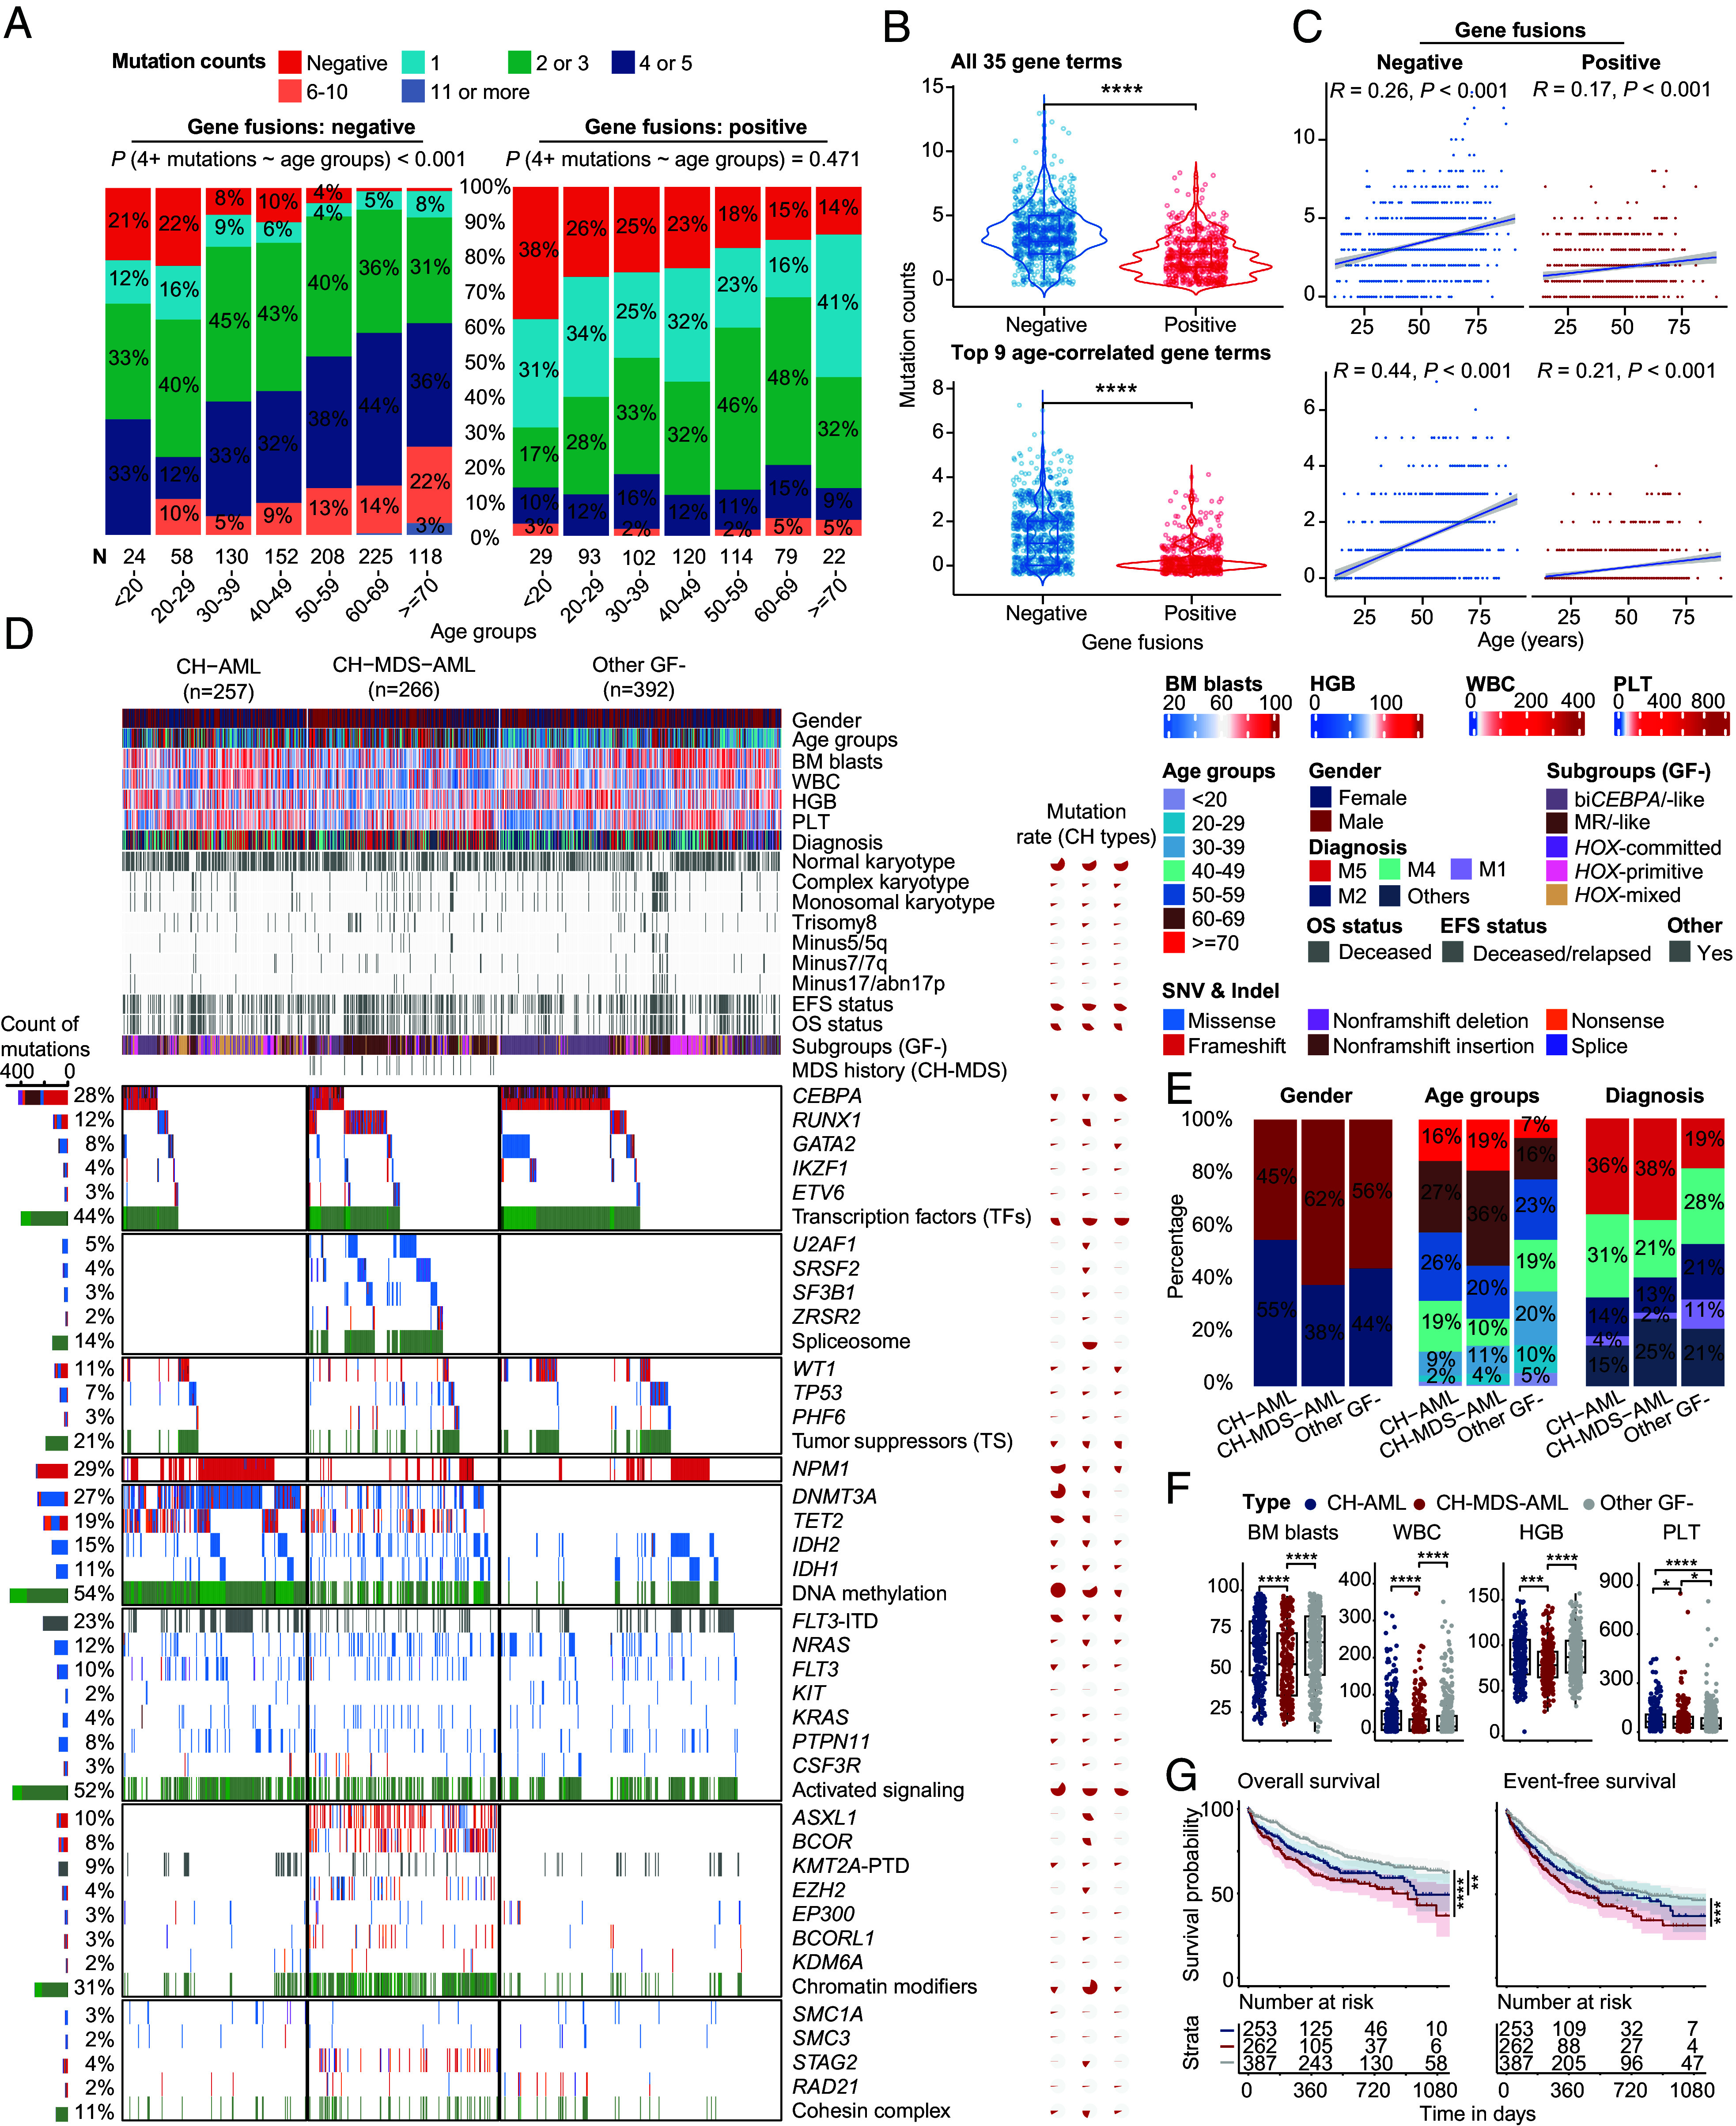
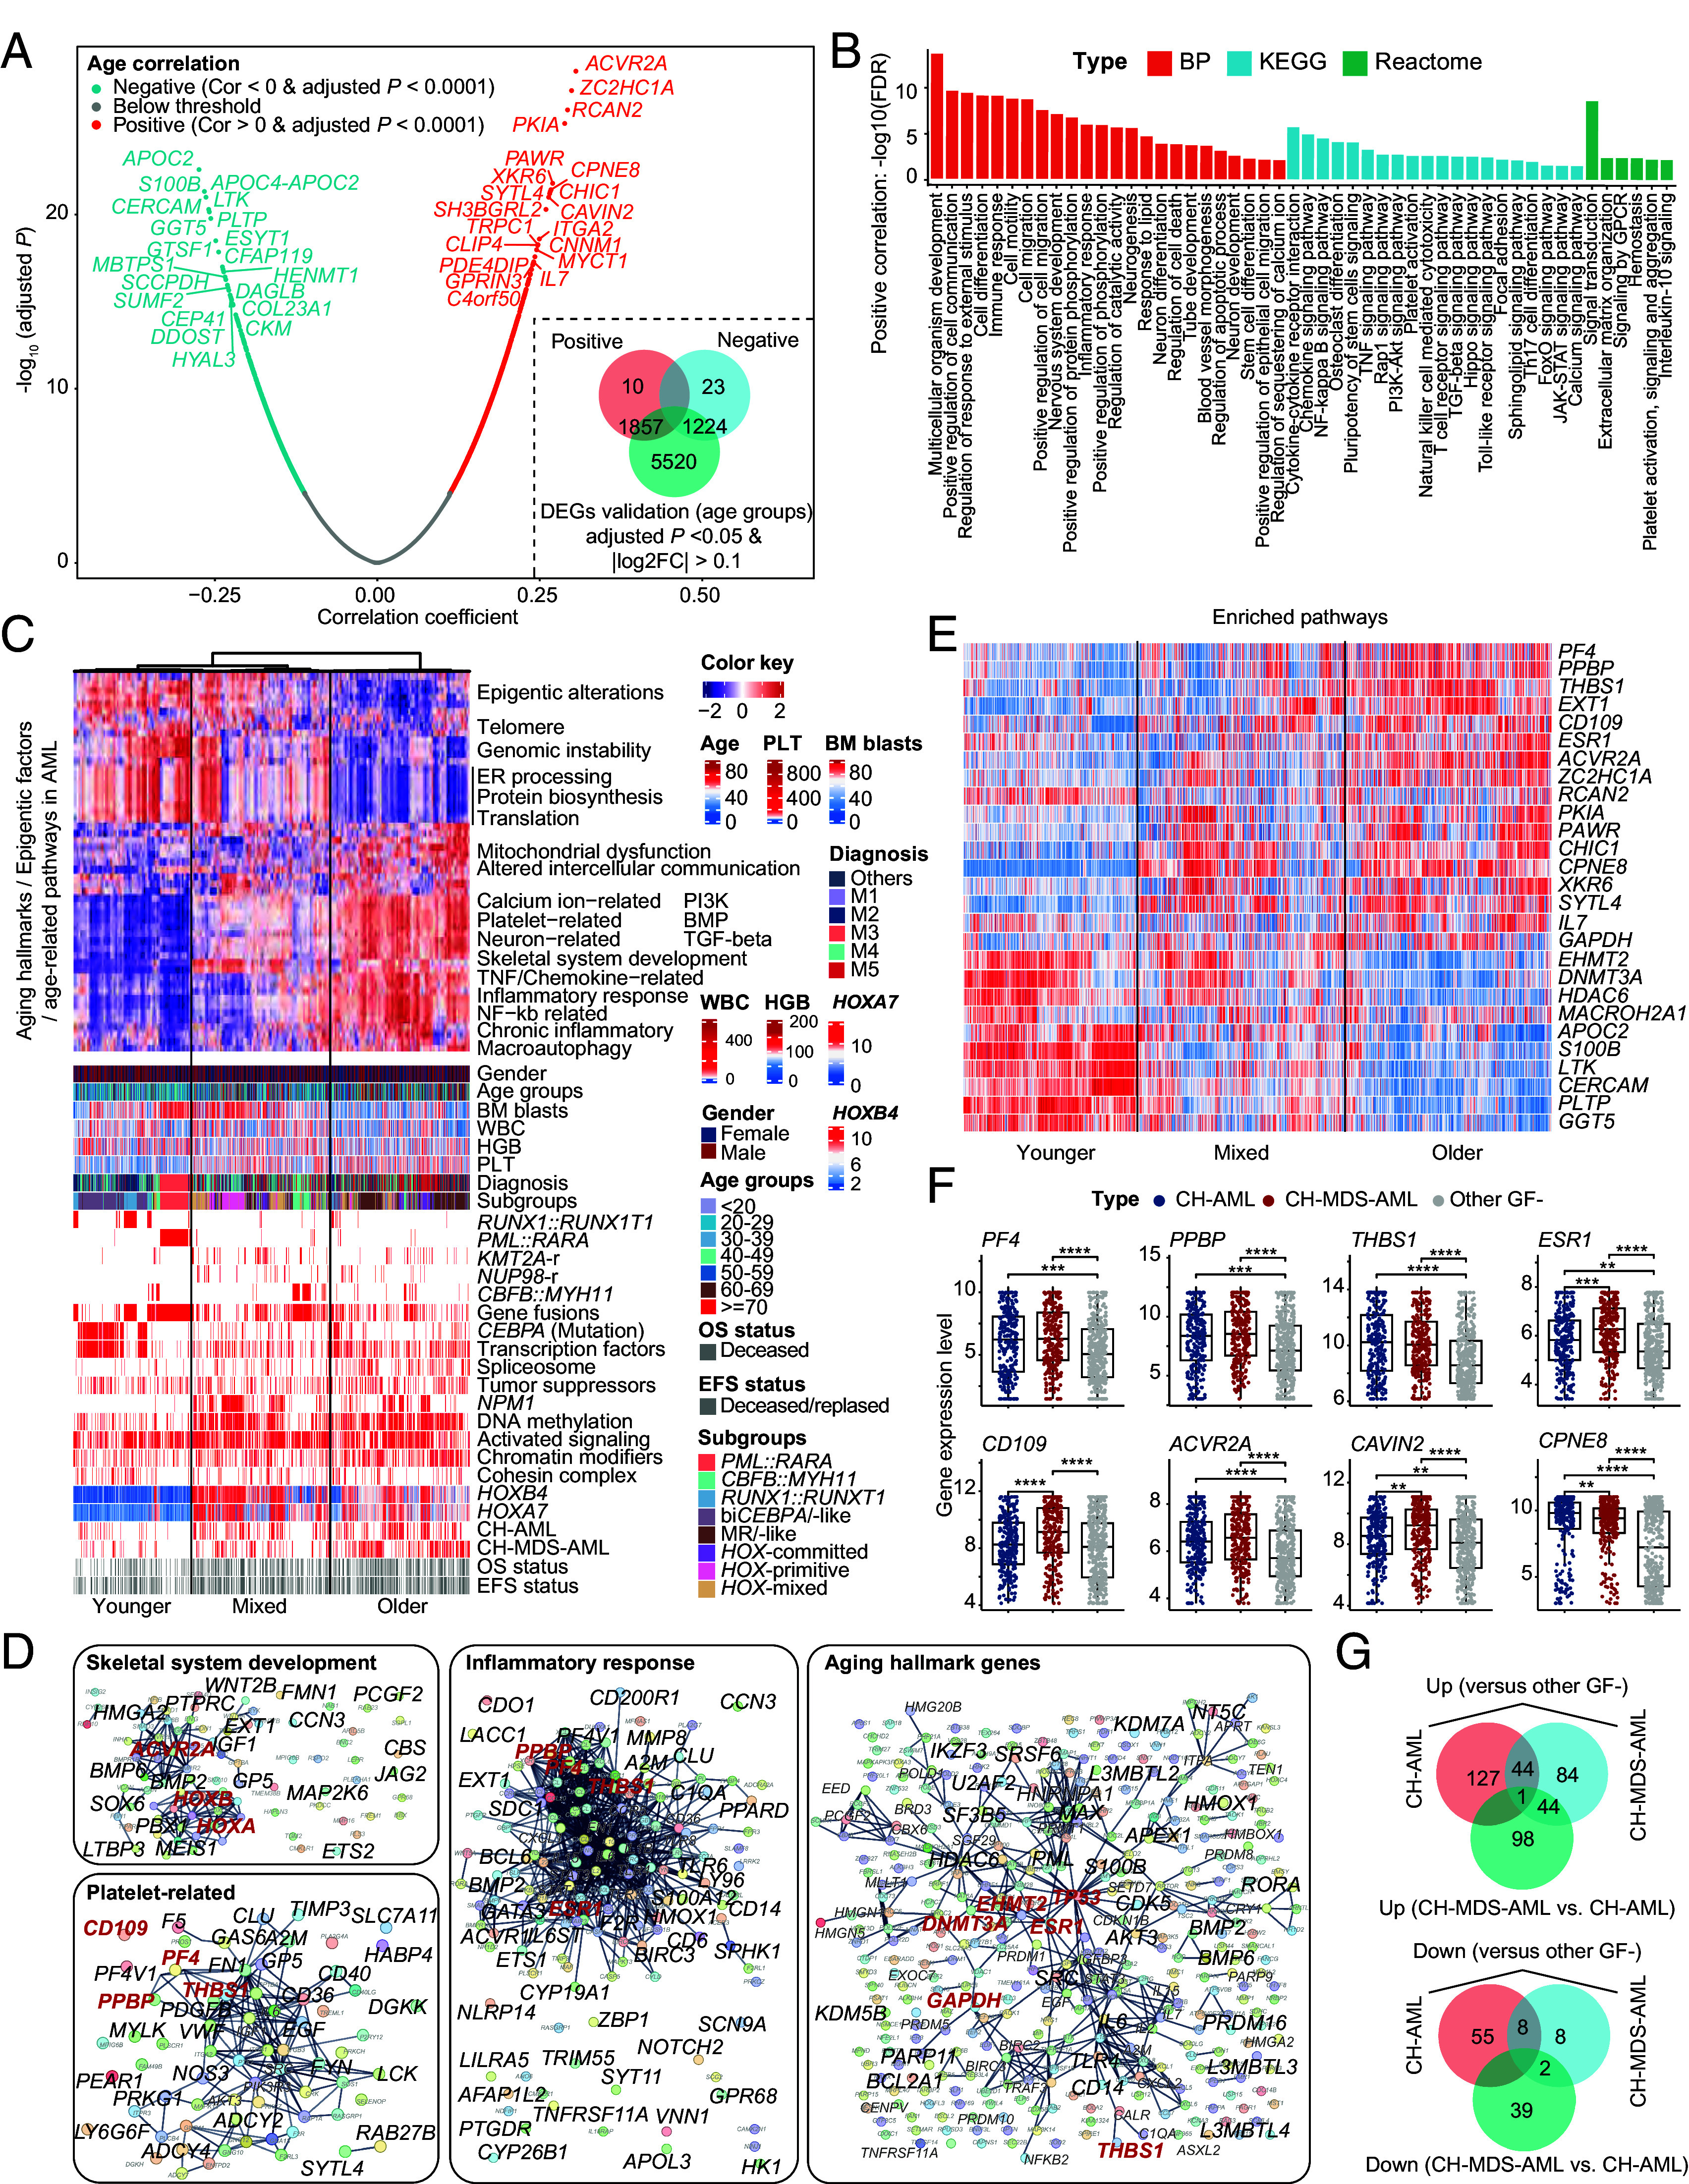
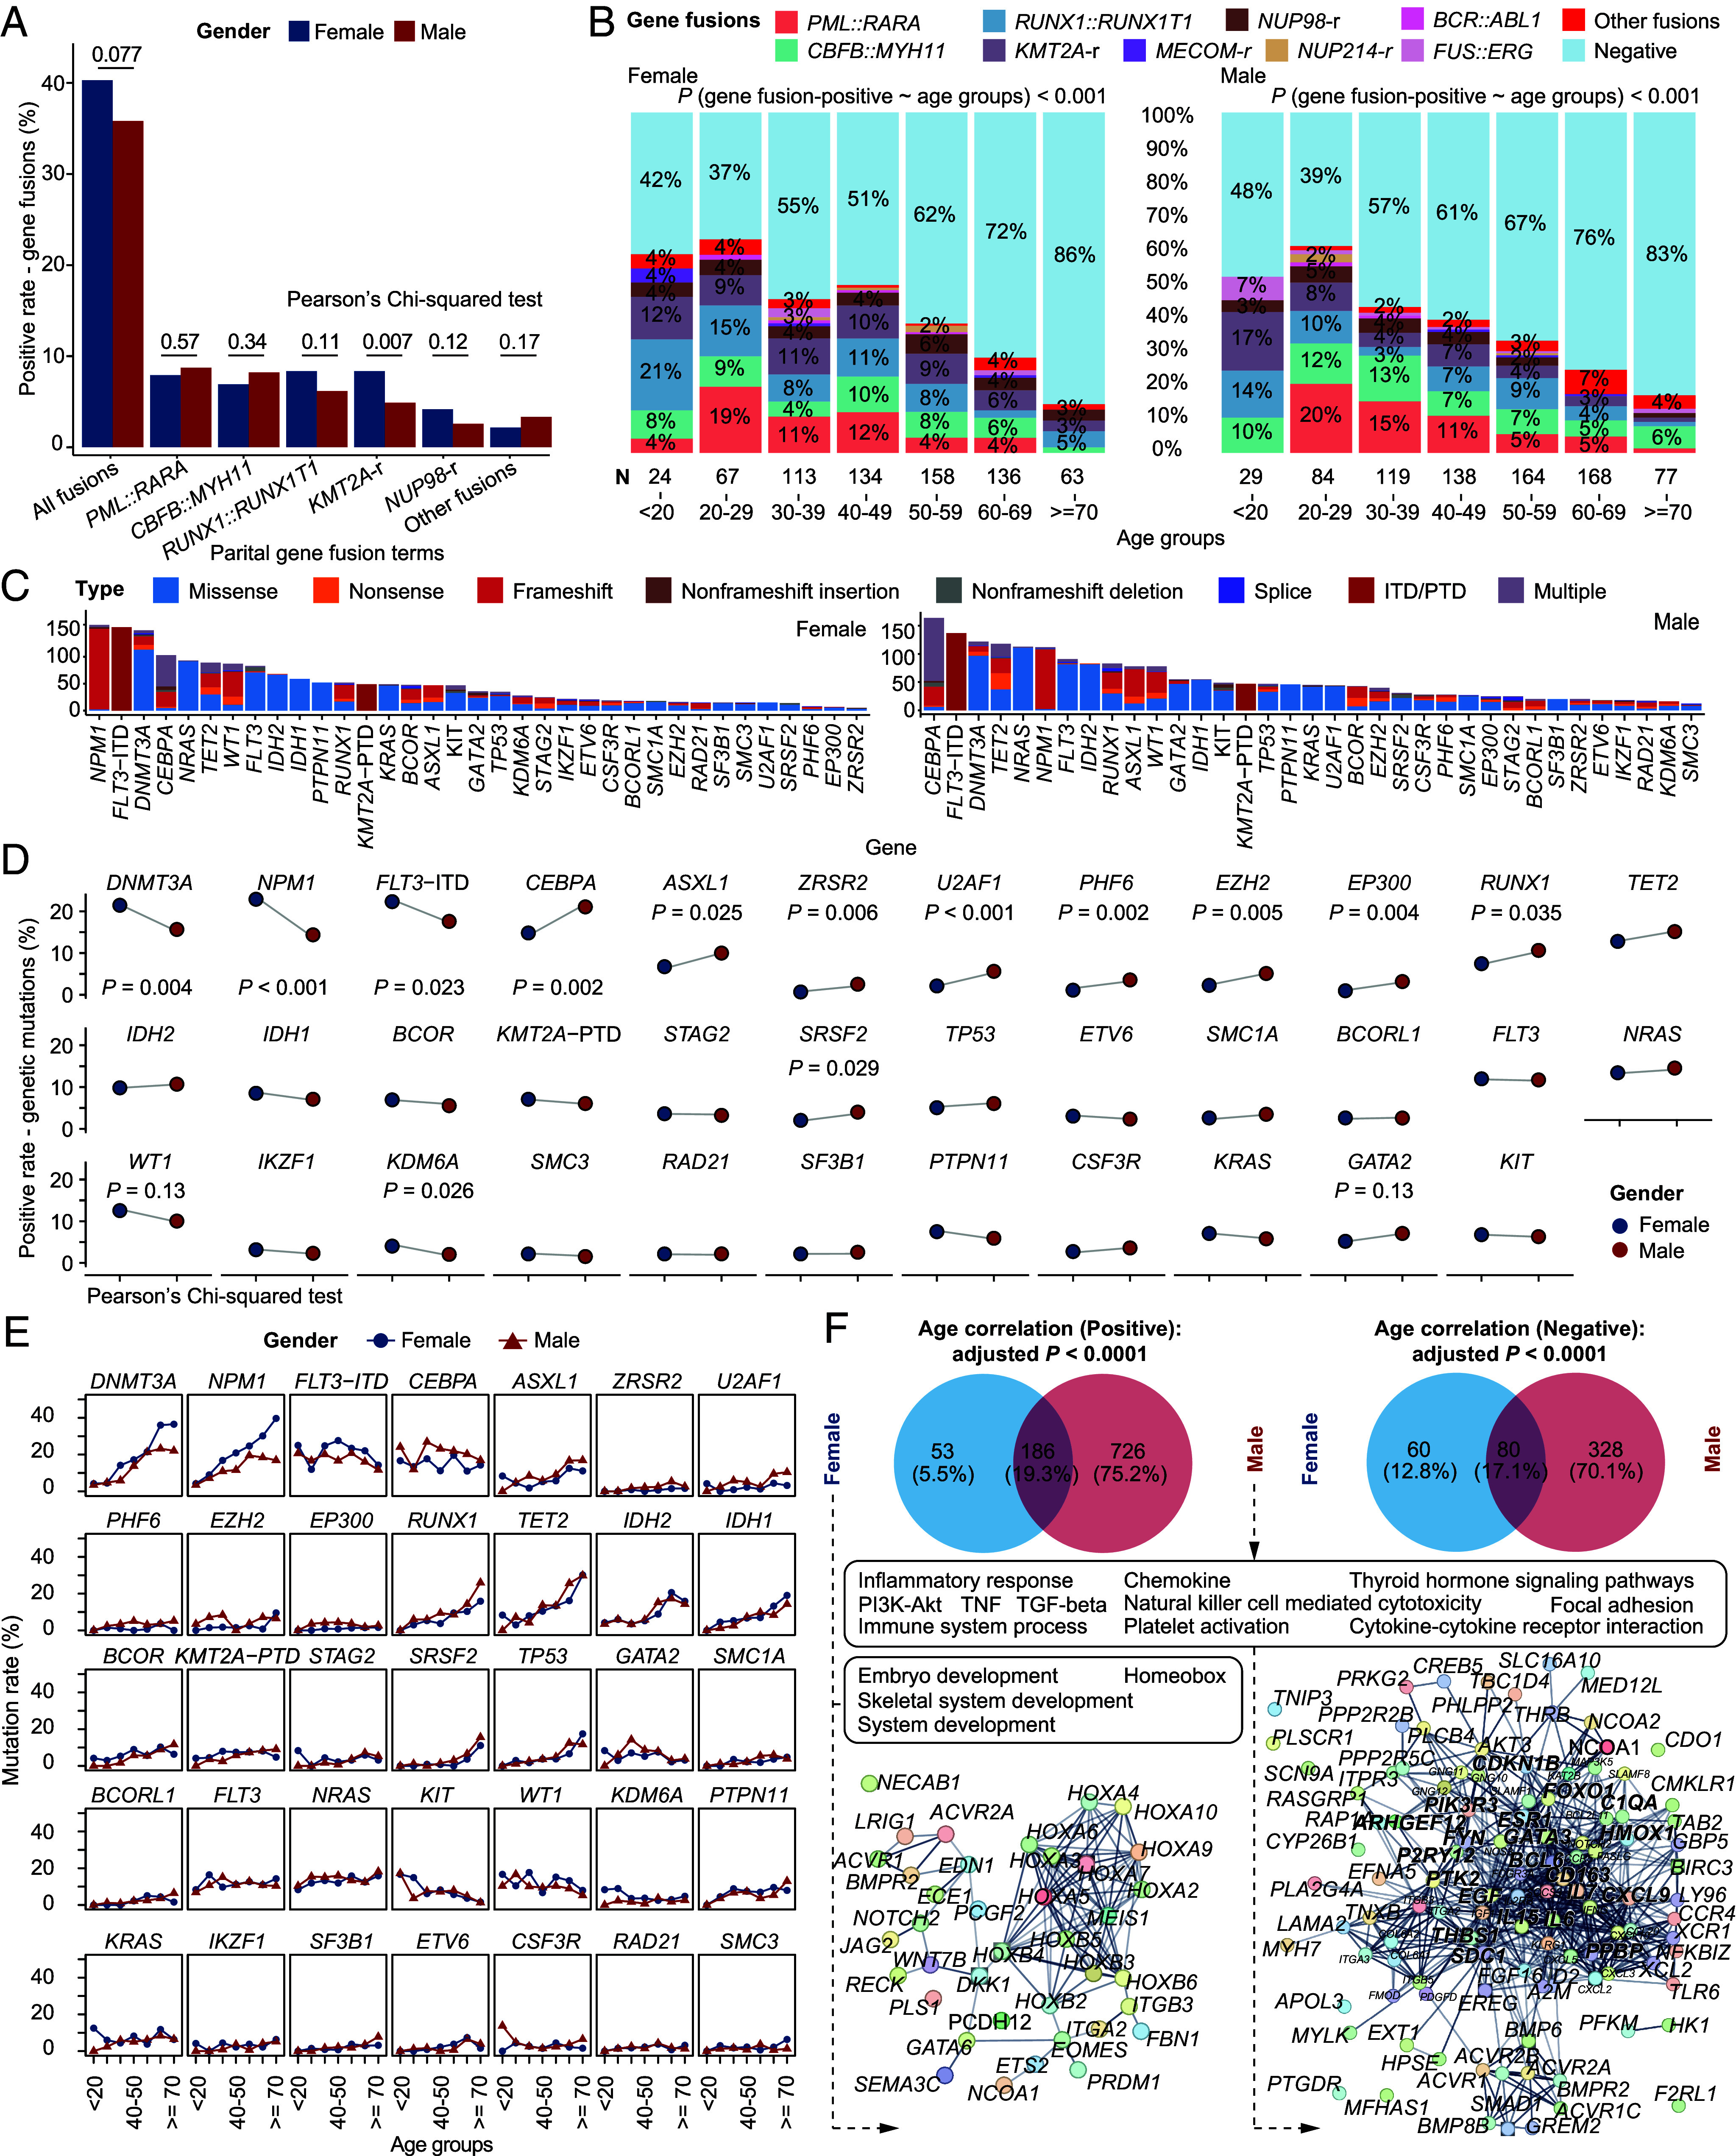
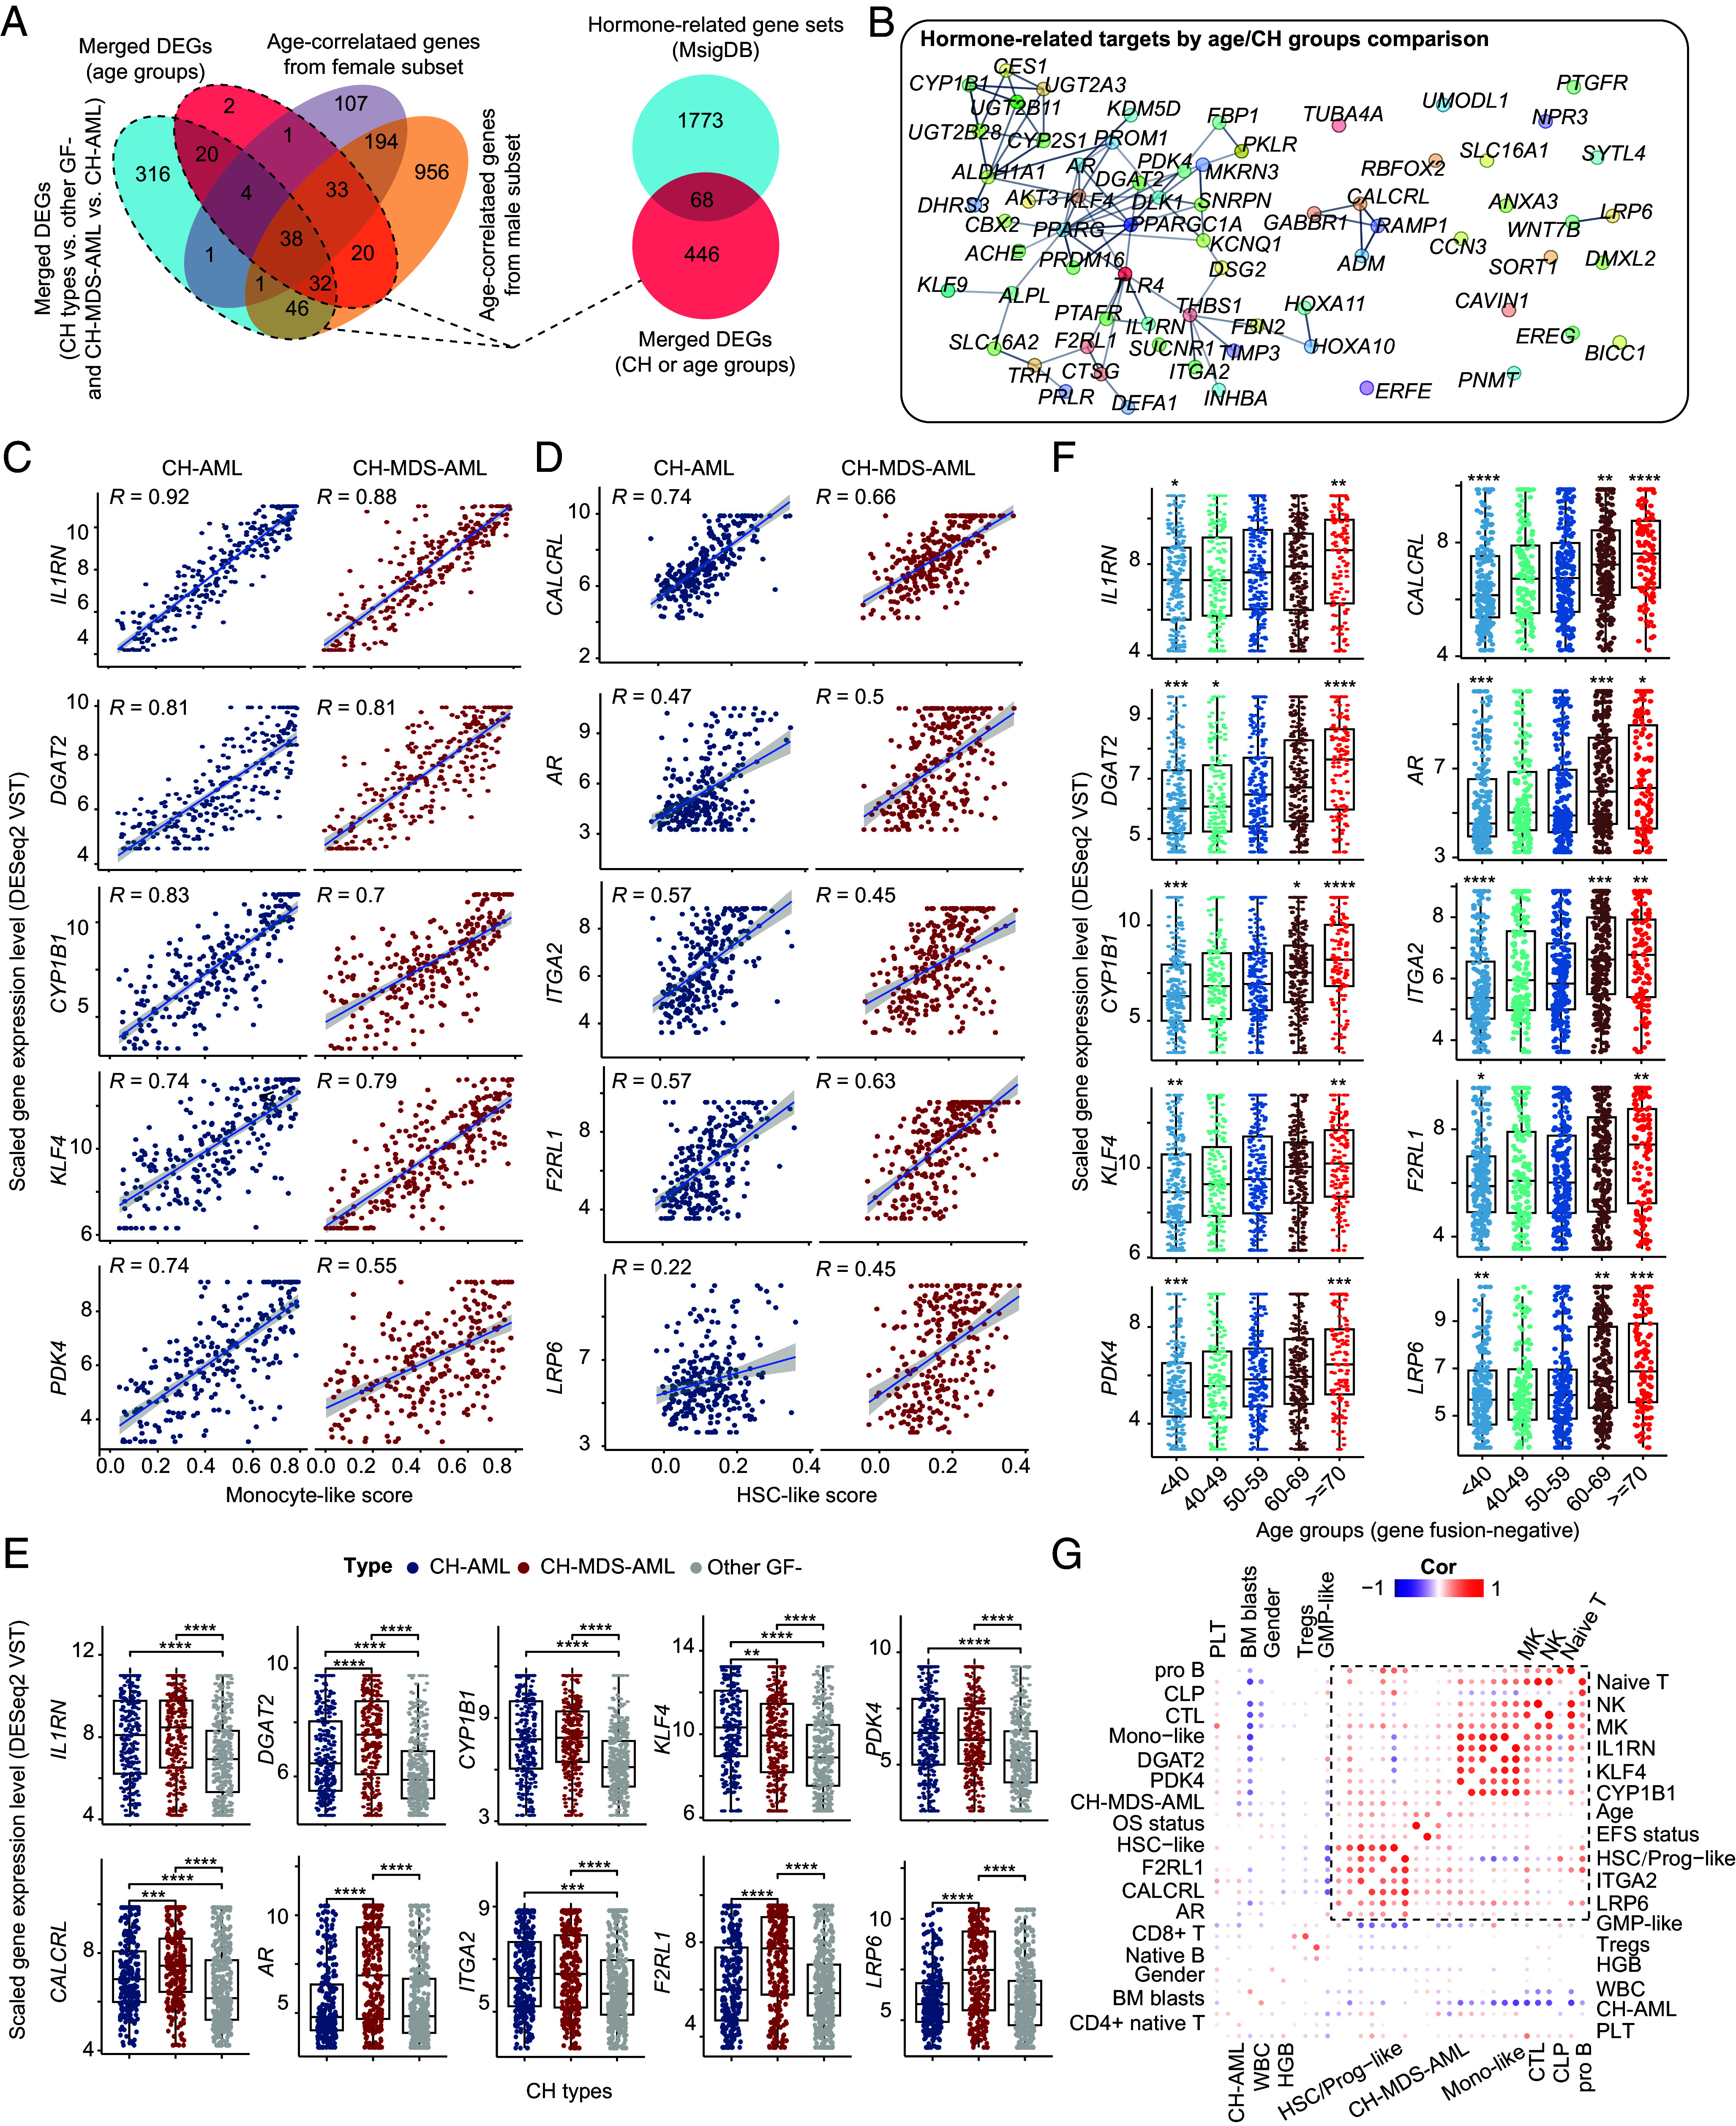
Acute myeloid leukemia (AML) is an aging-related and heterogeneous hematopoietic malignancy. In this study, a total of 1,474 newly diagnosed AML patients with RNA sequencing data were enrolled, and targeted or whole exome sequencing data were obtained in 94% cases. The correlation of aging-related factors including age and clonal hematopoiesis (CH), gender, and genomic/transcriptomic profiles (gene fusions, genetic mutations, and gene expression networks or pathways) was systematically analyzed. Overall, AML patients aged 60 y and older showed an apparently dismal prognosis. Alongside age, the frequency of gene fusions defined in the World Health Organization classification decreased, while the positive rate of gene mutations, especially CH-related ones, increased. Additionally, the number of genetic mutations was higher in gene fusion-negative (GF-) patients than those with GF. Based on the status of CH- and myelodysplastic syndromes (MDS)-related mutations, three mutant subgroups were identified among the GF- AML cohort, namely, CH-AML, CH-MDS-AML, and other GF- AML. Notably, CH-MDS-AML demonstrated a predominance of elderly and male cases, cytopenia, and significantly adverse clinical outcomes. Besides, gene expression networks including HOXA/B, platelet factors, and inflammatory responses were most striking features associated with aging and poor prognosis in AML. Our work has thus unraveled the intricate regulatory circuitry of interactions among different age, gender, and molecular groups of AML.

Keywords: RNA-seq; acute myeloid leukemia; aging; clonal hematopoiesis; molecular alterations.


Conflict of interest statement

Competing interests statement:The authors declare no competing interest.

Figures

Fig. 1.
Fig. 1.
Distribution and prognostic stratification of age groups in AML. Histograms show all 1,474 AML patients (A), gene fusion–positive patients (B), and gene fusion–negative patients (C) from three centers. Common CH genetic mutations including DNMT3A, TET2, ASXL1, and secondary-type mutations suggestive of MDS transformation (BCOR, EZH2, STAG2, SF3B1, SRSF2, U2AF1, and ZRSR2) and other gene fusion–negative patients are shown in Left and Right panels (C), respectively. (D) Three-year OS analysis (KM curve) of AML patients from three centers based on age groups. The log-rank test is used to compare outcomes between age groups. (E) Multivariate analysis (Cox proportional hazard model) of basic clinical data including age groups, gender, BM blasts (%), WBC (×109/L), HGB (g/L), PLT (×109/L), FAB subtypes, and HSCT identified >60 y as having independent prognostic significance. The BM blasts, WBC, HGB, and PLT parameters are scaled using R function “scale.” BM, bone marrow. WBC, white cell count. HGB, hemoglobin. PLT, platelet. HSCT, hematopoietic stem cell transplantation.
Fig. 2.
Fig. 2.
Incidence trend of gene fusions and common genetic mutations with age in AML. (A) and (B) show the positive rate of high-frequency and rare gene fusion events in different age groups. Most common gene fusions showed a negative correlation with age, PML::RARA, CBFB::MYH11, and RUNX1::RUNX1T1 in particular. Logistic regression indicates the decreased trend of gene fusions with age. (C) Scatter plots show the median age distribution (red line) of the 35 common gene mutation terms including FLT3-ITD and KMT2A-PTD. Each point represents a patient. The points are sorted by patient age from Left-Bottom to Right-Top. (D) Scatter plots show the mutation rates of common mutant events in different age groups. Top 9 genes with age-related mutations are marked with asterisks.
Fig. 3.
Fig. 3.
Genomic landscape of gene fusion–negative patients with AML. (AC) compare the number of mutations between gene fusion–positive and gene fusion–negative patients with AML. (A) Percentage bar graphs show the classes of mutation numbers in gene fusion–negative (Left)/-positive (Right) groups. Gene fusion–negative patients have a higher rate of four or more mutations. (B) Violin plots show the difference in mutation numbers between gene fusion–negative/-positive groups. (C) Scatter plot of mutation number and age. Spearman correlations are shown in the Top. Regression line and the CI are shown. The Top and Bottom panels show all 35 gene mutation items and top 9 genes with age-related mutations, respectively. (D) Genomic landscape including clinical features, gene fusions, and genetic mutations of representative CH-related patients. CH-AML contains DNMT3A or TET2 genetic mutations, while the secondary mutations are negative. In contrast, patients in the CH-MDS-AML group contain at least one of the secondary-type mutations. Multicolored bars map the different types of gene mutations, representing the number of gene mutations. The percentage on the Left indicates the mutation rates of genes in all patients, while the pie chart on the Right shows the mutation rates of CH-AML, CH-MDS-AML and other GF- groups. (E) The bar plot shows the percentage difference of gender, age groups, diagnosis. (F) Boxplots show the difference of BM blasts, WBC, HGB, and PLT. (G) OS and EFS of CH-AML and CH-MDS-AML groups. Statistical significances of (B) and (F) were inferenced by the Wilcoxon signed-rank test. CH, clonal hematopoiesis. MDS, myelodysplastic syndromes. GF, gene fusion. BM, bone marrow. WBC, white cell count. HGB, hemoglobin. PLT, platelet. *P < 0.05; **P < 0.01; ***P < 0.001; ****P < 0.0001.
Fig. 4.
Fig. 4.
Transcriptomic screening of age-related genes and pathways in AML. (A) Volcano plots show the positive and negative correlation of gene expression patterns with age. The Pearson correlation coefficients with adjusted P < 0.0001 are colored red (>0) and cyan (<0) colors, respectively. The merged DEGs of age groups are calculated by comparing all possible combinations of age groups, such as >70 vs. 60 to 69 and 60 to 69 vs. 50 to 59. The <40 age groups are pooled in the DEGs analysis of age groups. (B) Functional enrichment analysis [GO BP (19), KEGG (21), and Reactome (22)] of positive-correlation gene expression patterns having positive correlation with age, performed on the STRING website (20). Only gene terms with false discovery rate (FDR)<0.05 are retained. (C) The integrative heatmap shows the age-related molecular and clinical features, including top heatmap (single-sample gene set enrichment scores of aging hallmarks, epigenetic gene sets, and enriched pathways based on positive and negative gene expression patterns with age in AML), gender, age, genetic mutations, gene fusions, CH-groups, gene expression subgroups, and survival data. Samples are sorted via the hierarchical clustering of pathways enrichment scores. At least three aging statuses can be found in AML patients, which show distinct patterns of aging hallmarks, epigenetic classes, and enriched pathways of age-related genes. Protein biosynthesis, DNA repair, and epigenetic factors (protein, reader, eraser, and bind eraser) show higher enrichment in younger patients, including PML::RARA, RUNX1::RUNX1T1, and CEBPA mutations with low HOXA/B gene expression. Epigenetic writer/binder writer, inflammation response, platelet- and neuron−related gene sets enriched in CH-related AML with higher stemness. CBFB::MYH11 and one branch of NPM-mutant patients show lower enrichment of inflammation response. (D) Selected gene networks show the known interactions of genes/proteins with age-related expression patterns. Each node represents one gene/protein. Some of key genes are labeled in red colors according to recurrence or priori knowledge, including the aberrant expression of PF4, THBS1, and PPBP as age- and prognosis-correlated genes in AML (, –25). The CD109 can predict poor prognosis in the MR/-like subgroup. (E) Heatmap of partially representative age-related gene expression markers. (F) Boxplots show the normalized gene expression levels of a representative set of genes with age-correlated expression profiles. (G) Venn plots show the intersection of age-related gene expression markers between CH-AML and CH-MDS-AML groups. Statistical significances of (F) are inferenced by the Wilcoxon signed-rank test. GO, gene ontology. BP, biological process. KEGG, Kyoto Encyclopedia of Genes and Genomes. CH, clonal hematopoiesis. MDS, myelodysplastic syndromes. MR, myelodysplasia-related/-like. DEGs, differentially expressed genes. *P < 0.05; **P < 0.01; ***P < 0.001; ****P < 0.0001.
Fig. 5.
Fig. 5.
Gender differences in gene fusions, genetic mutations, and age-related gene expression markers in AML. (A) The bar chart shows the frequency of gene fusions between female (blue) and male (red). Females tend to have more gene fusions, mainly KMT2A and NUP98 gene fusions. (B) Positive rate of different classes of gene fusions in different age groups. High-frequency gene fusions decrease with age in both females and males, while rare gene fusions show higher incidence in older male AML patients. Logistic regressions indicate the decrease trend of gene fusions with age in male and female. (CE) show the difference in the occurrence of gene mutations. (C) The bar chart shows the number of patients with common genetic mutations in female (Left) and male (Right). (D) Dot plots show the changes in proportions between females (blue dot) and males (red dot). (E) Dot plots show the sex difference of genetic mutations in different age groups. (F) Pathway enrichment analysis of genes with age-related expression profiles (adjusted P < 0.0001) in female and male highlighting the gender-related HOXA/B and inflammatory response pathways. Statistical significance of (A) and (D) is inferenced by the Pearson’s Chi-squared test.
Fig. 6.
Fig. 6.
Correlation analysis of age-/gonadal-related gene expression patterns and immune signatures in CH groups. (A) The Venn plot displays the merged DEGs (|log2 (fold change)| > 1 and adjusted P < 0.05) of age/CH groups (Left). About 87% of merged DEGs in age groups can be found in the age-correlated gene sets (adjusted P < 0.0001) from female and male subset of AML patients. Intersections between hormone gene sets and merged DEGs of CH types and age groups (Right). (B) Network visualization of 68 genes using the intersection set. Scatter plots of the top 10 genes correlating with the tumor-derived monocyte-like (C) and HSC-like signatures (D). The expression levels (DESeq2 VST normalization) of IL1RN, CYP1B1, and DGAT2 are highly correlated with the monocyte-like score, while that of the CALCRL is most highly correlated with the HSC-like score. Boxplots of (E) and (F) represent the gene expression difference of screened age-/hormone-related gene sets between CH types and different age groups. Note that the age groups (<40) are combined in this comparison (F). Statistical significances of (E) and (F) are inferenced by the Wilcoxon signed-rank test. (G) Correlation heatmap of defined age-related targets and immune cells. Statistically insignificant pairs are filled with blank color. Both single-sample gene enrichment analysis and CIBERSORTx deconvolution of immune cells are used. HSC, hematopoietic stem cell. DEGs, differentially expressed genes. VST, variance-stabilizing transformation. *P < 0.05; **P < 0.01; ***P < 0.001; ****P < 0.0001.

Similar articles

Cited by

References

    1. Tyner J. W., et al. , Functional genomic landscape of acute myeloid leukaemia. Nature 562, 526–531 (2018). - PMC - PubMed
    1. Dufva O., et al. , Immunogenomic landscape of hematological malignancies. Cancer Cell 38, 380–399.e13 (2020). - PubMed
    1. Miranda-Filho A., et al. , Epidemiological patterns of leukaemia in 184 countries: A population-based study. Lancet Haematol. 5, e14–e24 (2018). - PubMed
    1. DiNardo C. D., Erba H. P., Freeman S. D., Wei A. H., Acute myeloid leukaemia. Lancet 401, 2073–2086 (2023). - PubMed
    1. Newell L. F., Cook R. J., Advances in acute myeloid leukemia. BMJ 375, n2026 (2021). - PubMed