. 2024 Mar;383(6686):967-970.
doi: 10.1126/science.adk3863. Epub 2024 Feb 29.

Retrograde endocannabinoid signaling at inhibitory synapses in vivo

Affiliations

Retrograde endocannabinoid signaling at inhibitory synapses in vivo

Barna Dudok et al. Science. 2024 Mar.

Abstract

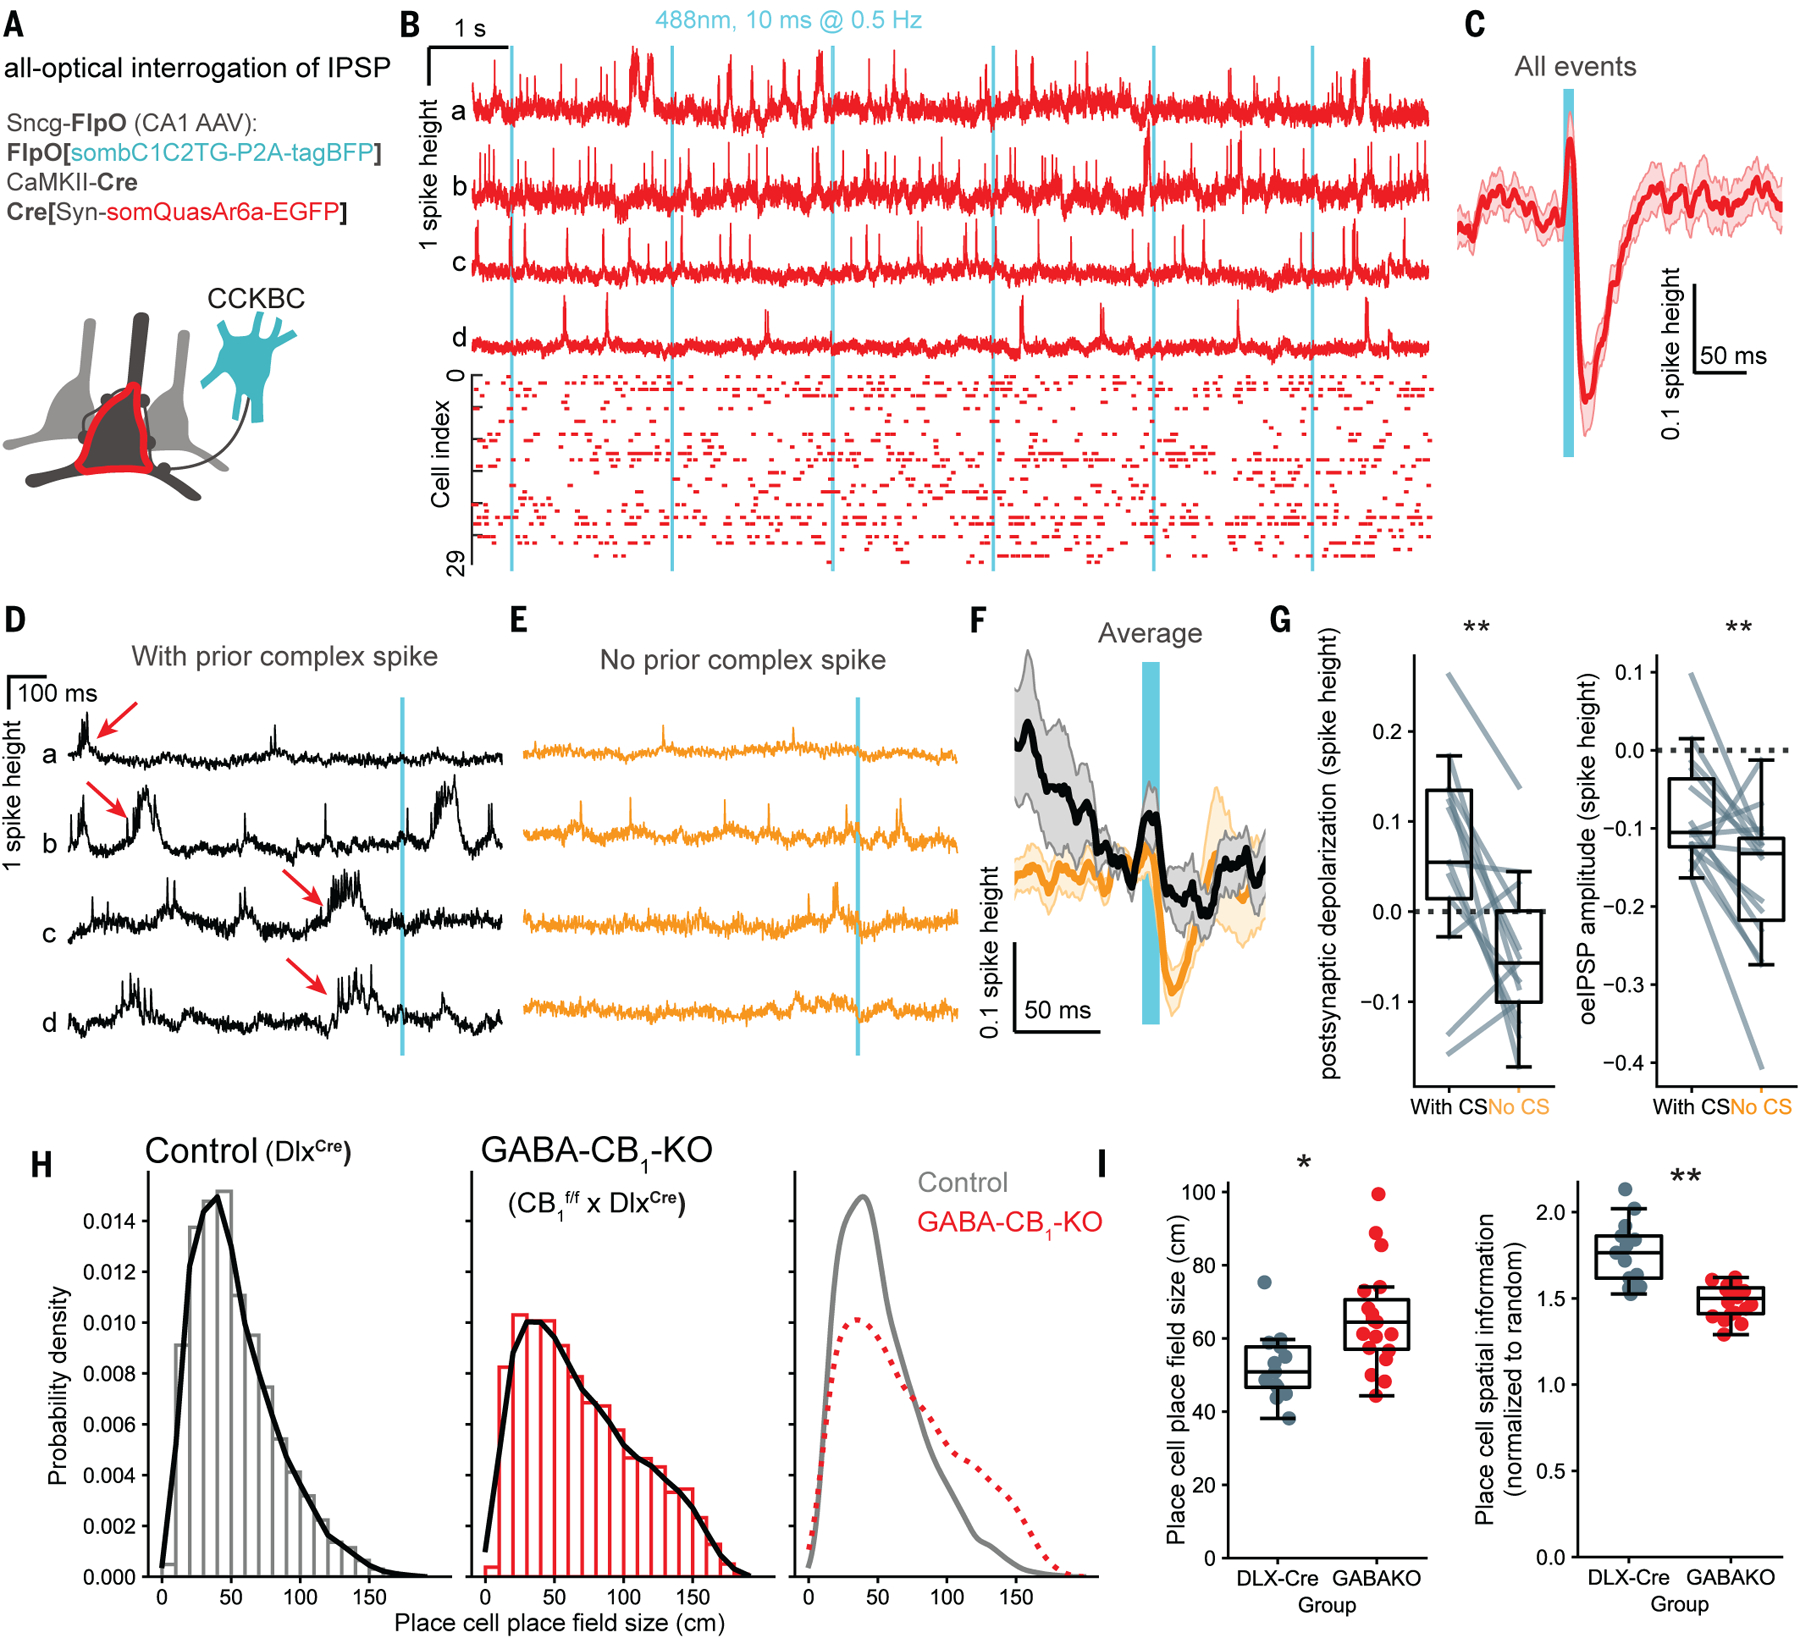
Endocannabinoid (eCB)-mediated suppression of inhibitory synapses has been hypothesized, but this has not yet been demonstrated to occur in vivo because of the difficulty in tracking eCB dynamics and synaptic plasticity during behavior. In mice navigating a linear track, we observed location-specific eCB signaling in hippocampal CA1 place cells, and this was detected both in the postsynaptic membrane and the presynaptic inhibitory axons. All-optical in vivo investigation of synaptic responses revealed that postsynaptic depolarization was followed by a suppression of inhibitory synaptic potentials. Furthermore, interneuron-specific cannabinoid receptor deletion altered place cell tuning. Therefore, rapid, postsynaptic, activity-dependent eCB signaling modulates inhibitory synapses on a timescale of seconds during behavior.


Conflict of interest statement

Competing interests: IS declares unrelated consultant activity for Actio Biosciences, CODA Biotherapeutics, MapLight Therapeutics, Praxis Precision Medicines, and Ray Therapeutics. KD declares unrelated consultant activity for MapLight Therapeutics and Stellaromics.

Figures

Fig. 1.
Fig. 1.. Rapid endocannabinoid signaling in the hippocampus in vivo.
(A) GRABeCB2.0 and jRGECO1a were expressed in CA1 neurons. Head-fixed mice ran on a linear treadmill during multiphoton imaging. (B) Event-aligned average single-cell calcium and eCB responses during calcium transients. Plot shows mean responses (line) ± SEM (shaded area), n = 4 sessions from 4 vehicle-treated mice, 607 ± 241 ROIs per session, 5.2 ± 1.1 peaks per ROI. Labels show decay time constants of exponential fits. (C) Analysis of place cells. Average tuning curves (solid black line) were calculated for each session by aligning location-averaged place cell traces on their preferred location. (D) Average spatial tuning curves (±SEM) are shown centered on the preferred location of place cells (red: calcium) together with the tuning curves of eCB signals from the same cells (blue) or after shuffling cells within sessions (grey). One-sided, one-sample t-test with alternative hypothesis μ > 0: p = 5.67e-5, n = 4 male mice; shuffle: p = 0.88. Plots show average tuning curves (line) ± SEM (shaded area), n = 4 sessions from 4 drug-naïve mice, 161 ± 35 place cell ROIs per session.
Fig. 2.
Fig. 2.. Spatially tuned presynaptic endocannabinoid signals in the hippocampus in vivo.
(A) Labeling strategy for in vivo imaging. Interneuronal GRABeCB2.0 and pan-neuronal jRGECO1a expression were combined. Bottom panels: segmentation approach. Neuron cell bodies were segmented in the jRGECO1a channel (postCa). The ROIs were enlarged by binary dilation for measuring signals in the neighboring axons in the GRABeCB2.0 channel (preeCB). (B) Average spatial tuning curves (±SEM) are shown centered on the preferred location of place cells (red: calcium) together with the tuning curves of eCB signals from the corresponding preECB ROIs (blue) or after shuffling ROIs within sessions (grey), n = 18 sessions from 5 mice, 193 ± 130 ROIs per session. (C) Quantification of signal intensity at the preferred location. Boxes: median ± interquartile range; whiskers: non-outlier range; markers: recording sessions. preeCB: p = 0.003, n = 5 mice, 3 males and 2 females; shuffle: p = 0.84. (D) Spatial tuning curves are shown after injecting mice with JZL-184 to inhibit the enzymatic breakdown of the eCB 2-AG by monoacylglycerol-lipase (MGL), or after vehicle injection. (E) Quantification of location-specific preECB signals, p = 0.022, Mann-Whitney test, n = 11 Vehicle sessions from 5 mice and 3 JZL sessions from 3 mice.
Fig. 3.
Fig. 3.. Inhibitory synaptic plasticity in behaving mice.
(A) Labeling strategy for all-optical assay of CCKBC synaptic function in vivo. (B) Top: example unfiltered fluorescence traces from four CA1 neurons (a–d). Bottom: spike raster (n = 30 neurons, 5 mice). Cyan bars: CCKBC photostimulation onset (488 nm, 10 ms duration, 9.5–20 mW/mm2, 0.5 Hz). (C) Mean subthreshold postsynaptic waveforms following presynaptic CCKBC photostimulation (n = 30 neurons, 5 mice). (D) Unfiltered example traces of plateau-driven complex spikes (red arrows) preceding photostimulation events (E) Additional example traces from the same cells as in (D), without complex spikes occurring within 1 sec before the stimulation. (F) Stimulus-triggered average (mean ± SEM) oeIPSP (black: with CS; orange: without CS). (G) Quantification of neuronal depolarization before stimulation and oeIPSP amplitudes (negative values), during trials with or without preceding complex spikes (depolarization: p = 0.0076, paired t-test, n = 15 cells, from 4 mice; oeIPSP amplitude: p = 0.0045). (H) Histograms of place field sizes of individual place cells in control mice and after cell type-specific CB1 KO in GABAergic neurons (GABA-CB1-KO). n = 420 ± 254 place cells, 5 control and 3 GABA-CB1-KO animals. (I) Quantification of place cell place field size and spatial information. n =13 sessions from 2 male and 2 female control mice; 19 sessions from 3 male GABA-CB1-KO mice. Markers and box plots show individual sessions (boxes: median ± interquartile range, whiskers: non-outlier range). Place field size: p = 0.032, χ2(1) = 4.59; spatial information: p = 0.004, χ2(1) = 8.5, linear mixed effects models and likelihood ratio test.

References

    1. Llano I, Leresche N, Marty A, Calcium entry increases the sensitivity of cerebellar Purkinje cells to applied GABA and decreases inhibitory synaptic currents. Neuron 6, 565–574 (1991). - PubMed
    1. Pitler T, Alger B, Postsynaptic spike firing reduces synaptic GABAA responses in hippocampal pyramidal cells. J Neurosci 12, 4122–4132 (1992). - PMC - PubMed
    1. Kreitzer AC, Regehr WG, Cerebellar Depolarization-Induced Suppression of Inhibition Is Mediated by Endogenous Cannabinoids. J Neurosci 21, RC174–RC174 (2001). - PMC - PubMed
    1. Wilson RI, Nicoll RA, Endogenous cannabinoids mediate retrograde signalling at hippocampal synapses. Nature 410, 588–592 (2001). - PubMed
    1. Maejima T, Hashimoto K, Yoshida T, Aiba A, Kano M, Presynaptic Inhibition Caused by Retrograde Signal from Metabotropic Glutamate to Cannabinoid Receptors. Neuron 31, 463–475 (2001). - PubMed

Publication types

Substances

LinkOut - more resources