. 2024 Mar;383(6686):eadk1291.
doi: 10.1126/science.adk1291. Epub 2024 Mar 1.

SynGAP regulates synaptic plasticity and cognition independently of its catalytic activity

Affiliations

SynGAP regulates synaptic plasticity and cognition independently of its catalytic activity

Yoichi Araki et al. Science. 2024 Mar.

Abstract

SynGAP is an abundant synaptic GTPase-activating protein (GAP) critical for synaptic plasticity, learning, memory, and cognition. Mutations in SYNGAP1 in humans result in intellectual disability, autistic-like behaviors, and epilepsy. Heterozygous Syngap1-knockout mice display deficits in synaptic plasticity, learning, and memory and exhibit seizures. It is unclear whether SynGAP imparts structural properties at synapses independently of its GAP activity. Here, we report that inactivating mutations within the GAP domain do not inhibit synaptic plasticity or cause behavioral deficits. Instead, SynGAP modulates synaptic strength by physically competing with the AMPA-receptor-TARP excitatory receptor complex in the formation of molecular condensates with synaptic scaffolding proteins. These results have major implications for developing therapeutic treatments for SYNGAP1-related neurodevelopmental disorders.


Figures

Fig. 1.
Fig. 1.. SynGAP GAP activity is not required for synaptic AMPAR recruitment in vitro.
(A) Representative live fluorescent confocal images of a secondary dendrite from a rat hippocampal neuron transfected with mCherry (cytosolic cell fill), SEP-GluA1, and Azurite-tagged WT (WT) or mutant SynGAP before (Baseline) or after chemical LTP (cLTP). Mutants included phospho-deficient SynGAP (2SA), GAP-inactive SynGAP (GAP*), and a combination mutant with both (GAP*+2SA). Endogenous SynGAP was knocked down by shRNA and replaced by exogenous shRNA-resistant Azurite-SynGAP. Arrowheads indicate representative synaptic spine heads with SynGAP dispersion and SEP-GluA1 insertion. White arrowheads indicate dendritic spines that enlarge and exhibit SEP-GluA1 insertion and SynGAP dispersion in response to cLTP. Yellow arrowheads indicate dendritic spines displaying SEP-GluA1 insertion and SynGAP dispersion without spine enlargement. Blue arrowheads indicate spines with no response during cLTP. Scale bar, 5 μm. (B) Quantification of SEP-GluA1 expression before and after cLTP in neurons transfected with WT or various mutant constructs. Normalized total synaptic spine GluA1 contents by dendritic intensity is shown (WT: n = 6, Basal 1.000 ± 0.086 A.U., cLTP 2.265 ± 0.303 A.U.; 2SA: n = 6, Basal 0.974 ± 0.055 A.U., cLTP 1.271 ± 0.088 A.U.; GAP*: n = 7, Basal 1.349 ± 0.145 A.U., cLTP 2.232 ± 0.211 A.U.; GAP*+2SA: n = 7, Basal 1.374 ± 0.189 A.U., cLTP 1.631 ± 0.141 A.U.). (C) Quantification of the average change in spine volume during cLTP in neurons expressing WT or various mutant constructs, as measured by mCherry cell fill. Normalized total synaptic mCherry by dendritic intensity is shown (WT: n = 6, Basal 1.000 ± 0.141 A.U., cLTP 2.238 ± 0.182 A.U.; 2SA: n = 6, Basal 1.058 ± 0.105 A.U., cLTP 1.326 ± 0.128 A.U.; GAP*: n = 7, Basal 1.961 ± 0.160 A.U., cLTP 2.392 ± 0.284 A.U.; GAP*+2SA: n = 7, Basal 1.880 ± 0.181 A.U., cLTP 2.323 ± 0.205 A.U.). (D) Quantification of synaptic SynGAP expression before and after cLTP induction in neurons transfected with WT or various mutant constructs. Normalized total synaptic spine SynGAP contents by dendritic intensity is shown (WT: n = 6, Basal 1.000 ± 0.018 A.U., cLTP 0.435 ± 0.074 A.U.; 2SA: n = 6, Basal 1.153 ± 0.048 A.U., cLTP 0.944 ± 0.073 A.U.; GAP*: n = 7, Basal 0.987 ± 0.058 A.U., cLTP 0.401 ± 0.059 A.U.; GAP*+2SA: n = 7, Basal 1.091 ± 0.034 A.U., cLTP 0.981 ± 0.073 A.U.). For (A) to (D), two-way ANOVA with repeated measures for chemical LTP treatment and multiple comparisons with Šídák’s test were used. *P < 0.05, **P < 0.01, ***P < 0.001, ****P < 0.0001; n.s., not significant.
Fig. 2.
Fig. 2.. SynGAP-GAP KI mice exhibit normal SynGAP protein expression but have elevated Ras-ERK signaling in the brain.
(A) Generation of Syngap1+/GAP* mice by CRISPR-Cas9. gRNA was designed to make the double-strand break near the target site, and the GAP activity-deficient mutant was introduced (FR→AL, “GAP*”) by homology-directed repair using a 94-nucleotide GAP-mutant oligo donor. (B to D) Representative immunoblots and quantification of SynGAP and GAPDH protein from whole brains of Syngap1+/GAP*, Syngap1GAP*/GAP* mice and WT littermates (Syngap1+/+). Syngap1+/+ (n = 2, mean ± SEM; 1.000 ± 0.046 A.U.) versus Syngap1+/GAP* (n = 2, mean ± SEM; 1.076 ± 0.077 A.U.); Syngap1+/+ (n = 2, mean ± SEM; 1.030 ± 0.069 A.U.) versus Syngap1GAP*/GAP* (n = 2, mean ± SEM; 1.020 ± 0.021 A.U.). *P < 0.05, Mann-Whitney test. (E to G) Representative immunoblots and quantification of phospho-ERK and total ERK protein from whole brains of Syngap1+/GAP*, Syngap1GAP*/GAP* mice and WT littermates (Syngap1+/+). Syngap1+/+ (n = 4, mean ± SEM; 1.05 ± 0.043 A.U.) versus Syngap1+/GAP*(n = 4, mean ± SEM; 1.288 ± 0.017 A.U.); Syngap1+/+ (n = 4, mean ± SEM; 1.000 ± 0.029 A.U.) versus Syngap1GAP*/GAP* (n = 4, mean ± SEM; 1.437 ± 0.092 A.U.). *P < 0.05, Mann-Whitney test. (H) Survival of Syngap1+/−, Syngap1−/− mice and WT littermates (Syngap1+/+) resultant from Syngap1+/− × Syngap1+/− breeding until age P10. Top panel: Observed number of mice (Syngap1+/+ = 8, Syngap1+/− = 12, Syngap1−/− = 0) versus Expected number of mice (Syngap1+/+ = 5, Syngap1+/− = 10, Syngap1−/− = 5); *P < 0.05, chi-square test. No Syngap1−/− mice survived until P10. Bottom panel: Survival plot. Log-rank (Mantel-Cox) test was used; Syngap1+/+ and Syngap1+/− (P = 0.36, n.s.); Syngap1+/+ and Syngap1−/− (***P = 0.0009). (I) Survival of Syngap1+/GAP*, Syngap1GAP*/GAP* mice and WT littermates cSyngap1+/+) resultant from Syngap1+/GAP* × Syngap1+/GAP* breeding until P10. Top Panel: Observed number of mice (Syngap1+/+ = 18, Syngap1+/GAP* = 27, Syngap1GAP*/GAP* = 13) versus Expected number of mice (Syngap1+/+ = 14.5, Syngap1+/GAP* = 29, Syngap1GAP*/GAP* = 14.5; chi-square test was used, n.s. (P = 0.57). Bottom panel: Survival plot. Log-rank (Mantel-Cox) test was used for Syngap1+/+ and Syngap1+/GAP* (P = 0.41, n.s.) and Syngap1+/+ and Syngap1GAP*/GAP* (P = 0.11, n.s.).
Fig. 3.
Fig. 3.. SynGAP-GAP KI mice have normal LTP.
(A) Averaged population field CA1 recordings of TBS-LTP time course obtained from brain slices of Syngap1+/− mice and Syngap1+/+ littermate controls. All data points are normalized to the averaged baseline fEPSP slope. Inset: Example averaged fEPSP traces from Syngap1+/+ and Syngap1+/− slices recorded during baseline (black) and 40 to 60 min after TBS-LTP induction (red). (B) Quantification of averaged TBS-LTP in Syngap1+/− and Syngap1+/+ littermates. Individual data points are superimposed. TBS-LTP is calculated by the ratio of the mean fEPSP slope measured 40 to 60 min after TBS-LTP induction (yellow-shaded region) divided by the averaged fEPSP baseline slope within each recorded sample (Syngap1+/+: n = 13, 150.9 ± 7.51% SEM; Syngap1+/−: n = 13, 123.0 ± 5.416% SEM). Mann-Whitney rank sum test was used. (C) Averaged population field CA1 recordings of TBS-LTP time course obtained from brain slices of Syngap1+/GAP* and Syngap1GAP*/GAP* mice as well as their Syngap1+/+ littermate controls. Inset: Example averaged fEPSP traces from Syngap1+/+, Syngap1+/GAP* and Syngap1GAP*/GAP* slices recorded during baseline (black) and 40 to 60 min after TBS-LTP induction (red). (D) Quantification of averaged TBS-LTP in Syngap1+/+, Syngap1+/GAP*, and Syngap1GAP*/GAP* littermates. Individual data points are superimposed. (Syngap1+/+: n = 22, 145.5 ± 4.74% SEM; Syngap1+/GAP*: n = 19, 151.9 ± 6.57% SEM; Syngap1GAP*/GAP*: n = 16, 154.8 ± 9.34% SEM). Nonparametric one-way ANOVA and Kruskal-Wallis multiple-comparisons test were used. Error bars and shading represent SEM. *P < 0.05; n.s., not significant.
Fig. 4.
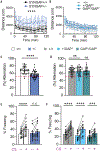
Fig. 4.. Syngap1+/GAP* KI mice have normal activity, working memory, and associative fear memory.
(A) Distance traveled by Syngap1+/− mice (n = 15) and Syngap1+/+ WT (WT) littermates (n = 18) during a 2-hour open-field test in 5-min intervals. Two-way ANOVA with repeated measures for time only and Šídák’s multiple-comparisons test were used. (B) Distance traveled by Syngap1+/GAP* mice (n = 16), Syngap1GAP*/GAP* mice (n = 14), and Syngap1+/+ WT littermates (n = 17) during a 2-hour open-field test in 5-min intervals. Two-way ANOVA with repeated measures for time only and Šídák’s multiple-comparisons test were used. (C) Percentage of spontaneous alternating arm visits (% alternation) by Syngap1+/− mice (n = 48, 56.00 ± 1.29% alternation) and Syngap1+/+ littermates (n = 37, 68.30 ± 1.58% alternation) during a 5-min Y-maze exploration test. The red dotted line represents the 50% successful alternation rate expected due to chance. Two-tailed Student’s t test was used. (D) Percentage of spontaneous alternating arm visits (% alternation) by Syngap1+/GAP* mice (n = 35, 65.63 ± 1.83% alternation), Syngap1GAP*/GAP* mice (n = 18, 67.14 ± 2.37% alternation), and Syngap1+/+ littermates (n = 35, 66.74 ± 1.49% alternation) during a 5-min Y-maze exploration test. The red dotted line represents the 50% successful alternation rate expected due to chance. One-way ANOVA and Tukey’s test were used. (E) Average percentage of time spent freezing per minute (% freezing) with and without the conditioned stimulus (auditory cue, CS) by Syngap1+/− mice (n = 14 29.12 ± 4.44% freezing) and Syngap1+/+ littermates (n = 19, 27.50 ± 2.37% freezing). Two-way ANOVA with repeated measures for CS only and Šídák’s multiple-comparisons test were used. (F) Average percentage of time spent freezing per minute (% freezing) with and without presentation of the conditioned stimulus (auditory cue, CS) by Syngap1+/GAP* mice (n = 15, 23.18 ± 2.84% freezing), Syngap1GAP*/GAP* mice (n = 19, 20.11 ± 2.129% freezing) and Syngap1+/+ littermates (n = 18, 27.15 ± 2.203% freezing). Two-way ANOVA with repeated measures for CS only and Šídák’s multiple-comparisons test were used. Error bars represent SEM. *P < 0.05, **P < 0.01, ***P < 0.001, ****P < 0.0001; n.s., not significant..
Fig. 5.
Fig. 5.. SynGAP-PSD95 and TARP-γ8-PSD95 compete in vitro.
(A) Confocal microscopy of COS cells transfected with GFP-γ8CT (“γ8”), PSD95-mCherry, and different amounts of Azurite-SynGAP (0.25× 0.5× 1×, 2×, and 4×). Scale bar, 5 μm. Right panel: percentage of PSD95 puncta with γ8 with different amounts of Azurite-SynGAP. One-way ANOVA and Tukey’s multiple-comparisons test were used. Error bars represent SD. *P < 0.05, **P < 0.01, ***P < 0.001; n.s., not significant. compared with γ8+PSD95. (B) Confocal microscopy of COS cells transfected with GFP-γ8CT (“γ8”), PSD95-mCherry, and different Azurite-SynGAP mutants (WT, LDKD, ΔPDZ, LDKD+ΔPDZ, ΔC143, ΔC580, GAP*, and GAP*+LDKD+ΔPDZ). Scale bar, 5 μm. Right panel: percentage of PSD95 puncta with γ8 with different amounts of Azurite-SynGAP. One-way ANOVA and Tukey’s multiple-comparisons test were used. Error bars represent SD. *P < 0.05, **P < 0.01, ***P < 0.001, ****P < 0.0001; n.s., not significant compared with γ8+PSD95+Azurite-SynGAP WT unless otherwise specified.
Fig. 6.
Fig. 6.. SynGAP-PSD95 and TARP-γ8-PSD95 show mutually exclusive phase-in-phase separation in droplets.
(A) Images of purified protein sedimentation assay by confocal microscopy. Purified proteins included TARP-γ8CT (“γ8”) tagged with iFlour568 (green), PSD95 tagged with iFlour633 (red), and SynGAPCC-PBM (last 156 amino acids of SynGAP: coiled-coil domain + PDZ ligand: “SynGAP”) tagged with iFlour488 (blue). Left panels: merged fluorescence images with DIC images. Top: γ8-PSD95 droplets. Middle: SynGAP-PSD95 droplets. Bottom: γ8-PSD95-SynGAP droplets. High-power views are also shown (right panels). Scale bar, 3 μm. (B) Phase-in-phase separation of SynGAP-PSD95 droplets inside the γ8-PSD95 droplets. Left panels: blue arrows or circles delineate the inner rings of phase-in-phase separation. Right panels: merge of DIC images with γ8-PSD95-SynGAP droplets. Yellow arrows indicate regions of separation between SynGAP and PSD95 phase. Scale bar, 3 μm. (C) Comparison between γ8-PSD95 droplets and γ8-PSD95-SynGAP droplets. A line scan of protein condensations (yellow line) is shown to the right of each image. Scale bar, 3 μm. (D) Optical sectioning microscopy of γ8-PSD95-SynGAP protein droplets. Top panels: x–y view. Bottom panels: x–z view. Optical slices (blue boxes) used to generate top (x–y) panels are shown. Scale bar, 5 μm. Right panel: schematic of γ8-PSD95-SynGAP droplets.
Fig. 7.
Fig. 7.. SynGAP GAP activity is not required for synaptic TARP-γ8 recruitment in vitro.
(A) Representative live fluorescent confocal images of a secondary dendrite from a rat hippocampal neuron transfected with GFP-TARP-γ8, mCherry (cytosolic cell fill) and Azurite-tagged WT or mutant SynGAP before (Baseline) or after chemical LTP (cLTP). Mutants include phospho-deficient SynGAP (2SA), GAP-inactive SynGAP (GAP*), and a combination mutant with both (GAP*+2SA). Endogenous SynGAP was knocked down by shRNA and replaced by exogenous shRNA-resistant Azurite-SynGAP. Arrowheads indicate representative synaptic spine heads with SynGAP dispersion and γ8 insertion. White arrowheads indicate dendritic spines that enlarge and exhibit γ8 insertion and SynGAP dispersion in response to chemical LTP. Yellow arrowheads indicate dendritic spines displaying γ8 insertion and SynGAP dispersion without enlargement (no structural plasticity). Blue arrowheads indicate spines with no response during cLTP. Scale bar, 5 μm. (B) Quantification of synaptic GFP-γ8 expression before and after cLTP induction in neurons expression WT or various mutant constructs. Normalized total synaptic spine γ8 contents by dendritic intensity are shown (WT: n = 6, Basal 1.000 ± 0.090 A.U., cLTP 2.394 ± 0.185 A.U.; 2SA: n = 6, Basal 0.992 ± 0.042 A.U., cLTP 1.162 ± 0.071 A.U.; GAP*: n = 7, Basal 1.438 ± 0.143 A.U., cLTP 2.666 ± 0.177 A.U.; GAP*+2SA: n = 7, Basal 1.675 ± 0.288 A.U., cLTP 1.867 ± 0.283 A.U.). (C) Quantification of the average change in spine volume during cLTP in neurons expressing WT or various mutant constructs as measured by mCherry cell fill. Normalized total synaptic mCherry by dendritic intensity is shown (WT: n = 6, Basal 1.000 ± 0.088 A.U., cLTP 2.516 ± 0.234 A.U.; 2SA: n = 6, Basal 0.978 ± 0.118 A.U., cLTP 1.301 ± 0.132 A.U.; GAP*: n = 7, Basal 1.945 ± 0.158 A.U., cLTP 2.644 ± 0.333 A.U.; GAP*+2SA: n = 7, Basal 1.875 ± 0.085 A.U., cLTP 2.038 ± 0.180 A.U.). (D) Quantification of synaptic SynGAP expression before and after cLTP induction in neurons transfected with WT or various mutant constructs. Normalized total synaptic spine SynGAP content by dendritic intensity is shown (WT: n = 6, Basal 1.000 ± 0.098 A.U., cLTP 0.435 ± 0.066 A.U.; 2SA: n = 6, Basal 1.077 ± 0.065 A.U., cLTP 0.997 ± 0.095 A.U.; GAP*: n = 7, Basal 1.032 ± 0.075 A.U., cLTP 0.497 ± 0.081 A.U.; GAP*+2SA: n = 7, Basal 1.019 ± 0.098 A.U., cLTP 0.912 ± 0.061 A.U.). Two-way ANOVA with repeated measures for chemical LTP treatment and multiple-comparisons with Šídák’s test were used. *P < 0.05, **P < 0.01, ***P < 0.001, ****P < 0.0001; n.s., not significant.
Fig. 8.
Fig. 8.. SynGAP phase-separation and PDZ-ligand binding capacity regulate TARP-γ8 trafficking during chemical LTP.
(A) Representative live fluorescent confocal images of a secondary dendrite from a rat hippocampal neuron transfected with GFP-γ8, mCherry (cytosolic cell fill), and Azurite-tagged WT or mutant SynGAP before (Baseline) or after either weak cLTP (10 μM; Glycine) or strong cLTP (200 μM; Glycine). Mutants include LDKD, ΔPDZ, or both. Endogenous SynGAP was knocked down by shRNA and replaced with exogenous shRNA-resistant Azurite-SynGAP. Green circles indicate spine heads with the basal condition. Yellow circles and arrows indicate dendritic spines that enlarge and exhibit γ8 insertion, spine enlargements, and SynGAP dispersion in response to chemical LTP. Blue arrows indicate dendritic spines displaying γ8 insertion and large spine even in the basal state. Scale bar, 5 μm. (B) Quantification of synaptic GFP-γ8 expression in neurons transfected with WT or various mutant constructs before and after cLTP. Normalized total synaptic spine γ8 contents by dendritic intensity are shown [WT: n = 5, Basal 1.218 ± 0.098 A.U. cLTP (10 μM) 1.556 ± 0.157 A.U, cLTP (200 μM) 3.237 ± 0.099 A.U.; LDKD: n = 6, Basal 1.356 ± 0.097 A.U. cLTP (10 μM) 3.164 ± 0.285 A.U, cLTP (200 μM) 3.540 ± 0.410 A.U. ΔPDZ: n = 6, Basal 1.853 ± 0.221 A.U., cLTP (10 μM) 1.996 ± 0.243 A.U, cLTP (200 μM) 2.748 ± 0.137 A.U.; LDKD+ΔPDZ: n = 5, Basal 2.474 ± 0.353 A.U., cLTP (10 μM) 3.075 ± 0.300 A.U, cLTP (200 μM) 3.312 ± 0.149 A.U.]. (C) Quantification of the average change in spine volume as measured by mCherry cell fill in neurons transfected with WT or various mutant constructs before and after cLTP. Normalized total synaptic mCherry by dendritic intensity are shown [WT: n = 5, Basal 1.139 ± 0.070 A.U. cLTP (10 μM) 1.538 ± 0.160 A.U, cLTP (200 μM) 2.974 ± 0.109 A.U.; LDKD: n = 6, Basal 1.220 ± 0.092 A.U. cLTP (10 μM) 2.868 ± 0.142 A.U, cLTP (200 μM) 3.586 ± 0.249 A.U. ΔPDZ: n = 6, Basal 1.816 ± 0.270 A.U., cLTP (10 μM) 1.954 ± 0.267 A.U, cLTP (200 μM) 3.098 ± 0.242 A.U.; LDKD+ΔPDZ: n = 5, Basal 2.771 ± 0.225 A.U., cLTP (10 μM) 2.698 ± 0.152 A.U, cLTP (200 μM) 3.022 ± 0.156 A.U.]. (D) Quantification of synaptic SynGAP expression in neurons transfected with WT or various mutant constructs before and after cLTP. Normalized total synaptic spine SynGAP contents by dendritic intensity are shown [WT: n = 5, Basal 4.530 ± 0.296 A.U. cLTP (10 μM) 4.194 ± 0.449 A.U, cLTP (200 μM) 1.852 ± 0.326 A.U.; LDKD: n = 6, Basal 3.909 ± 0.284 A.U. cLTP (10 μM) 1.569 ± 0.216 A.U, cLTP (200 μM) 1.254 ± 0.075 A.U. DPDZ: n = 6, Basal 3.646 ± 0.389 A.U., cLTP (10 μM) 3.348 ± 0.497 A.U, cLTP (200 μM) 1.392 ± 0.080 A.U.; LDKD+ΔPDZ: n = 5, Basal 1.422 ± 0.120 A.U., cLTP(10 μM) 1.128 ± 0.080 A.U, cLTP (200 μM) 1.098 ± 0.033 A.U.]. Two-way ANOVA with repeated measures for chemical LTP treatment and multiple-comparisons with Šídák’s test were used. *P < 0.05, **P < 0.01, ***P < 0.001, ****P < 0.0001; n.s., not significant.

Comment in

References

    1. Kessels HW, Malinow R, Synaptic AMPA receptor plasticity and behavior. Neuron 61, 340–350 (2009). doi: 10.1016/j.neuron.2009.01.015 - DOI - PMC - PubMed
    1. Huganir RL, Nicoll RA, AMPARs and synaptic plasticity: The last 25 years. Neuron 80, 704–717 (2013). doi: 10.1016/j.neuron.2013.10.025 - DOI - PMC - PubMed
    1. Nicoll RA, A brief history of long-term potentiation. Neuron 93, 281–290 (2017). doi: 10.1016/j.neuron.2016.12.015 - DOI - PubMed
    1. Shi S, Hayashi Y, Esteban JA, Malinow R, Subunit-specific rules governing AMPA receptor trafficking to synapses in hippocampal pyramidal neurons. Cell 105, 331–343 (2001). doi: 10.1016/S0092-8674(01)00321-X - DOI - PubMed
    1. Lisman J, Raghavachari S, A unified model of the presynaptic and postsynaptic changes during LTP at CA1 synapses. Sci. STKE 2006, re11 (2006). doi: 10.1126/stke.3562006re11 - DOI - PubMed

Publication types

Substances

LinkOut - more resources