. 2024 Feb 29;20(2):e1012050.
doi: 10.1371/journal.ppat.1012050. eCollection 2024 Feb.

Ongoing evolution of the Mycobacterium tuberculosis lactate dehydrogenase reveals the pleiotropic effects of bacterial adaption to host pressure

Affiliations

Ongoing evolution of the Mycobacterium tuberculosis lactate dehydrogenase reveals the pleiotropic effects of bacterial adaption to host pressure

Sydney Stanley et al. PLoS Pathog. .

Abstract

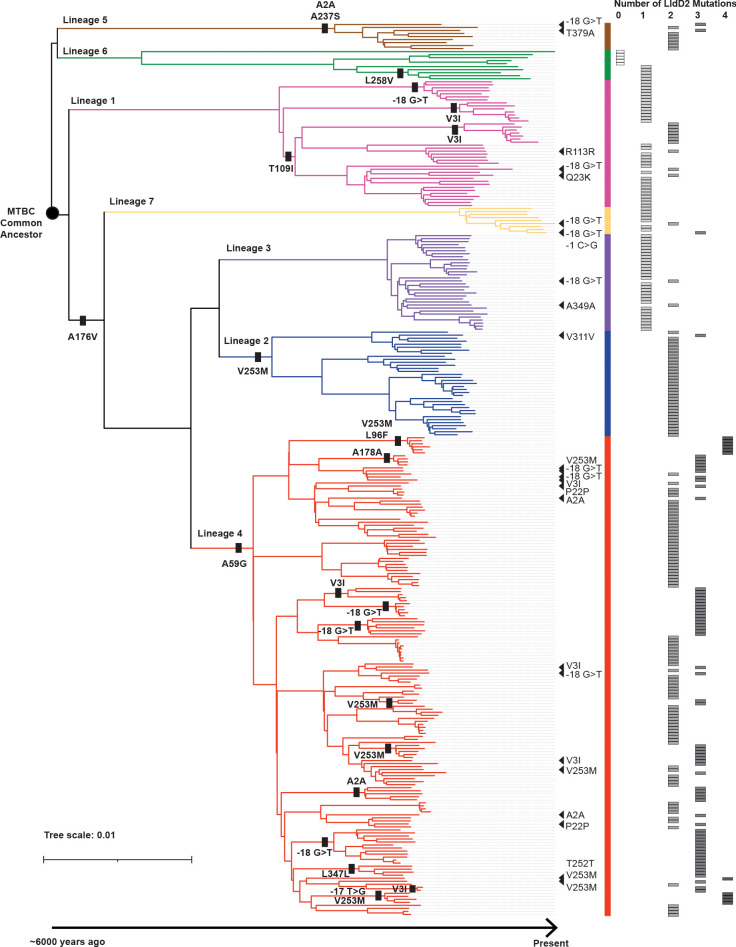
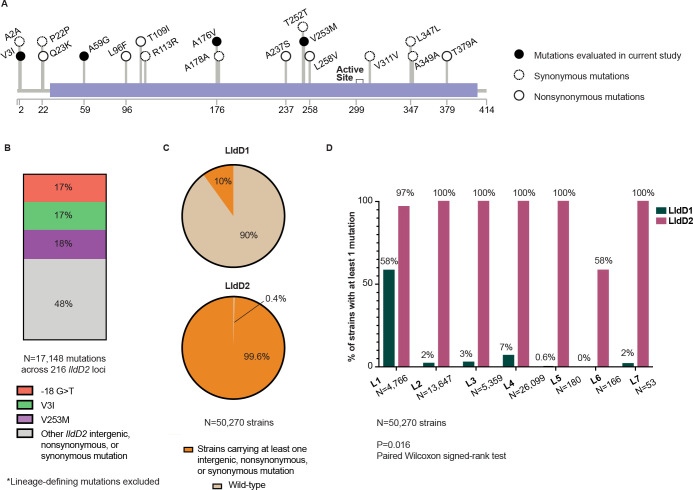
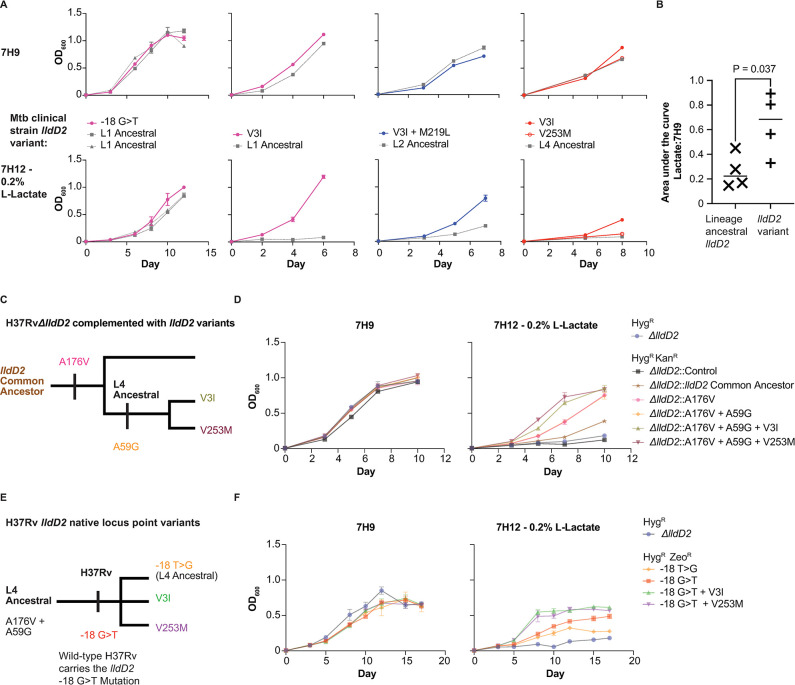
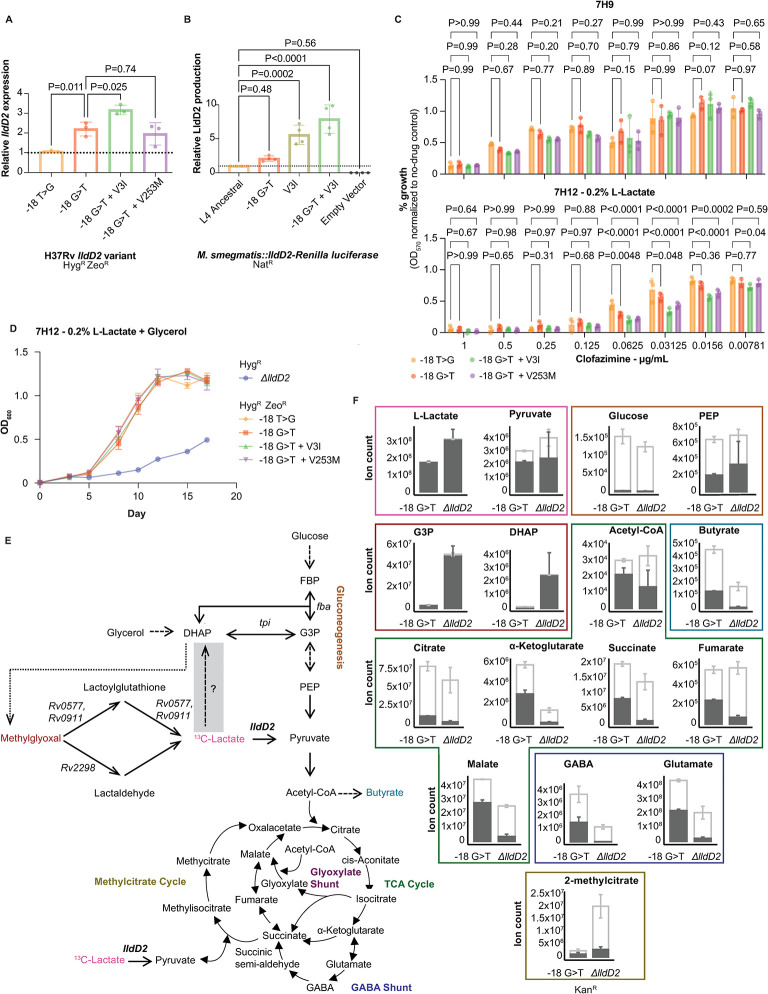
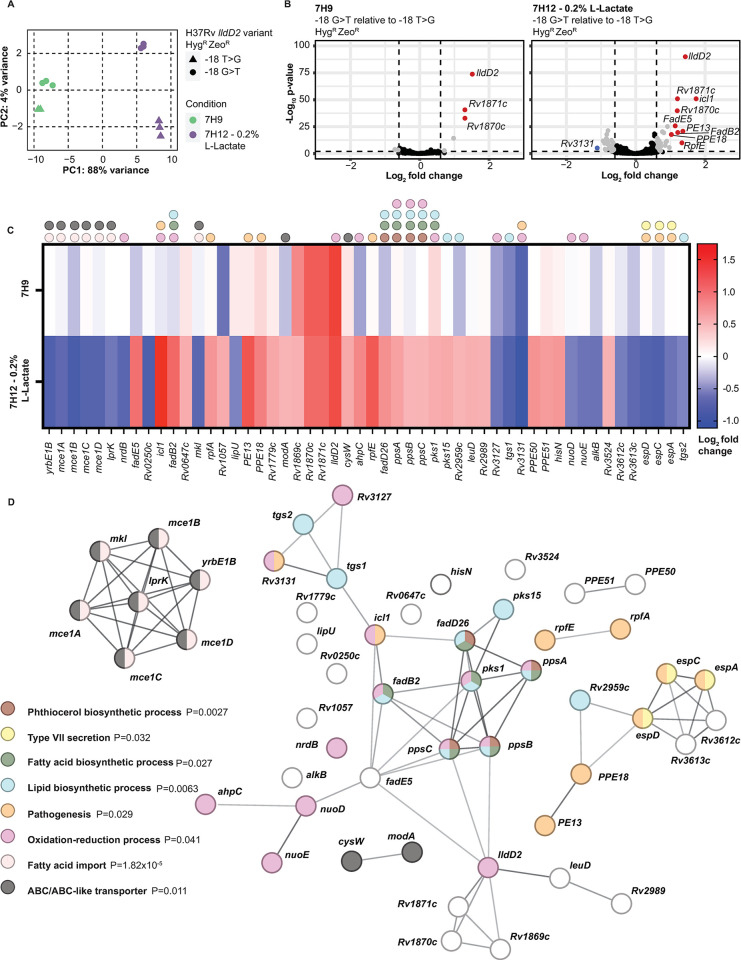
The bacterial determinants that facilitate Mycobacterium tuberculosis (Mtb) adaptation to the human host environment are poorly characterized. We have sought to decipher the pressures facing the bacterium in vivo by assessing Mtb genes that are under positive selection in clinical isolates. One of the strongest targets of selection in the Mtb genome is lldD2, which encodes a quinone-dependent L-lactate dehydrogenase (LldD2) that catalyzes the oxidation of lactate to pyruvate. Lactate accumulation is a salient feature of the intracellular environment during infection and lldD2 is essential for Mtb growth in macrophages. We determined the extent of lldD2 variation across a set of global clinical isolates and defined how prevalent mutations modulate Mtb fitness. We show the stepwise nature of lldD2 evolution that occurs as a result of ongoing lldD2 selection in the background of ancestral lineage-defining mutations and demonstrate that the genetic evolution of lldD2 additively augments Mtb growth in lactate. Using quinone-dependent antibiotic susceptibility as a functional reporter, we also find that the evolved lldD2 mutations functionally increase the quinone-dependent activity of LldD2. Using 13C-lactate metabolic flux tracing, we find that lldD2 is necessary for robust incorporation of lactate into central carbon metabolism. In the absence of lldD2, label preferentially accumulates in dihydroxyacetone phosphate (DHAP) and glyceraldehyde-3-phosphate (G3P) and is associated with a discernible growth defect, providing experimental evidence for accrued lactate toxicity via the deleterious buildup of sugar phosphates. The evolved lldD2 variants increase lactate incorporation to pyruvate while altering triose phosphate flux, suggesting both an anaplerotic and detoxification benefit to lldD2 evolution. We further show that the mycobacterial cell is transcriptionally sensitive to the changes associated with altered lldD2 activity which affect the expression of genes involved in cell wall lipid metabolism and the ESX- 1 virulence system. Together, these data illustrate a multifunctional role of LldD2 that provides context for the selective advantage of lldD2 mutations in adapting to host stress.


Conflict of interest statement

The authors have declared that no competing interests exist.

Figures

Fig 1
Fig 1. Stepwise evolution of LldD2.
Phylogenetic tree of 296 M. tuberculosis and M. africanum clinical isolates representing the global diversity of the Mycobacterium tuberculosis complex (MTBC). The tree scale denotes number of mutations per site. Ancestrally derived lineage and sub-lineage defining lldD2 mutations are indicated by a bar. Triangles denote de novo or homoplastic mutations. Total number of mutations per strain is tallied to the right of the phylogenetic tree.
Fig 2
Fig 2. Prevalence of various LldD2 mutations.
(A) Schematic of LldD2 depicting the amino acid position of coding mutations listed in Fig 1. The purple rectangle illustrates the FMN-dependent alpha-hydroxy acid dehydrogenase motif. (B) Percentage of lldD2 homoplastic or clade-defining mutations belonging to the indicated genotype. 17,148 mutations spanning 216 unique loci were identified across 50,270 strains. (C) Percentage of strains carrying at least one of the indicated mutations in either LldD1 or LldD2. (D) Comparison of the percentage of strains carrying at least one LldD1 or LldD2 mutation for each lineage.
Fig 3
Fig 3. Ancestral and homoplastic mutations in lldD2 augment Mtb fitness in lactate.
(A) Growth curves of Mtb clinical strains from L1, L2, and L4. Strains are grouped for comparison of the lldD2 homoplastic mutation strains to closely related lineage ancestral strains. All cultures started at OD600 0.005 at day 0. Triplicate replicates shown, error bars represent the standard deviation. (B) Quantification of the area under the curves (AUCs) from A. The AUC in 7H12–0.2% L-lactate is normalized to that of 7H9 for a given strain. The AUC is averaged for the V3I and V253M L4 strains and for the two L1 ancestral strains that were paired to -18 G>T. P-value indicates results of an unpaired t-test. (C) and (E) Schematic depicting the construction of recombinant lldD2 strains. (D) and (F) Growth curves of the strains indicated in (C) and (E). HygR, KanR, and ZeoR refer to hygromycin, kanamycin, and zeocin resistance respectively. All cultures started at OD600 0.005 at day 0. Triplicate replicates shown, error bars represent the standard deviation. Representative of two independent experiments.
Fig 4
Fig 4. lldD2 homoplastic mutations modulate gene and enzyme activity.
(A) lldD2 expression as measured by qPCR. Gene expression is normalized to that of -18 T>G. Each dot represents average of technical replicates from one of three independent experiments. Error bars indicate standard deviation. P-value indicates results of an ordinary one-way ANOVA test with Dunnett’s multiple comparison correction. (B) LldD2 production as measured by a Renilla luciferase assay. Luminescence normalized to that of the Msm strain expressing the L4 ancestral version of lldD2. Each dot represents average of technical replicates from an independent experiment, error bars represent the standard deviation. P-value indicates results of an ordinary one-way ANOVA test with Dunnett’s multiple comparison correction. NatR refers to nourseothricin resistance. (C) Alamar blue assay of clofazimine (CFZ). P-value indicates the results of two-way ANOVA with Dunnett’s multiple test correction. Triplicate replicates shown, error bars represent the standard deviation. (D) Growth curves of the indicated strains. All cultures started at OD600 0.005 at day 0. Triplicate replicates shown, error bars represent the standard deviation. Representative of two independent experiments. (E) Schematic of 13C-Lactate metabolic flux assay. Grey box indicates a proposed pathway. Dotted arrow represents the spontaneous conversion of DHAP to methylglyoxal. Dashed arrows represent abbreviated steps. (F) 13C-Lactate metabolic flux assay results. Error bars represent the standard deviation of three technical replicates. Dark grey indicates labeled carbon ions, light grey represents total carbon ions.
Fig 5
Fig 5. Lactate and lldD2 variants remodel the Mtb virulence transcriptome.
(A) Principal component analysis of the RNA-seq technical replicates based on normalized counts. (B) Volcano plot of the differential expression (DE) analysis. Grey indicates DE genes with log2 fold change (L2FC) greater than 0.6 or less than -0.6 (P<0.01), red indicates DE genes with an L2FC greater than 1, blue indicates DE genes with an L2FC less than -1. There are 7 DE genes in 7H9 and 52 DE genes in lactate. (C) Heatmap of the 52 DE genes from the lactate condition, 7H9 shown for comparison. The genes are ordered according to chromosome position. Dots denote genes involved in the pathways shown in (D). (D) STRING protein-protein interaction network of the 52 DE genes from the lactate condition. P-value indicates the significance of Gene Ontology, KEGG, or STRING pathway enrichment after multiple test correction.

Update of

References

    1. World Health Organization. (2022). Global tuberculosis report 2022.
    1. Gagneux S. (2018). Ecology and evolution of Mycobacterium tuberculosis. Nature Reviews Microbiology, 16(4), 202–213. doi: 10.1038/nrmicro.2018.8 - DOI - PubMed
    1. Brites D., & Gagneux S. (2015). Co-evolution of Mycobacterium tuberculosis and Homo sapiens. Immunological reviews, 264(1), 6–24. doi: 10.1111/imr.12264 - DOI - PMC - PubMed
    1. Achtman M. (2008). Evolution, population structure, and phylogeography of genetically monomorphic bacterial pathogens. Annu. Rev. Microbiol., 62, 53–70. doi: 10.1146/annurev.micro.62.081307.162832 - DOI - PubMed
    1. Denamur E., & Matic I. (2006). Evolution of mutation rates in bacteria. Molecular microbiology, 60(4), 820–827. doi: 10.1111/j.1365-2958.2006.05150.x - DOI - PubMed