. 2024 Mar;134(5):505-525.
doi: 10.1161/CIRCRESAHA.123.322910. Epub 2024 Feb 7.

Glycolysis-Mediated Activation of v-ATPase by Nicotinamide Mononucleotide Ameliorates Lipid-Induced Cardiomyopathy by Repressing the CD36-TLR4 Axis

Affiliations

Glycolysis-Mediated Activation of v-ATPase by Nicotinamide Mononucleotide Ameliorates Lipid-Induced Cardiomyopathy by Repressing the CD36-TLR4 Axis

Shujin Wang et al. Circ Res. 2024 Mar.

Abstract

Background: Chronic overconsumption of lipids followed by their excessive accumulation in the heart leads to cardiomyopathy. The cause of lipid-induced cardiomyopathy involves a pivotal role for the proton-pump vacuolar-type H+-ATPase (v-ATPase), which acidifies endosomes, and for lipid-transporter CD36, which is stored in acidified endosomes. During lipid overexposure, an increased influx of lipids into cardiomyocytes is sensed by v-ATPase, which then disassembles, causing endosomal de-acidification and expulsion of stored CD36 from the endosomes toward the sarcolemma. Once at the sarcolemma, CD36 not only increases lipid uptake but also interacts with inflammatory receptor TLR4 (Toll-like receptor 4), together resulting in lipid-induced insulin resistance, inflammation, fibrosis, and cardiac dysfunction. Strategies inducing v-ATPase reassembly, that is, to achieve CD36 reinternalization, may correct these maladaptive alterations. For this, we used NAD+ (nicotinamide adenine dinucleotide)-precursor nicotinamide mononucleotide (NMN), inducing v-ATPase reassembly by stimulating glycolytic enzymes to bind to v-ATPase.

Methods: Rats/mice on cardiomyopathy-inducing high-fat diets were supplemented with NMN and for comparison with a cocktail of lysine/leucine/arginine (mTORC1 [mechanistic target of rapamycin complex 1]-mediated v-ATPase reassembly). We used the following methods: RNA sequencing, mRNA/protein expression analysis, immunofluorescence microscopy, (co)immunoprecipitation/proximity ligation assay (v-ATPase assembly), myocellular uptake of [3H]chloroquine (endosomal pH), and [14C]palmitate, targeted lipidomics, and echocardiography. To confirm the involvement of v-ATPase in the beneficial effects of both supplementations, mTORC1/v-ATPase inhibitors (rapamycin/bafilomycin A1) were administered. Additionally, 2 heart-specific v-ATPase-knockout mouse models (subunits V1G1/V0d2) were subjected to these measurements. Mechanisms were confirmed in pharmacologically/genetically manipulated cardiomyocyte models of lipid overload.

Results: NMN successfully preserved endosomal acidification during myocardial lipid overload by maintaining v-ATPase activity and subsequently prevented CD36-mediated lipid accumulation, CD36-TLR4 interaction toward inflammation, fibrosis, cardiac dysfunction, and whole-body insulin resistance. Lipidomics revealed C18:1-enriched diacylglycerols as lipid class prominently increased by high-fat diet and subsequently reversed/preserved by lysine/leucine/arginine/NMN treatment. Studies with mTORC1/v-ATPase inhibitors and heart-specific v-ATPase-knockout mice further confirmed the pivotal roles of v-ATPase in these beneficial actions.

Conclusion: NMN preserves heart function during lipid overload by preventing v-ATPase disassembly.

Keywords: diabetic cardiomyopathies; endosomes; fibrosis; insulin resistance; lipid metabolism; toll-like receptor 4.


Conflict of interest statement

Disclosures None.

Figures

Figure 1.
Figure 1.
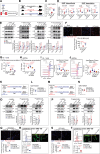
Lysine/leucine/arginine (KLR) supplementation through mTORC1 (mechanistic target of rapamycin complex 1) activation reactivates vacuolar-type H+-ATPase (v-ATPase) in the lipid-overloaded heart. A, Scheme illustrating how KLR supplementation lowers endosomal pH via reactivation of v-ATPase by mTORC1-v-ATPase in a rapamycin/bafilomycin A-sensitive manner. B, Experimental design of KLR supplementation: male rats were fed for 18 wk with a low-fat diet (LFD; 10 en% fat), a high-fat diet (HFD; 60 en% fat), HFD with high concentrations of lysine (7 mmol/L), leucine (12 mmol/L), and arginine (10 mmol/L) added to the drinking water during the last 6 wk (HFD/KLR) and with intraperitoneal injection of 2-mg/kg.bw/d rapamycin (HFD/KLR/Rap) or 0.5-mg/kg.bw/d bafilomycin A1 (HFD/KLR/BafA) for the last 6 wk (12 rats in each group). C, Plasma concentrations of arginine, leucine, and lysine (n=7). D, Activation of mTORC1. Phosphorylation and expression of mTORC1 (p-mTOR ser2448 and total mTORC1) and p70S6K (p-p70S6 kinase Thr389) were detected by Western blotting and quantified (n=4). Representative blots of p-mTORC1 and p-p70S6K are displayed. HSP90: loading control. E, Assessment of v-ATPase assembly and complex formation with mTORC1 by immunoprecipitation (IP; n=4). For this, we measured expression levels of mTORC1 and v-ATPase subunits in heart lysates and subsequently performed IPs against mTORC1 and v-ATPase subunits V1B2 and V0d1. Representative Western blots and quantification of mTORC1, V0a2, V1B2, V0d1, and LAMTOR1 (late endosomal/lysosomal adaptor 1; subunit of the Ragulator subcomplex and part of the mTORC1 holocomplex) are displayed. F, Duolink proximity ligation assay (PLA) staining reveals the assembly status of v-ATPase (V1B2/V0d1). G, Duolink PLA staining reveals mTORC1-V0d1 interactions in situ. H, Duolink PLA staining reveals mTORC1-RHEB (ras homolog expressed in brain) interactions in situ. Image data from F through H were analyzed for the total number of PLA signals per 30-μm2 region of interest (ROI). Representative images and their quantification are displayed (n=4; scale bar, 10 µm). I through L, HL-1 cells and adult rat cardiomyocytes (aRCMs) were cultured for 24 h under following conditions: control (Ctrl in HL-1 cells, no palmitate; Ctrl in aRCMs, 20-μM palmitate complexed to 67-µmol/L bovine serum albumin [BSA], palmitate/BSA ratio 0.3:1), high palmitate (HP in HL-1 cells: 500-μM palmitate complexed to 67-µmol/L BSA, palmitate/BSA ratio 6:1; HP in aRCMs: 200-μM palmitate complexed to 67-µmol/L BSA, palmitate/BSA ratio 3:1), HP supplemented with Lys/Leu/Arg at 1.36/1.84/1.56 mmol/L (HP/KLR), HP/KLR supplemented with 100-nmol/L rapamycin (HP/KLR/Rap), 200-nmol/L torin1 (HP/KLR/Torin1), or 100-nmol/L BafA (HP/KLR/BafA). Directly after the culturing, cells were used for the [3H]chloroquine (CHLQ) accumulation assay (I and J, n=6) or for staining with LysoSensor-Green DND-189 (K and L). On LysoSensor staining, cells were examined with flow cytometry analysis (K, n=16; L, n=8). Data are represented as mean±SEM; exact P values were indicated in each figure. IgG indicates immunoglobulin G; and SD, Sprague-Dawley rats.
Figure 2.
Figure 2.
Nicotinamide mononucleotide (NMN) supplementation dependent on conversion to NAD+ (nicotinamide adenine dinucleotide) reactivates vacuolar-type H+-ATPase (v-ATPase) in the lipid-overloaded heart. A, Scheme illustrating the effect of NMN on endosomal pH in different experiments. B, Workflow of experimental design. Male mice were fed for 18 wk with a normal diet (ND), a high-fat diet (HFD; 60 en% fat), or HFD with drinking water containing 500 mg/L (w/v) of NMN (HFD/NMN; 10 mice in each group). C, L, and N, The ratios of NAD+/NADH (nicotinamide adenine dinucleotide hydrogen) in heart tissues of mice (C, L, and N, n=6). D, mRNA expression levels of NAD+ biosynthesis (slc12a8 and nmnat1) and NAD+ degradation genes (cd38, parp1, and sirt1) in heart lysates (n=6). E, Assessment of v-ATPase assembly and complex formation with the glycolytic enzyme aldolase by immunoprecipitation (IP; n=4). For this, we measured expression levels of v-ATPase subunits and the glycolytic enzyme aldolase in heart lysates and subsequently performed IPs against v-ATPase subunits (V1B2 and V0d1) and aldolase. Representative Western blots and quantification of V0a2, V1B2, V0d1, and aldolase are displayed. F, Q, and S, Duolink proximity ligation assay (PLA) staining reveals the assembly status of v-ATPase (V1B2/V0d1). Image data were analyzed for the total number of PLA signals per 30-μm2 region of interest (ROI). Representative images and their quantification are displayed (F, Q, and S, n=4; scale bar, 10 µm). G through J, HL-1 cells and adult rat cardiomyocytes (aRCMs) were cultured for 24 h under following conditions: control (Ctrl in HL-1 cells, no palmitate; Ctrl in aRCMs, 20-μM palmitate complexed to 67-µmol/L bovine serum albumin [BSA], palmitate/BSA ratio 0.3:1), high palmitate (HP in HL-1 cells: 500-μM palmitate complexed to 67-µmol/L BSA, palmitate/BSA ratio 6:1; HP in aRCMs: 200-μM palmitate complexed to 67-µmol/L BSA, palmitate/BSA ratio 3:1), HP supplemented with 1-mmol/L NMN (HP/NMN), HP/NMN supplemented with either 1-mM 2-deoxy-D-glucose (HP/NMN/2DG), 10-μM 3-bromopyruvate (HP/NMN/3BP), or 100-nmol/L bafilomycin A (HP/NMN/BafA). Directly after the culturing, cells were used for the [3H]chloroquine (CHLQ) accumulation assay (G, n=6; H, n=5) or for staining with LysoSensor-Green DND-189 (I and J). On LysoSensor staining, cells were examined with flow cytometry analysis (I, n=12 for Ctrl, NMN, n=8 for HP, HP/NMN, HP/NMN/BafA, and n=4 for HP/NMN/2DG, HP/NMN/3BP; J, n=10). K through T, Experiments in the 2 cardiospecific v-ATPase-knockout (KO) models concerning the effect of NMN supplementation on top of HFD on v-ATPase assembly/activity. K, V0d2flox/flox littermates (V0d2-LM, n=12) and V0d2flox/flox Myhc6-Cre knock-out mice (V0d2-mHom, n=10) were fed with HFD/NMN for 14 wk. M, V1G1flox/- littermates (V1G1-LM, n=10), and V1G1flox/- Myhc6-Cre knock-out mice (V1G1-mHet, n=8) were fed with HFD/NMN for 14 wk. O and P, Assessment of v-ATPase assembly status in heart lysates from V0d2-mHom mice (O, n=3) and V1G1-mHet mice (P, n=3). For this, we measured expression levels of v-ATPase subunits in heart lysates and subsequently performed IPs against v-ATPase subunits (V1B2 and V0d1). Representative Western blots and quantification of V0a2, V1B2, and V0d1 are displayed. R and T, Assessment of endosomal/lysosomal pH in isolated adult mouse cardiomyocytes (ACMs) from V0d2-mHom mice (R, n=6) and V1G1-mHet mice (T, n=6), respectively. On LysoSensor-Green DND-189 staining, cells were examined with flow cytometry analysis or fluorescence microscopy (scale bar, 100 µm). Data are represented as mean±SEM; exact P values were indicated in each figure. DAPI indicates 4′,6-diamidino-2-phenylindole.
Figure 3.
Figure 3.
Vacuolar-type H+-ATPase (v-ATPase) activation by lysine/leucine/arginine (KLR) and nicotinamide mononucleotide (NMN) supplementation to rats/mice reverses CD36-mediated lipid accumulation in the heart. A, B, and K through P, In vitro measurement of CD36-mediated lipid accumulation in adult rat cardiomyocytes (aRCMs). aRCMs were cultured for 24 h under the following conditions: control (Ctrl, 20-μM palmitate complexed to 67-µmol/L bovine serum albumin [BSA], palmitate/BSA ratio 0.3:1), high palmitate (HP, 200-μM palmitate complexed to 67-µmol/L BSA, palmitate/BSA ratio 3:1), HP supplemented with Lys/Leu/Arg at 1.36/1.84/1.56 mmol/L (HP/KLR), HP/KLR supplemented with 100-nmol/L rapamycin (HP/KLR/Rap), or 100-nmol/L bafilomycin A (HP/KLR/BafA), HP supplemented with 1-mM NMN (HP/NMN), and HP/NMN supplemented with 100-nmol/L BafA (HP/NMN/BafA). A and B, Assessment of cell surface CD36 in aRCMs using a biotinylation assay. For this, CD36 was detected by Western blotting in cell surface fractions (cell surface CD36 and caveolin-3) and total lysate (total CD36) and subsequently quantified (A and B, n=4). K and L, [14C]palmitate uptake in aRCMs (K, n=10; L, n=5). M and N, Assessment of triacylglycerol contents in aRCMs using a commercial kit (M and N, n=6). O and P, [3H]Deoxyglucose uptake in aRCMs (O, n=10; P, n=6). C through J, In vivo measurement of CD36-mediated lipid accumulation in hearts from experimental groups of rats/mice. The workflows of the animal experiment design are shown in Figures 1 and 2. Experimental groups are (1) rats on 18-wk low-fat diet (LFD; 10 en% fat), rats on 18-wk high-fat diet (HFD; 60 en% fat), rats on HFD with Lys/Leu/Arg supplementation (7/12/10 mmol/L) for last 6 wk (HFD/KLR), and rats on HFD/KLR with rapamycin (HFD/KLR/Rap) or bafilomycin A1 supplementation (HFD/KLR/BafA); (2) wt-mice on 18-wk normal diet (ND), wt-mice on 18-wk HFD (60 en% fat), and wt-mice on HFD with NMN for 18 wk (HFD/NMN); (3) V0d2flox/flox littermates (V0d2-LM) on HFD/NMN and V0d2-mHom mice on HFD/NMN; and (5) V1G1flox/- littermates (V1G1-LM) on HFD/NMN and V1G1-mHet mice on HFD/NMN. C, E, G, and I, Fluorescence microscopical assessment of CD36 at the cell surface of heart tissue. On display are representative confocal images of hearts stained for CD36 (green), Wheat germ agglutinin (WGA, purple), and nuclei with 4′,6-diamidino-2-phenylindole (DAPI; blue). Scale bar, 33 µm. Cell surface CD36 was quantified by Image-J software (C, E, G, and I, n=10 random fields from 5 biologically independent samples per condition). D, F, H, and J, Assessment of CD36 protein levels by Western blotting in heart lysates. HSP90: loading control. Representative blots and their quantification are displayed (D and F, n=4; H and I, n=6). Data are represented as mean±SEM; exact P values were indicated in each figure.
Figure 4.
Figure 4.
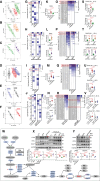
Vacuolar-type H+-ATPase (v-ATPase) activation by lysine/leucine/arginine (KLR) and nicotinamide mononucleotide (NMN) supplementation specifically reduces cardiac diacylglycerol (DAG) contents. A through F, Partial least-squares discriminant analysis (PLS-DA) score plots of cardiac lipidomics analysis (A–C, G, and H, n=7; D and I, n=9; and E, F, and J, n=5). G through J, Lipidomic heatmap showing Z-score normalization of main cardiac lipid classes from A through F. Horizontal rows present different major lipid classes; vertical columns present different experimental animal groups: (1) rats on 18-wk low-fat diet (LFD; 10 en% fat), rats on 18-wk high-fat diet (HFD; 60 en% fat), rats on HFD with Lys/Leu/Arg supplementation (7/12/10 mmol/L) for last 6 wk (HFD/KLR), rats on HFD/KLR with rapamycin (HFD/KLR/Rap), or bafilomycin A1 supplementation (HFD/KLR/BafA); (2) wt-mice on 18-wk normal diet (ND), wt-mice on 18-wk HFD (60 en% fat), and wt-mice on HFD with NMN for 18 wk (HFD/NMN); (3) V1G1flox/- littermates (V1G1-LM) on HFD/NMN and V1G1-mHet mice on HFD/NMN; and (4) V0d2flox/flox littermates (V0d2-LM) on HFD/NMN and V0d2-mHom mice on HFD/NMN. Relative change of each lipid class is indicated by coloring, and the scale is represented in the color key. K through N, Assessment of contents of diacylglycerol (DAG) in heart tissues from G through J (K and L, n=7; M, n=9; and N, n=5). Other cardiac lipid classes are displayed in Figures S7 and S8. O through R, The heatmap of individual DAG species containing MUFA and PUFA acyl tails showing significant changes (log2-fold changes >10, Z-score normalization; O and P, n=7; Q, n=9; and R, n=5). S through V, The contents of the 2 DAG species with the most prominent changes were further assessed in heart tissues from each of the experimental groups (S and T, n=7; U, n=9; and V, n=5). W, Schematic presentation of the pathway of de novo lipogenesis: genes are represented with blue oval shapes, and metabolites are represented with gray oval shapes. Genes showing significant normalization of expression by KLR or NMN on induction by HFD were denoted with red asterisks. X and Y, Protein expression of KLR/NMN normalized genes involved in DAG/TAG metabolism in heart tissue. Representative Western blots and quantification of LPIN1 (phosphatidic acid phosphohydrolase1), ATGL (adipose triglyceride lipase), DGAT 1 (diacylglycerol acyltransferase 1), and HSP90 (loading control) are on display (X and Y, n=4). Cardiac mRNA expressions of these genes and the other indicated lipogenesis-involved genes in W are displayed in Figure S9. Data are represented as mean±SEM; exact P values were indicated in each figure. MUFA indicates monounsaturated fatty acids; and PUFA, polyunsaturated monounsaturated fatty acids.
Figure 5.
Figure 5.
Vacuolar-type H+-ATPase (v-ATPase) activation by lysine/leucine/arginine (KLR) and nicotinamide mononucleotide (NMN) supplementation inhibits the interaction of CD36 and TLR4 (Toll-like receptor 4) at the cell surface. A and B, Assessment of cell surface TLR4 in neonatal mice ventricular myocytes (NMVMs) using a biotinylation assay. NMVMs were cultured for 24 h under the following conditions: control (Ctrl), high palmitate (HP), HP/KLR, or HP/NMN. TLR4 was then detected by Western blotting in cell surface fractions (cell surface TLR4 and caveolin-3) and total lysate (total TLR4) and subsequently quantified (A and B, n=4). C through P, Assessment of CD36-TLR4 cell surface complex formation in heart tissue. The workflows of animal experiments are shown in Figures 1 and 2. Experimental groups are (1) rats on 18-wk low-fat diet (LFD; 10 en% fat), rats on 18-wk high-fat diet (HFD; 60 en% fat), rats on HFD with Lys/Leu/Arg supplementation (7/12/10 mmol/L) for last 6 wk (HFD/KLR), and rats on HFD/KLR with rapamycin (HFD/KLR/Rap) or bafilomycin A1 supplementation (HFD/KLR/BafA); (2) wt-mice on 18-wk normal diet (ND), wt-mice on 18-wk HFD (60 en% fat), and wt-mice on HFD with NMN for 18 wk (HFD/NMN); (3) V1G1flox/- littermates (V1G1-LM) on HFD/NMN and V1G1-mHet mice on HFD/NMN; and (4) V0d2flox/flox LM (V0d2-LM) on HFD/NMN and V0d2-mHom mice on HFD/NMN. C, E, G, and I, Fluorescence microscopical assessment of TLR4 at the cell surface of heart tissue. On display are representative confocal images of hearts stained for TLR4 (red), Wheat germ agglutinin (WGA, purple), and nuclei with 4′,6-diamidino-2-phenylindole (DAPI; blue). Scale bar, 33 µm. Cell surface TLR4 was quantified with Image-J software (C, E, G, and I, n=10 random fields from 5 biologically independent samples per condition). D, F, H, and J, Assessment of TLR4 protein levels by Western blotting in heart lysates. HSP90: loading control. Representative blots and quantification are displayed (D and F, n=4; H and J, n=6). K and L, Assessment of complex formation of TLR4 with CD36 by immunoprecipitation (IP). For this, we measured expression levels of both proteins in heart lysates before IP analysis (lysates) and subsequently performed IP against both proteins. Representative Western blots of both proteins in heart lysates and IPs are displayed (K and L, n=3). M through P, Duolink proximity ligation assay (PLA) staining reveals CD36-TLR4 interactions in situ. Image data were analyzed for the total number of PLA signals per 30-μm2 region of interest (ROI). Representative images and their quantification are displayed (M–P, n=4; scale bar, 10 µm). Data are represented as mean±SEM; exact P values were indicated in each figure.
Figure 6.
Figure 6.
Vacuolar-type H+-ATPase (v-ATPase) activation by lysine/leucine/arginine (KLR) and nicotinamide mononucleotide (NMN) supplementation lowers lipid-induced cardiac inflammation. A through L, In vivo inflammatory parameters were assessed in heart tissue from rats/mice. The workflows of the animal experiments are shown in Figures 1 and 2. Experimental groups are (1) rats on 18-wk low-fat diet (LFD; 10 en% fat), rats on 18-wk high-fat diet (HFD; 60 en% fat), rats on HFD with Lys/Leu/Arg supplementation (7/12/10 mmol/L) for last 6 wk (HFD/KLR), and rats on HFD/KLR with rapamycin (HFD/KLR/Rap) or bafilomycin A1 supplementation (HFD/KLR/BafA); (2) wt-mice on 18 wk normal diet (ND), wt-mice on 18-wk HFD (60 en% fat), and wt-mice on HFD with NMN for 18 wk (HFD/NMN); (3) V1G1flox/- littermates (V1G1-LM) on HFD/NMN and V1G1-mHet mice on HFD/NMN; and (4) V0d2flox/flox LM (V0d2-LM) on HFD/NMN and V0d2-mHom mice on HFD/NMN. A through D, Assessment of MyD88-induced inflammatory signaling actions in heart tissues using Western blotting and subsequent quantification (A and B, n=4; C and D, n=6). On display are representative blots of MyD88, p-p38, total p38, p-ERK, total ERK, p-NFκB-p65 (p-p65), NF-κB-p65 (p65), and HSP90 (as loading control). E through H, mRNA expression levels of proinflammatory cytokines, including TNF-α, IFN-γ, IL-1β, IL-6, and IL-18 in heart tissue (E, n=10; F, n=6; and G and H, n=7). I through L, Gene Set Enrichment Analysis (GSEA) of the RNA sequencing (RNA-seq) data from heart tissues were shown in normalized enrichment score (NES), and the heatmap showed expressions of genes associated with inflammation (I–L, n=3). M through P, In vitro effects of TLR4 (Toll-like receptor 4) inhibitor on inflammatory signaling actions and contractile function in lipid-overloaded cardiomyocytes. M through O, HL-1 cells were cultured for 24 h under the following conditions: high palmitate (HP, 500-μM palmitate complexed to 67-µmol/L BSA, palmitate/BSA ratio 6:1) and HP supplemented with 100-nmol/L TAK-242 (the specific TLR4 inhibitor, HP/TAK242). Directly after the culturing, cells were used for assessing TLR4-mediated inflammatory signaling actions in heart tissues using Western blotting (M, representative blots and its quantifications of TLR4, p-ERK, total ERK, p-NFκB-p65 [p-p65], NF-κB-p65 [p65], and HSP90 [as loading control]; n=3) and RT-qPCR (N, mRNA expression levels of proinflammatory cytokines, including TNF-α, IFN-γ, IL-1β, IL-6, and IL-18; O, mRNA expression levels of cardiac fibrotic markers, ANP and BNP; n=6). P, Adult rat cardiomyocytes (aRCMs) were cultured for 24 h under the following conditions: high palmitate (HP, 200-μM palmitate complexed to 67-µmol/L bovine serum albumin [BSA], palmitate/BSA ratio 3:1) and HP supplemented with 100-nmol/L TAK-242 (HP/TAK242). Directly after the culturing, cells were video-imaged during 1-Hz electrostimulation for the assessment of contractile parameters (eg, sarcomere shortening). n=3; imaging of 10 cells per condition. Data are represented as mean±SEM; exact P values were indicated in each figure.
Figure 7.
Figure 7.
Vacuolar-type H+-ATPase (v-ATPase) activation by lysine/leucine/arginine (KLR) and nicotinamide mononucleotide (NMN) supplementation improves energy expenditure and insulin sensitivity. A through C, Assessment of basal indirect calorimetry in mice from different experimental groups during light and dark periods. Experimental animal groups are (1) wt-mice on 18-wk normal diet (ND), wt-mice on 18-wk high-fat diet (HFD; 60 en% fat), and wt-mice on HFD with NMN for 18 wk (HFD/NMN); (2) V0d2flox/flox littermates (V0d2-LM) on HFD/NMN and V0d2-mHom mice on HFD/NMN; and (3) V1G1flox/- LM (V1G1-LM) on HFD/NMN and V1G1-mHet mice on HFD/NMN. The workflows of the animal experiments are shown in Figure 2. For each of the indirect calorimetry parameters (carbon dioxide generation [VCO2], oxygen consumption [VO2], and respiratory exchange ratio [RER]), the temporal changes over the day and the 24-h means are on display (A, n=8 for ND and n=7 for HFD and HFD/NMN; B, n=10; and C, n=8). D through K, Assessment of in vivo insulin sensitivity. Additional experimental animal groups are (D and E): rats on 18-wk low-fat diet (LFD; 10 en% fat), rats on 18-wk high-fat diet (HFD; 60 en% fat), rats on HFD with Lys/Leu/Arg supplementation (7/12/10 mmol/L) for last 6 wk (HFD/KLR), and rats on HFD/KLR with rapamycin (HFD/KLR/Rap) or bafilomycin A1 supplementation (HFD/KLR/BafA). D, F, H, and J, Glucose tolerance test (GTT) and its area under the curve (AUC; D and F, n=7; H, n=12 for V0d2-LM and n=8 for V0d2-mHom; and J, n=9 for V1G1-LM and n=7 for V1G1-mHet). E, G, I, and K, Insulin tolerance test (ITT) and its AUC (D and F, n=7; H, n=12 for V0d2-LM and n=8 for V0d2-mHom; and J, n=9 for V1G1-LM and n=7 for V1G1-mHet). Data are represented as mean±SEM; exact P values were indicated in each figure.
Figure 8.
Figure 8.
Vacuolar-type H+-ATPase (v-ATPase) activation by lysine/leucine/arginine (KLR) and nicotinamide mononucleotide (NMN) supplementation ameliorates lipid-induced cardiac fibrosis and dysfunction. A through D, Assessment of histopathologic changes in heart tissue from rats/mice from different experimental groups: (1) rats on 18-wk low-fat diet (LFD; 10 en% fat), rats on 18-wk high-fat diet (HFD; 60 en% fat), rats on HFD with Lys/Leu/Arg supplementation (7/12/10 mmol/L) for last 6 wk (HFD/KLR), and rats on HFD/KLR with rapamycin (HFD/KLR/Rap) or bafilomycin A1 supplementation (HFD/KLR/BafA); (2) wt-mice on 18-wk normal diet (ND), wt-mice on 18-wk HFD (60 en% fat), and wt-mice on HFD with NMN for 18 wk (HFD/NMN); (3) V0d2flox/flox littermates (V0d2-LM) on HFD/NMN and V0d2-mHom mice on HFD/NMN; and (4) V1G1flox/- LM (V1G1-LM) on HFD/NMN and V1G1-mHet mice on HFD/NMN. The work flows of the animal experiments are shown in Figures 1 and 2. Histopathologic changes were evaluated by Hematoxylin and Eosin (H&E; scale bar, 100 µm), Periodic Acid-Schiff (PAS; scale bar, 50 µm), and Masson Trichrome staining (scale bar, 50 µm). Quantifications of surface areas from heart cross-sections (H&E staining; A, n=6; B–D, n=5) and fibrosis areas from PAS staining and Masson Trichrome staining (A–D, n=5). E through H, Relative mRNA expression levels of cardiac fibrotic markers including ANP (atrial natriuretic peptide) and BNP (brain natriuretic peptide) in heart tissues (E, n=9; F–H, n=6). Other cardiac fibrotic markers are displayed in Figure S16. I through L, Cardiac function was evaluated by echocardiography. On display are representative images for measurement of systolic parameters: left ventricular ejection fraction (LVEF), left ventricular fractional shortening (LVFS), and measurement of diastolic parameters: ratio between early (E) and late (atrial: A) ventricular filling velocity (E/A ratio) and isovolumic relaxation time (IVRT; I, n=7; J, n=8 for systolic parameters and n=7 for diastolic parameters; K, n=7; and L, n=8). Other in vivo echocardiographic parameters are displayed in Figure S18. Data are represented as mean±SEM; exact P values were indicated in each figure.

Comment in

References

    1. Costantino S, Akhmedov A, Melina G, Mohammed SA, Othman A, Ambrosini S, Wijnen WJ, Sada L, Ciavarella GM, Liberale L, et al. . Obesity-induced activation of JunD promotes myocardial lipid accumulation and metabolic cardiomyopathy. Eur Heart J. 2019;40:997–1008. doi: 10.1093/eurheartj/ehy903 - PubMed
    1. Jia G, Hill MA, Sowers JR. Diabetic cardiomyopathy: an update of mechanisms contributing to this clinical entity. Circ Res. 2018;122:624–638. doi: 10.1161/CIRCRESAHA.117.311586 - PMC - PubMed
    1. Tuleta I, Frangogiannis NG. Fibrosis of the diabetic heart: clinical significance, molecular mechanisms, and therapeutic opportunities. Adv Drug Deliv Rev. 2021;176:113904. doi: 10.1016/j.addr.2021.113904 - PMC - PubMed
    1. Joseph JJ, Deedwania P, Acharya T, Aguilar D, Bhatt DL, Chyun DA, Di Palo KE, Golden SH, Sperling LS; American Heart Association Diabetes Committee of the Council on Lifestyle and Cardiometabolic Health; Council on Arteriosclerosis, Thrombosis and Vascular Biology; Council on Clinical Cardiology; and Council on Hypertension. Comprehensive management of cardiovascular risk factors for adults with type 2 diabetes: a scientific statement from the American Heart Association. Circulation. 2022;145:e722–e759. doi: 10.1161/CIR.0000000000001040 - PubMed
    1. Jia G, DeMarco VG, Sowers JR. Insulin resistance and hyperinsulinaemia in diabetic cardiomyopathy. Nat Rev Endocrinol. 2016;12:144–153. doi: 10.1038/nrendo.2015.216 - PMC - PubMed

Publication types