. 2024 Mar 8;383(6687):1104-1111.
doi: 10.1126/science.adf7966. Epub 2024 Feb 29.

Induction of durable remission by dual immunotherapy in SHIV-infected ART-suppressed macaques

Affiliations

Induction of durable remission by dual immunotherapy in SHIV-infected ART-suppressed macaques

So-Yon Lim et al. Science. .

Abstract

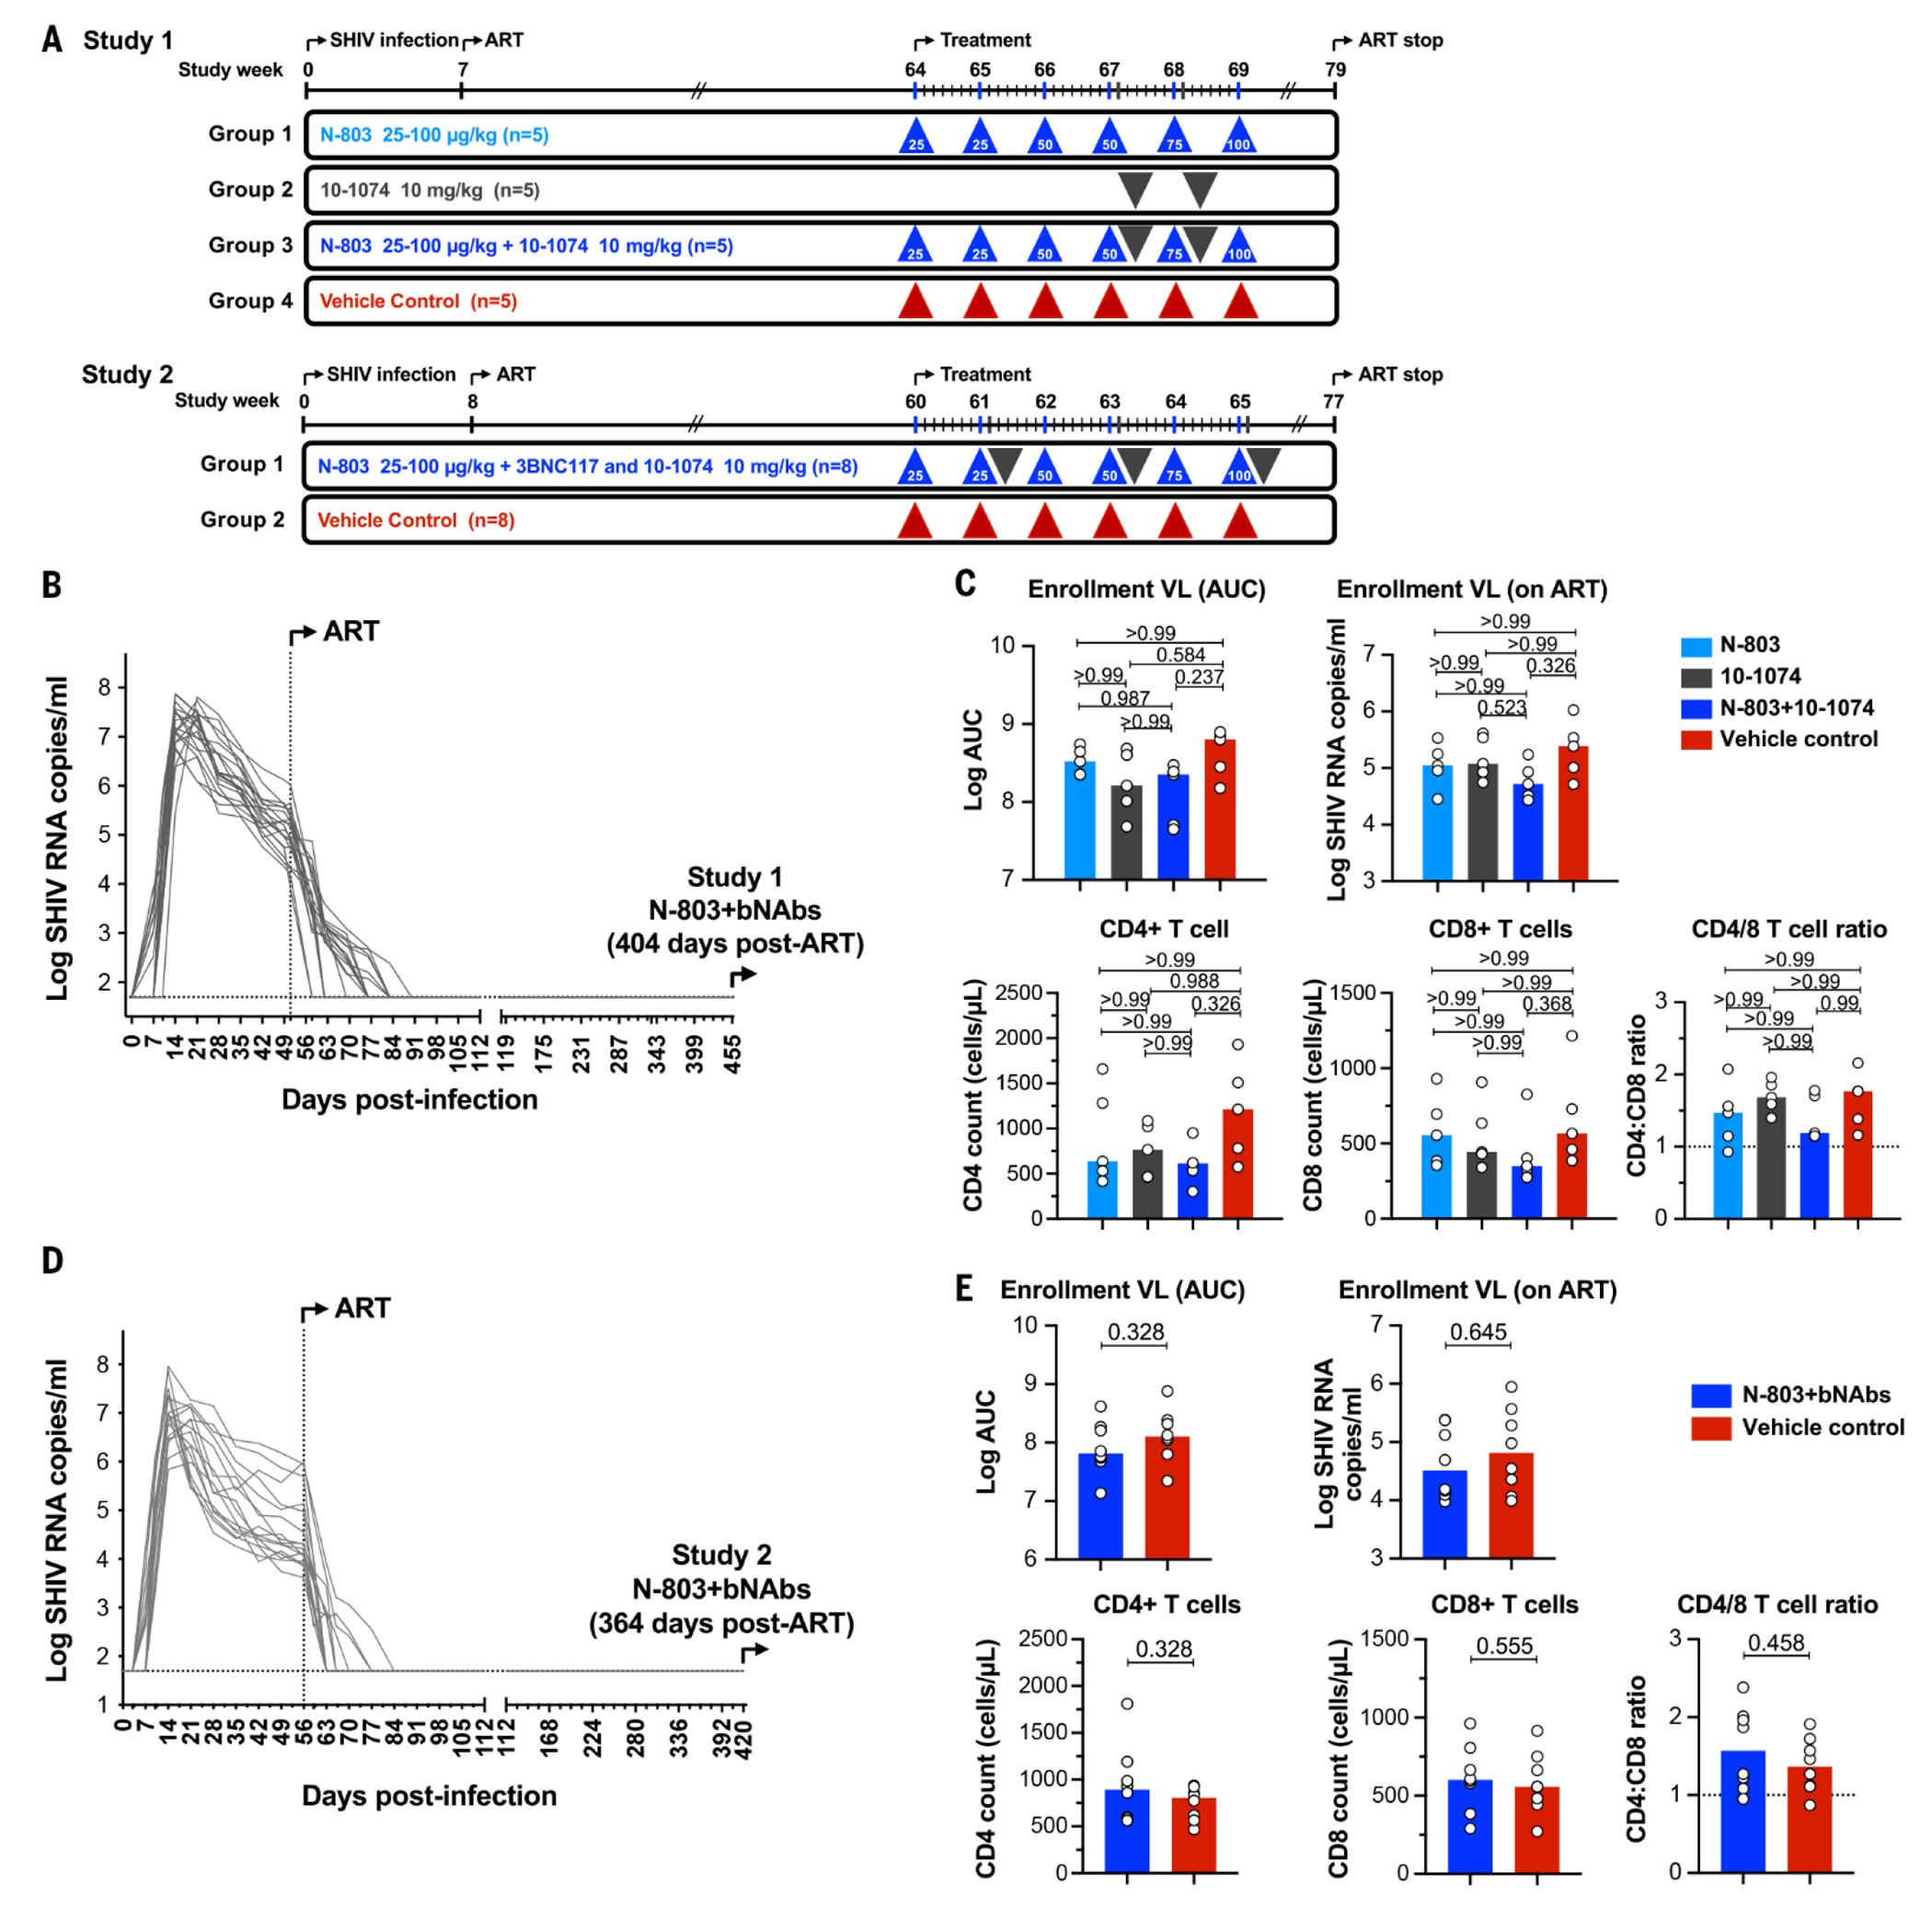
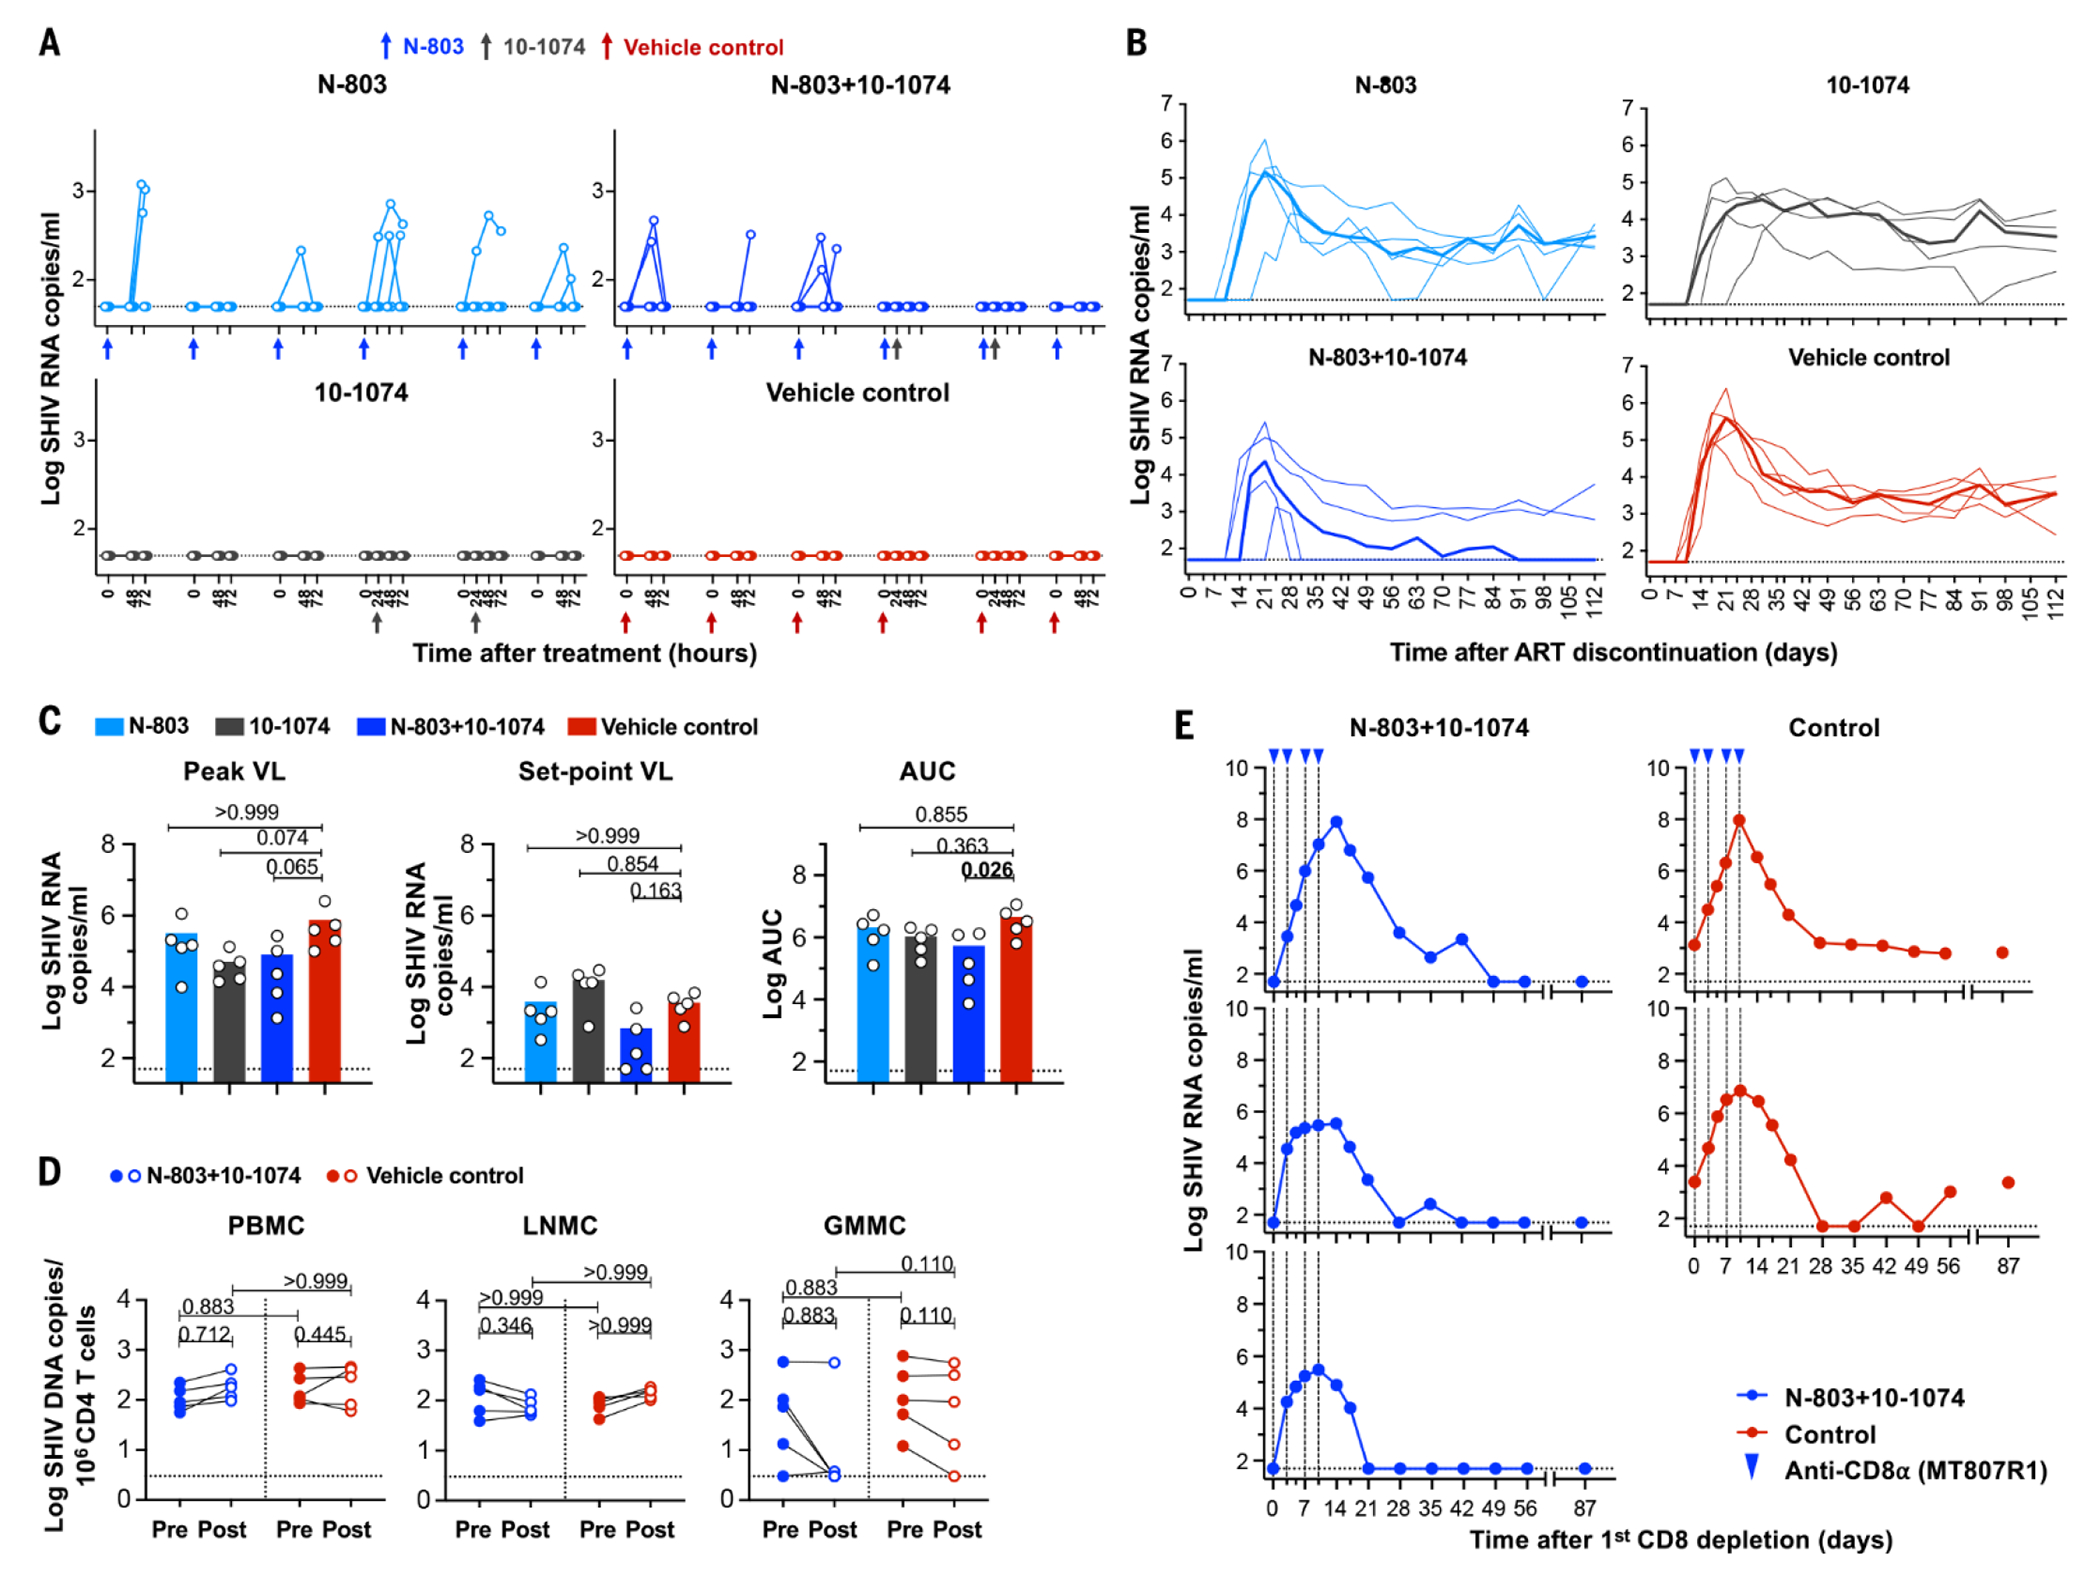
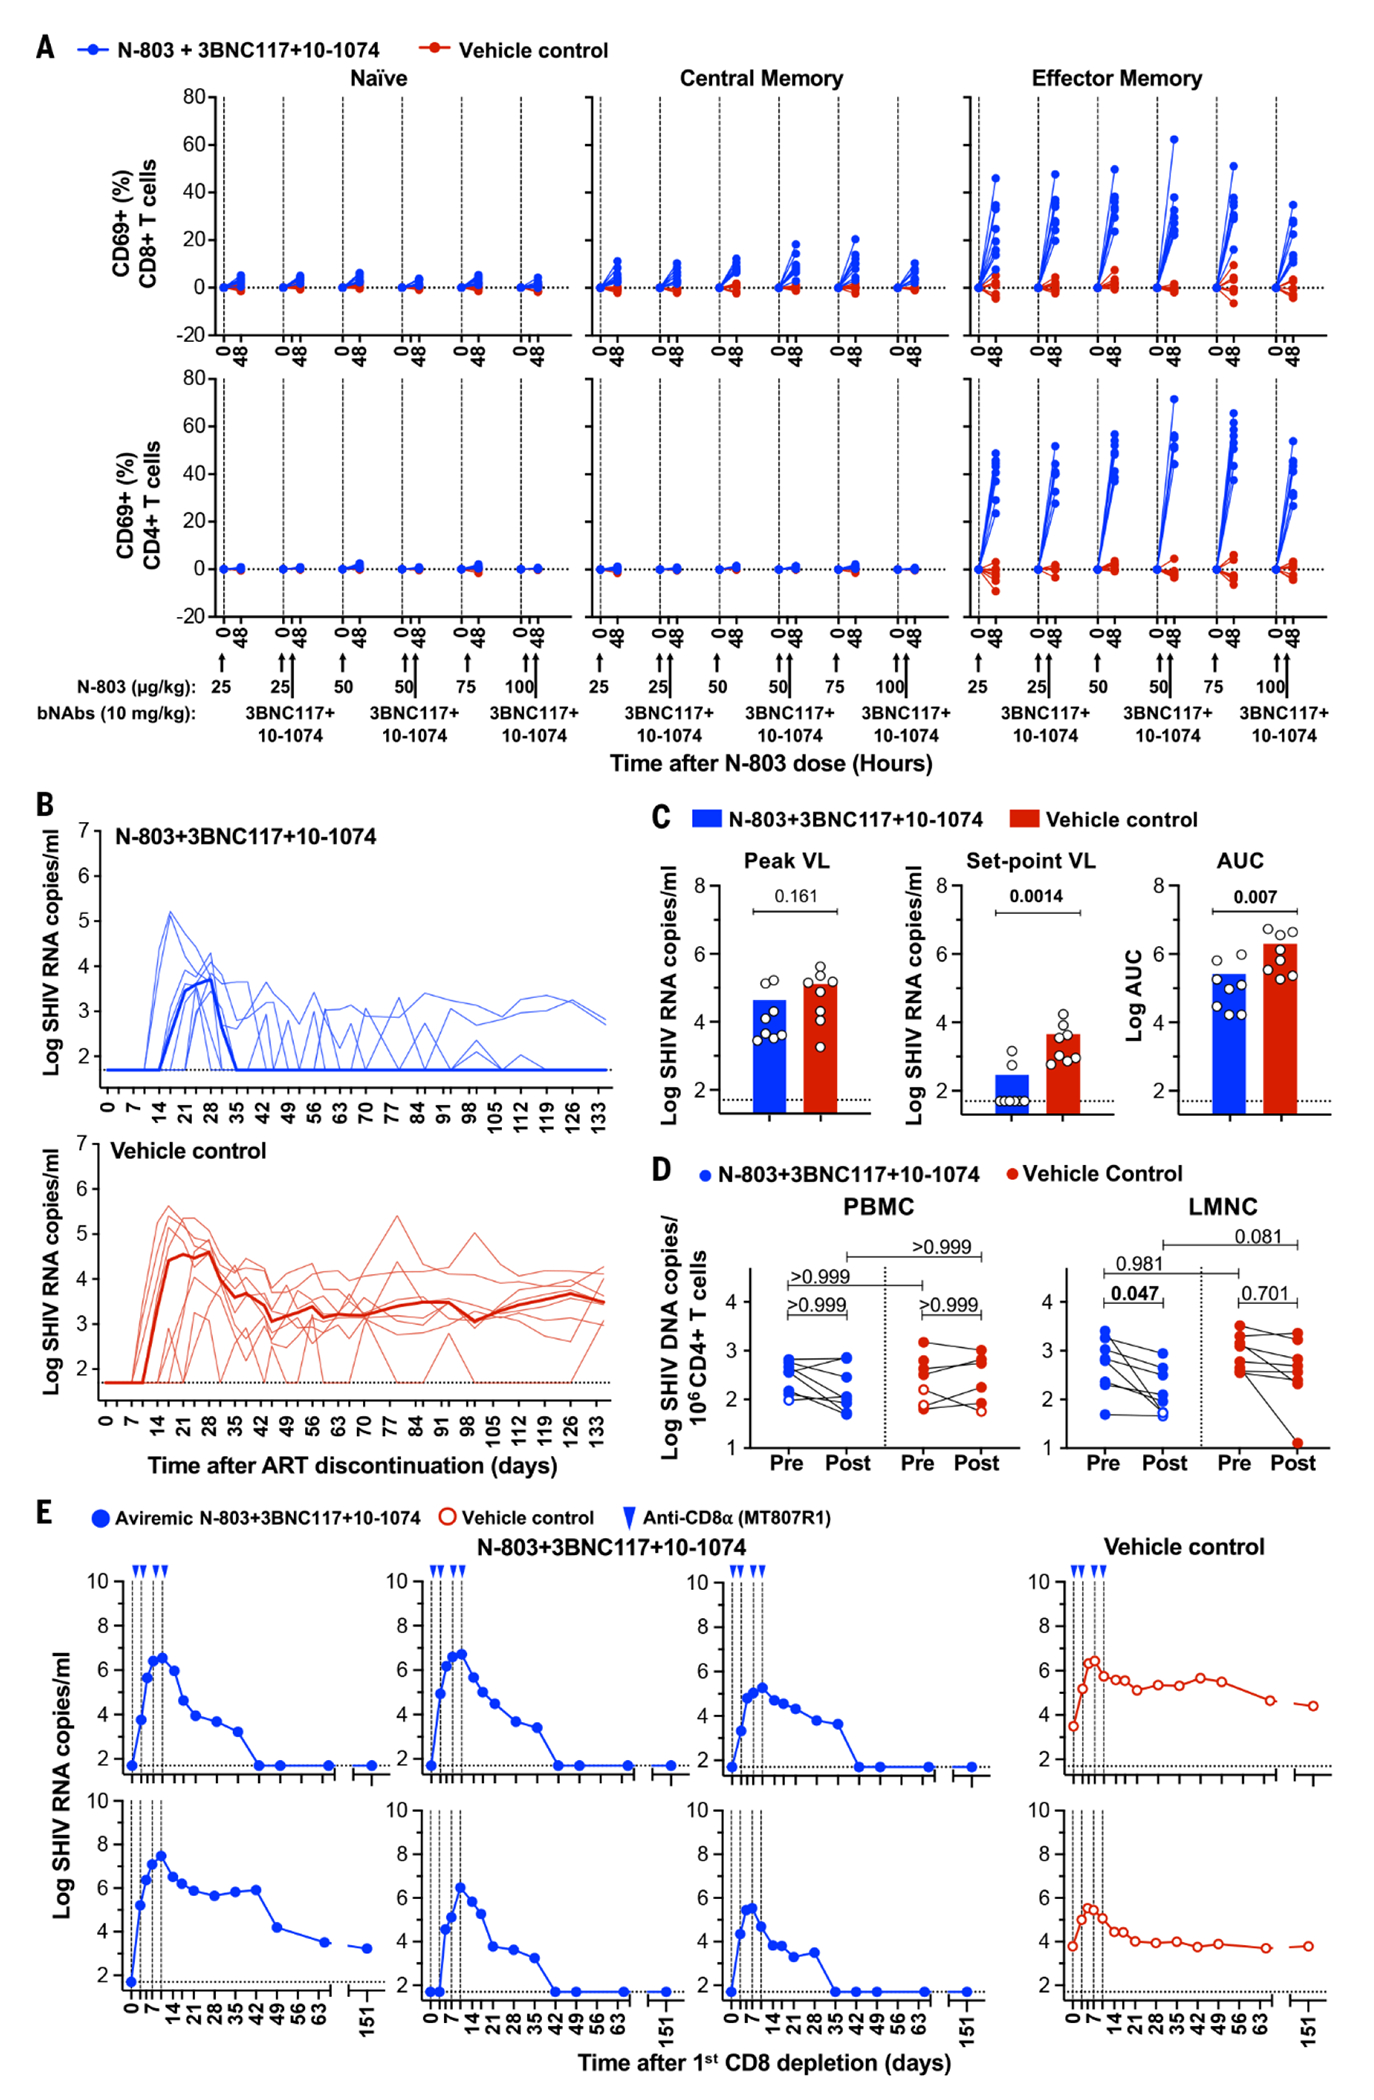
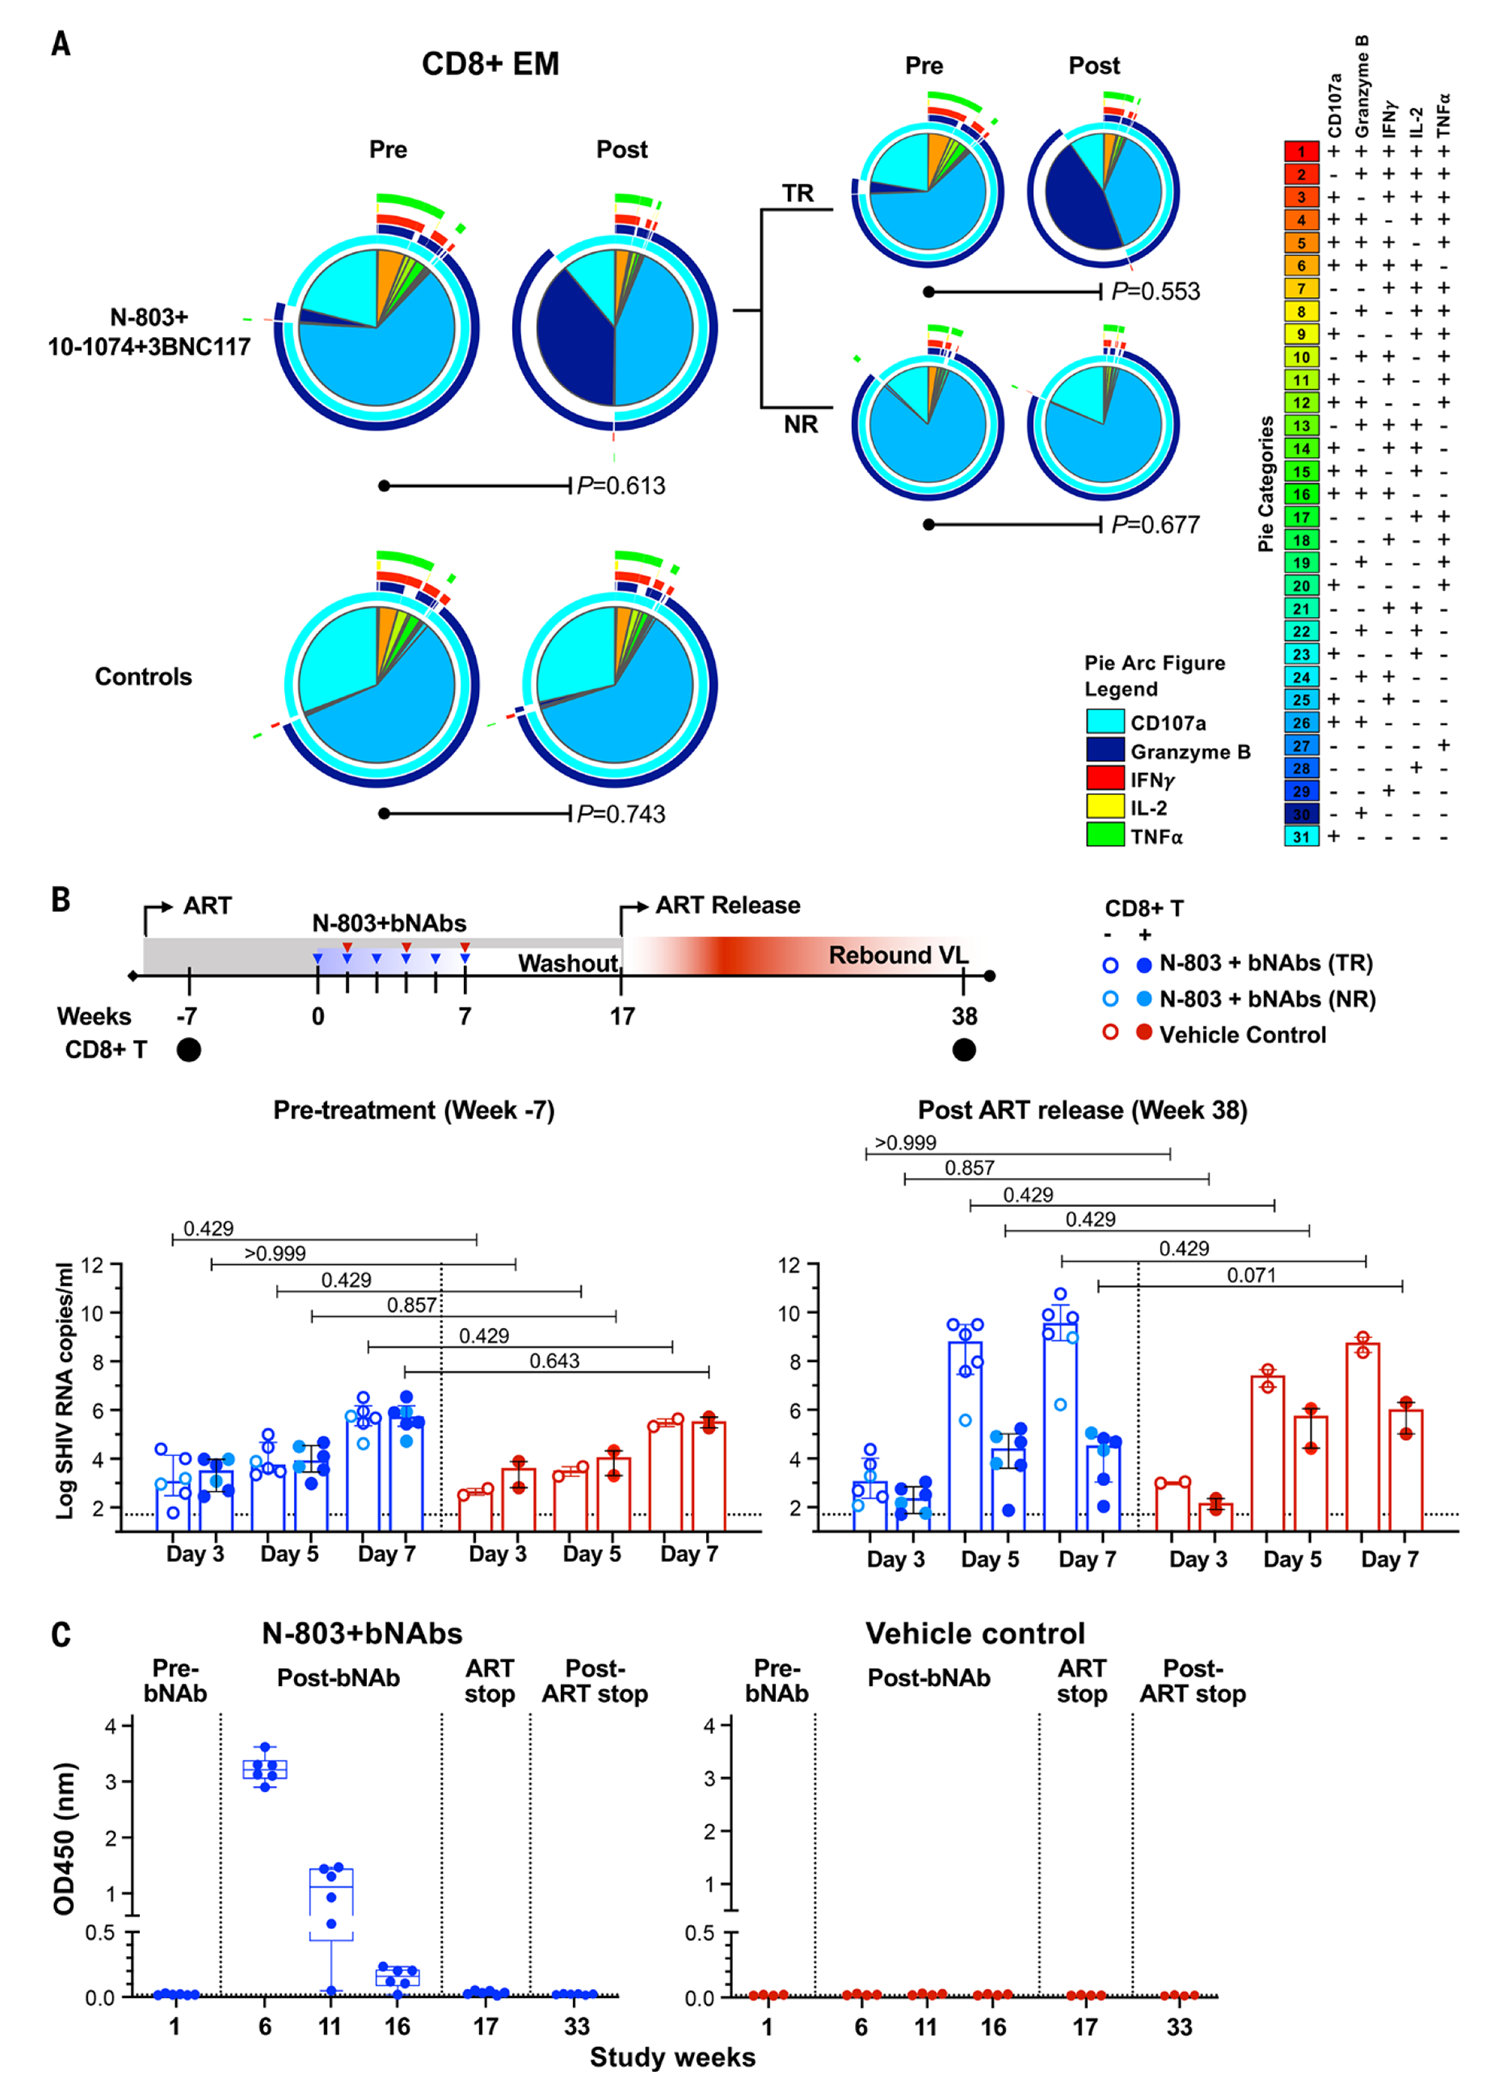
The eradication of the viral reservoir represents the major obstacle to the development of a clinical cure for established HIV-1 infection. Here, we demonstrate that the administration of N-803 (brand name Anktiva) and broadly neutralizing antibodies (bNAbs) results in sustained viral control after discontinuation of antiretroviral therapy (ART) in simian-human AD8 (SHIV-AD8)-infected, ART-suppressed rhesus macaques. N-803+bNAbs treatment induced immune activation and transient viremia but only limited reductions in the SHIV reservoir. Upon ART discontinuation, viral rebound occurred in all animals, which was followed by durable control in approximately 70% of all N-803+bNAb-treated macaques. Viral control was correlated with the reprogramming of CD8+ T cells by N-803+bNAb synergy. Thus, complete eradication of the replication-competent viral reservoir is likely not a prerequisite for the induction of sustained remission after discontinuation of ART.


Conflict of interest statement

Competing interests: J.T.S. is an employee of ImmunityBio who provided N-803 for use in this study. M.C.N. is a member of the scientific advisory boards of Celldex, Walking Fish, Apriori, and Aerium Therapeutics. M.C.N. is an inventor on a patent application (US-20170210786-A1) held by Rockefeller University that covers antibodies licensed to Gilead. J.T.S. is an inventor on a patent application (PAT.000986.CN001) held by ImmunityBio that covers HIV treatment. R.F.S. is an inventor on a patent application (PCT/US16/28822) submitted by Johns Hopkins University that covers IPDA assay licensed to Accelevir Dx.

Figures

Fig. 1.
Fig. 1.. Study schema of N-803 and bNAb dosing.
Diagrammatic overview of each study is shown. In Study 1, Groups 1, 2, and 3 (n=5 per group) received N-803 alone, 10-1074 alone, or N-803+10-1074, respectively. Group 4 (n=5) received vehicle alone as a control. N-803 was dose-escalated in Groups 1 and 3 with weekly SC administration. Two doses of 10-1074 at 10 mg per kilogram of body weight were administered IV in groups 2 and 3, 1 week apart. In Study 2, the treatment group (n=8) received N-803 in combination with 10-1074+3BNC117. N-803 was dosed at the same concentration and frequency as used in Study 1. Three doses of 10-1074+3BNC117 were administered EOW starting 24 hours after the second N-803 dose. Control group (n=8) received formulation vehicle only. (A) The schedule for SHIV-AD8 infection, ART initiation, therapeutic treatment and discontinuation of ART are shown as vertical lines (in weeks). (B) In Study 1, viral RNA was monitored in longitudinally from the day of SHIV-AD8 infection to the initiation of N-803+bNAb therapy. Twenty SHIV-infected ART-suppressed animals were then distributed into three experimental groups and one control group (n=5 per group). (C) Animals were distributed among groups by balancing virologic and immunologic metrics. Plots show the median values The comparison between groups was determined using a Kruskal–Wallis H test. P-values are adjusted for multiple comparisons. (D). In Study 2, viral RNA was monitored in RMs from the day of SHIV-AD8 infection to the initiation of N-803 and bNAb therapy. Sixteen SHIV-infected ART-suppressed RMs were then assigned to experimental and control groups (n=8 per group). (E) Animals were distributed among groups by balancing viral and immunologic parameters. Plots show the median with all values. Comparisons between groups were determined using a Mann–Whitney U test.
Fig. 2.
Fig. 2.. Viral and immune modulation following N-803+bNAb treatment.
(A) Transient plasma viremia induced by N-803 in SHIV-infected monkeys on ART. SHIV RNA copies were monitored in RMs at baseline, 48, and 72 hours following each of six weekly N-803 doses in all treatment and control groups. Arrows indicate the timing of both N-803 and bNAb dosing. ART was discontinued after complete washout of 10-1074 in each group. (B) Plasma log viral RNA copies were assessed on days 0, 3, 7, 10, and 14 and then weekly until 112 days following ART discontinuation. Median values are indicated as bold lines. (C) Viral RNA levels at the time of peak, set point and total viral burden calculated as AUC are shown. Statistical comparisons between groups were assessed using a Mann–Whitney U test. (D) Change in integrated SHIV DNA in CD4+ T cells following N-803+10-1074 treatment: integrated SHIV DNA is expressed as log10 copies per 106 CD4+ T cells at pre- and post-treatment timepoints (before ART discontinuation). Differences in integrated viral DNA at the time of pre- and post-treatment between groups was compared using a Kruskal–Wallis H test and changes in viral DNA in each group post treatment was compared to pre-treatment using a Wilcoxon matched-pairs signed-rank test. P-values were adjusted for multiple comparison by Dunn’s test. (E) CD8+ lymphocytes were depleted in vivo using the MT807R19 antibody. Doses were delivered to RMs that received N-803+10-1074 or two controls RMs, as indicated by blue triangles. Viral RNA was monitored longitudinally after anti-CD8α depletion.
Fig. 3.
Fig. 3.. Viral and immune modulation following ART discontinuation and CD8+ lymphocyte depletion.
The activation of T cells following N-803+10-1074 administration: Activation of naïve (CD95CD28+), central memory (CD95+CD28+), and effector memory (CD95+CD28) populations from CD8+ and CD4+ T cells was monitored by flow cytometry–based measurement of CD69. (A) CD69 expression within each subset was measured at the time of each dose (baseline) at 48 hours post each N-803 dose. Changes in CD69 expression are shown as the absolute difference in percent from the day of dose for all immune subsets. N-803 and 10-1074 dosing are indicated by black arrows on the x-axis. (B) Viral rebound following ART discontinuation after bNAb washout. Median values are indicated as bold lines. (C) Viral RNA levels at the time of peak, set point and AUC are shown. Statistical comparisons between groups were assessed using a Mann–Whitney U test. (D) Intact SHIV DNA in CD4+ T cells prior to and after treatment with N-803+bNAbs. Intact SHIV DNA by IPDA is expressed as log10 copies per sorted 106 CD4+ T cells. The results are shown as the mean of intact SHIV genomes per 106 CD4+ T cells calculated from three replicates, corrected for 2LTR circles and DNA shearing (filled symbols). Open symbols represent the limit of detection for samples in which no positive events were detected across three replicates, based on the number of cell equivalents assayed. Differences in intact viral DNA between groups at the time of pre- and post-treatment were compared using a Kruskal–Wallis H test and intact DNA at post-treatment were compared to pre-treatment using a Wilcoxon matched-pairs signed-rank test. P-values were adjusted for multiple comparison by Dunn’s test. (E) In vivo CD8+ lymphocyte depletion. CD8+ lymphocytes were depleted in vivo using monoclonal antibody MT807R1 in two control animals and all six treated remission RMs. The presence of CD8α+ lymphocytes in the blood was monitored by flow cytometry. Log viral RNA was assessed at the intervals indicated.
Fig. 4.
Fig. 4.. Modified CD8+ T cell effector function and bNAb-antigen binding.
(A) Polyfunctional CD8+ T cell responses to SIVmac239 Gag peptides were measured by intracellular cytokine staining for CD107a, granzyme B, IFNγ, IL-2, and TNFα. The pie charts show the mean frequency of cells with different combinations of effector functions. Eight animals in N-803 treated group were then divided into treated-responder (TR, n=6) and treated non-responder (NR, n=2). P-values were computed using a permutation test described in Materials and Methods. (B) Ex vivo SHIV suppression assay to evaluate virus specific CD8+ T cell responses. Shown are viral replication in CD4+ T cells cultured alone or in the presence of autologous CD8+ T cells isolated from N-803+bNAb-treated animals that remained viremic or became viremic and control group. CD8+ T cells were isolated prior to treatment (Week −7) and 149 days after ART release. SHIV RNA copies in culture supernatant between CD4+ alone or with CD8+ T cells was measured by real-time PCR on days 3, 5, and 7 post culture. Statistical significance in differences in SHIV RNA with or without CD8+T cells was determined using a Kruskal–Wallis H test with Dunn’s post-test for multiple comparison. (C) Binding antibodies to BG505 SOSIP.664-His-gp140 protein were evaluated using samples isolated from treated (n=6) and control (n=4) RMs at pre-treatment (24 hours before the first bNAb dose), after bNAbs infusions (1, 5, and 11 weeks after the third N803 dose), ART discontinuation, and 16 weeks after ART discontinuation. Antibodies to BG505 SOSIP.664 trimer (1:100 diluted) at each representative time point are shown. The lower limit of detection is indicated as a hatched line. Box-and-whisker plot with all data points are shown. The binding of two bNAbs used in the study, 3BNC117 and 10-1074 to BG505 SOSIP.664-His-gp140 was tested. The average values and standard deviation of the mean from three separate experiments are shown.

References

    1. Finzi D, Blankson J, Siliciano JD, Margolick JB, Chadwick K, Pierson T, Smith K, Lisziewicz J, Lori F, Flexner C, Quinn TC, Chaisson RE, Rosenberg E, Walker B, Gange S, Gallant J, Siliciano RF, Latent infection of CD4+ T cells provides a mechanism for lifelong persistence of HIV-1, even in patients on effective combination therapy. Nat. Med 5, 512–517 (1999). doi:10.1038/8394 - DOI - PubMed
    1. Zhang L, Ramratnam B, Tenner-Racz K, He Y, Vesanen M, Lewin S, Talal A, Racz P, Perelson AS, Korber BT, Markowitz M, Ho DD, Quantifying residual HIV-1 replication in patients receiving combination antiretroviral therapy. N. Engl. J. Med 340, 1605–1613 (1999). doi:10.1056/NEJM199905273402101 - DOI - PubMed
    1. Chun TW, Davey RT Jr., Engel D, Lane HC, Fauci AS, Re-emergence of HIV after stopping therapy. Nature 401, 874–875 (1999). doi:10.1038/44755 - DOI - PubMed
    1. Chun TW, Carruth L, Finzi D, Shen X, DiGiuseppe JA, Taylor H, Hermankova M, Chadwick K, Margolick J, Quinn TC, Kuo Y-H, Brookmeyer R, Zeiger MA, Barditch-Crovo P, Siliciano RF, Quantification of latent tissue reservoirs and total body viral load in HIV-1 infection. Nature 387, 183–188 (1997). doi:10.in38/387183an - DOI - PubMed
    1. Chun TW, Stuyver L, Mizell SB, Ehler LA, Mican JAM, Baseler M, Lloyd AL, Nowak MA, Fauci AS, Presence of an inducible HIV-1 latent reservoir during highly active antiretroviral therapy. Proc. Natl. Acad. Sci. U.S.A. 94,13193–13197 (1997). doi:10.1073/pnas.94.24.13193 - DOI - PMC - PubMed

Publication types

MeSH terms