

A whole-brain neuromark resting-state fMRI analysis of first-episode and early psychosis: Evidence of aberrant cortical-subcortical-cerebellar functional circuitry
- PMID: 38422833
- PMCID: PMC10944191
- DOI: 10.1016/j.nicl.2024.103584
A whole-brain neuromark resting-state fMRI analysis of first-episode and early psychosis: Evidence of aberrant cortical-subcortical-cerebellar functional circuitry
Abstract
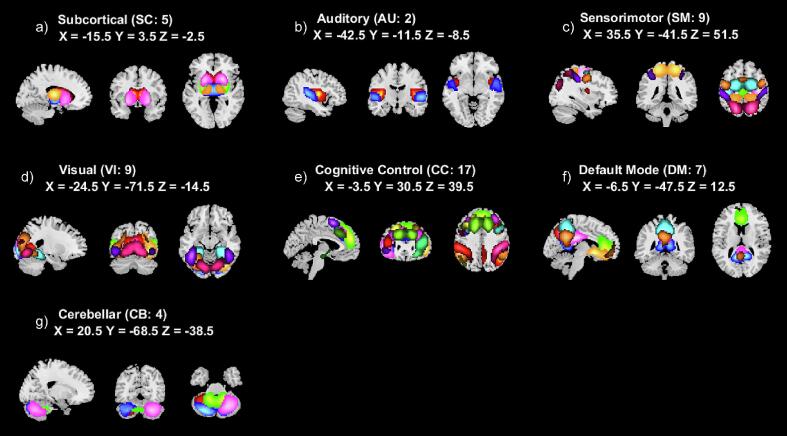
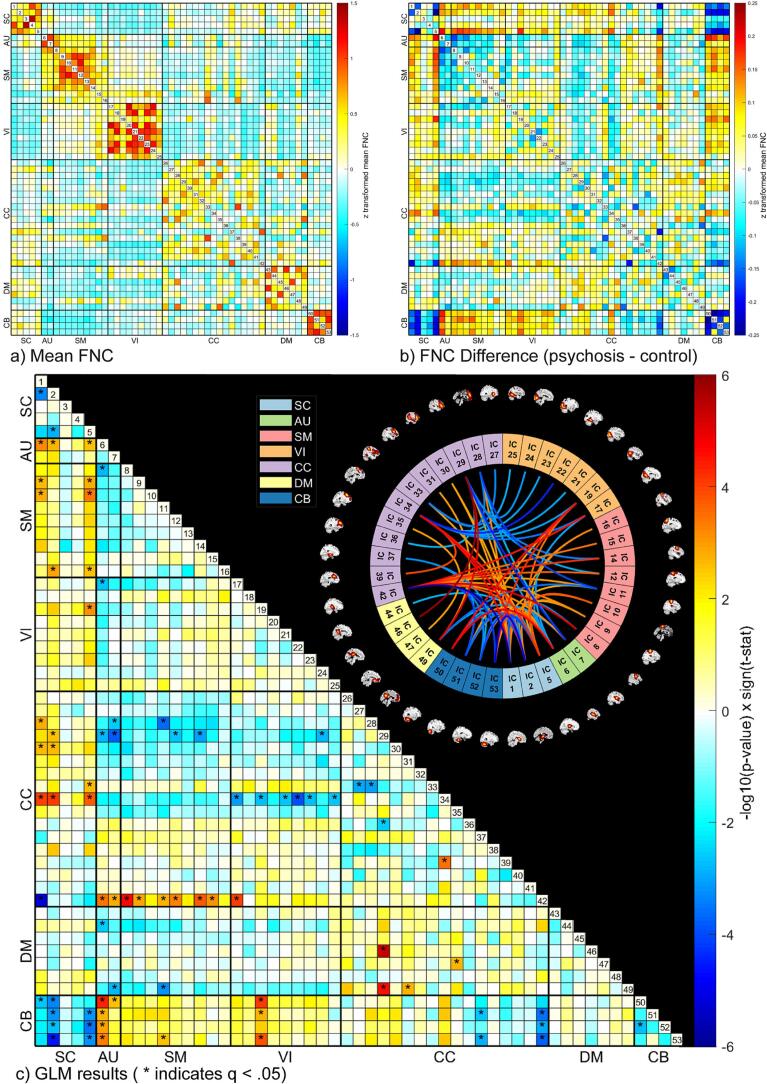
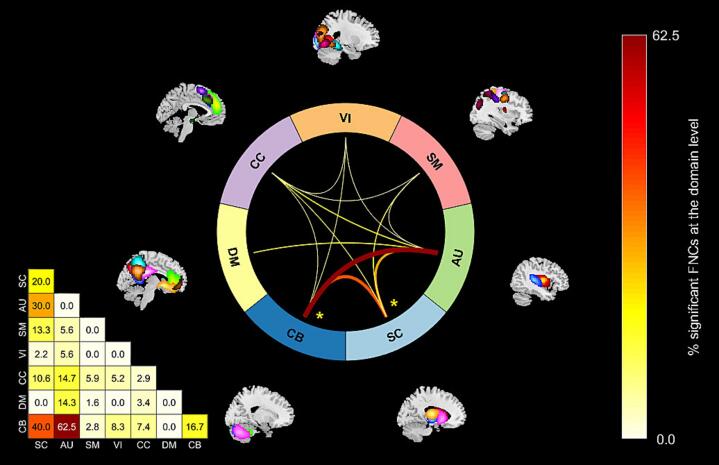
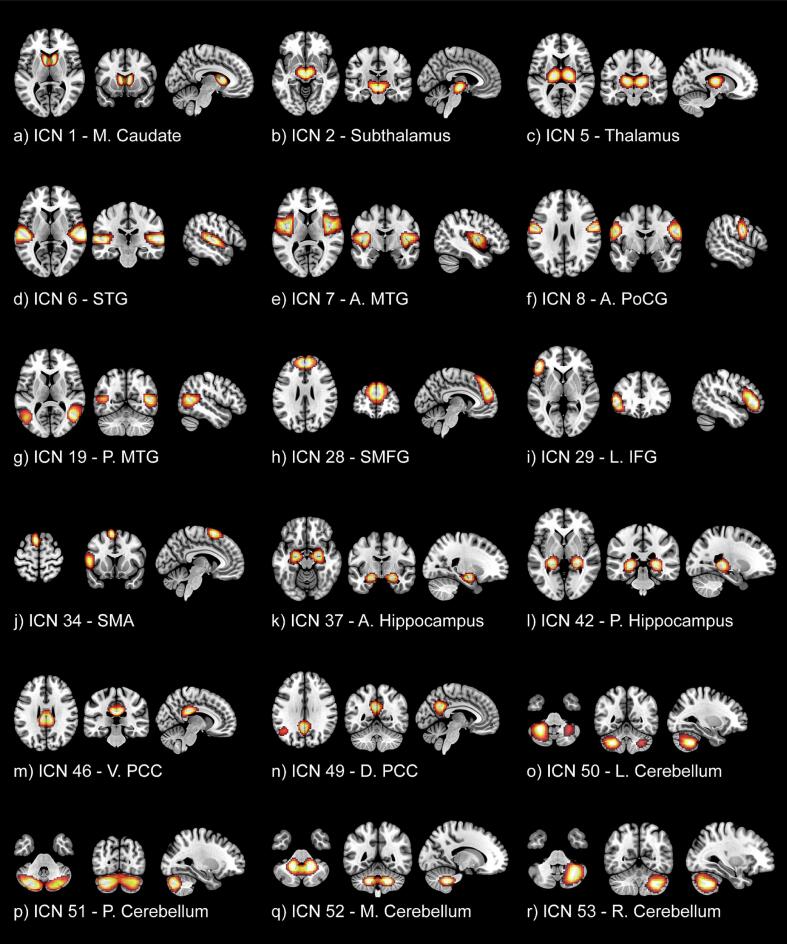
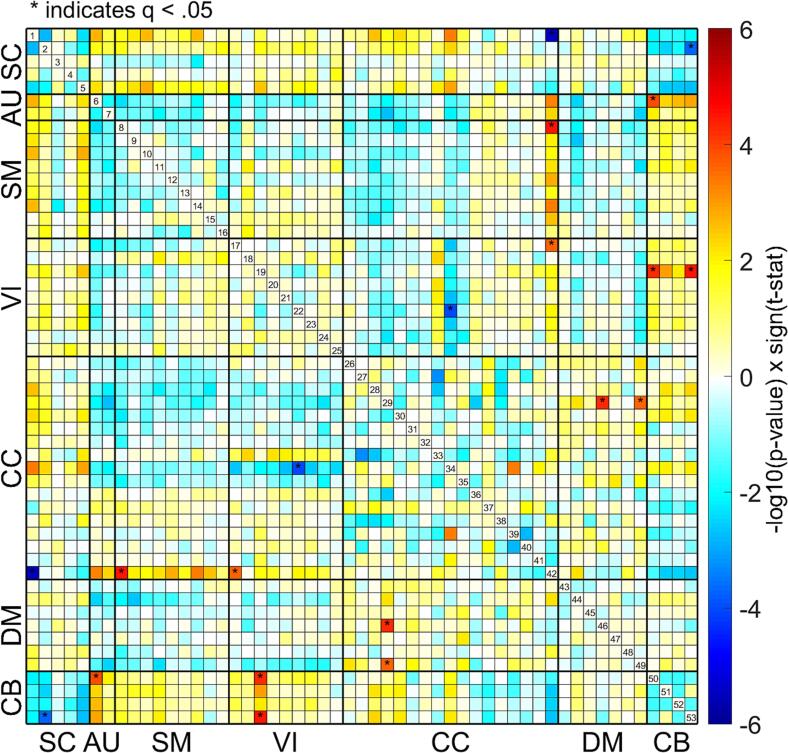
Psychosis (including symptoms of delusions, hallucinations, and disorganized conduct/speech) is a main feature of schizophrenia and is frequently present in other major psychiatric illnesses. Studies in individuals with first-episode (FEP) and early psychosis (EP) have the potential to interpret aberrant connectivity associated with psychosis during a period with minimal influence from medication and other confounds. The current study uses a data-driven whole-brain approach to examine patterns of aberrant functional network connectivity (FNC) in a multi-site dataset comprising resting-state functional magnetic resonance images (rs-fMRI) from 117 individuals with FEP or EP and 130 individuals without a psychiatric disorder, as controls. Accounting for age, sex, race, head motion, and multiple imaging sites, differences in FNC were identified between psychosis and control participants in cortical (namely the inferior frontal gyrus, superior medial frontal gyrus, postcentral gyrus, supplementary motor area, posterior cingulate cortex, and superior and middle temporal gyri), subcortical (the caudate, thalamus, subthalamus, and hippocampus), and cerebellar regions. The prominent pattern of reduced cerebellar connectivity in psychosis is especially noteworthy, as most studies focus on cortical and subcortical regions, neglecting the cerebellum. The dysconnectivity reported here may indicate disruptions in cortical-subcortical-cerebellar circuitry involved in rudimentary cognitive functions which may serve as reliable correlates of psychosis.
Keywords: Early psychosis (EP); First-episode psychosis (FEP); Functional network connectivity (FNC); Independent component analysis (ICA); Resting-state fMRI; Schizophrenia.
Copyright © 2024. Published by Elsevier Inc.
Conflict of interest statement
Declaration of competing interest The authors declare that they have no known competing financial interests or personal relationships that could have appeared to influence the work reported in this paper.
Figures
Similar articles
-
Auditory hallucinations across the psychosis spectrum: Evidence of dysconnectivity involving cerebellar and temporal lobe regions.Neuroimage Clin. 2021;32:102893. doi: 10.1016/j.nicl.2021.102893. Epub 2021 Nov 24. Neuroimage Clin. 2021. PMID: 34911197 Free PMC article.
-
Whole-Brain Functional Network Connectivity Abnormalities in Affective and Non-Affective Early Phase Psychosis.Front Neurosci. 2021 Jun 18;15:682110. doi: 10.3389/fnins.2021.682110. eCollection 2021. Front Neurosci. 2021. PMID: 34220438 Free PMC article.
-
Altered intrinsic cerebellar-cerebral functional connectivity is related to negative symptoms in patients with first-episode psychosis.Schizophr Res. 2023 Feb;252:56-63. doi: 10.1016/j.schres.2022.12.041. Epub 2023 Jan 9. Schizophr Res. 2023. PMID: 36628869
-
[Brain imaging of first-episode psychosis].Encephale. 2013 Sep;39 Suppl 2:S93-8. doi: 10.1016/S0013-7006(13)70102-7. Encephale. 2013. PMID: 24084428 Review. French.
-
Functional connectivity of the striatum in psychosis: Meta-analysis of functional magnetic resonance imaging studies and replication on an independent sample.Neurosci Biobehav Rev. 2025 Jul;174:106179. doi: 10.1016/j.neubiorev.2025.106179. Epub 2025 Apr 25. Neurosci Biobehav Rev. 2025. PMID: 40288705 Review.
Cited by
-
Transdiagnostic markers across the psychosis continuum: a systematic review and meta-analysis of resting state fMRI studies.Front Psychiatry. 2024 Jun 4;15:1378439. doi: 10.3389/fpsyt.2024.1378439. eCollection 2024. Front Psychiatry. 2024. PMID: 38895037 Free PMC article.
-
Identifying neurobiological heterogeneity in clinical high-risk psychosis: a data-driven biotyping approach using resting-state functional connectivity.Schizophrenia (Heidelb). 2025 Feb 4;11(1):13. doi: 10.1038/s41537-025-00565-6. Schizophrenia (Heidelb). 2025. PMID: 39905003 Free PMC article.
-
Mapping the Psychosis Spectrum - Imaging Neurosubtypes from Multi-Scale Functional Network Connectivity.bioRxiv [Preprint]. 2025 Mar 28:2025.02.11.637551. doi: 10.1101/2025.02.11.637551. bioRxiv. 2025. PMID: 40196606 Free PMC article. Preprint.
-
Toward Granular Brain Intrinsic Connectivity Networks and Insights into Schizophrenia.bioRxiv [Preprint]. 2025 Jun 11:2025.06.11.659084. doi: 10.1101/2025.06.11.659084. bioRxiv. 2025. PMID: 40661581 Free PMC article. Preprint.
-
Causal Central Network Remodeling in Diabetic Neuropathy: An Integrated MR-fMRI Study.Diabetes Metab Syndr Obes. 2025 Aug 9;18:2753-2765. doi: 10.2147/DMSO.S525219. eCollection 2025. Diabetes Metab Syndr Obes. 2025. PMID: 40808862 Free PMC article.
References
-
- Adhan I., Lizano P., Bannai D., Lutz O., Dhaliwal K., Zeng V., Miewald J., Montrose D., Keshavan M. Visual cortical alterations and their association with negative symptoms in antipsychotic-naïve first episode psychosis. Psychiatry Res. 2020;288 doi: 10.1016/j.psychres.2020.112957. - DOI - PMC - PubMed
-
- Alonso-Solís A., Corripio I., de Castro-Manglano P., Duran-Sindreu S., Garcia-Garcia M., Proal E., Nuñez-Marín F., Soutullo C., Alvarez E., Gómez-Ansón B., Kelly C., Castellanos F.X. Altered default network resting state functional connectivity in patients with a first episode of psychosis. Schizophr. Res. 2012;139(1–3):13–18. doi: 10.1016/j.schres.2012.05.005. - DOI - PMC - PubMed
-
- Andreasen N.C. The University of Iowa; Iowa City, Iowa: 1983. The Scale for the Assessment of Negative Symptoms (SANS)
MeSH terms
LinkOut - more resources
Full Text Sources
Medical
Miscellaneous
