. 2024 Mar 8;5(3):254-270.e8.
doi: 10.1016/j.medj.2024.02.002. Epub 2024 Feb 28.

Sensory nerve release of CGRP increases tumor growth in HNSCC by suppressing TILs

Affiliations

Sensory nerve release of CGRP increases tumor growth in HNSCC by suppressing TILs

Laurel B Darragh et al. Med. .

Abstract

Background: Perineural invasion (PNI) and nerve density within the tumor microenvironment (TME) have long been associated with worse outcomes in head and neck squamous cell carcinoma (HNSCC). This prompted an investigation into how nerves within the tumor microenvironment affect the adaptive immune system and tumor growth.

Methods: We used RNA sequencing analysis of human tumor tissue from a recent HNSCC clinical trial, proteomics of human nerves from HNSCC patients, and syngeneic orthotopic murine models of HPV-unrelated HNSCC to investigate how sensory nerves modulate the adaptive immune system.

Findings: Calcitonin gene-related peptide (CGRP) directly inhibited CD8 T cell activity in vitro, and blocking sensory nerve function surgically, pharmacologically, or genetically increased CD8 and CD4 T cell activity in vivo.

Conclusions: Our data support sensory nerves playing a role in accelerating tumor growth by directly acting on the adaptive immune system to decrease Th1 CD4 T cells and activated CD8 T cells in the TME. These data support further investigation into the role of sensory nerves in the TME of HNSCC and points toward the possible treatment efficacy of blocking sensory nerve function or specifically inhibiting CGRP release or activity within the TME to improve outcomes.

Funding: 1R01DE028282-01, 1R01DE028529-01, 1P50CA261605-01 (to S.D.K.), 1R01CA284651-01 (to S.D.K.), and F31 DE029997 (to L.B.D.).

Keywords: CGRP; HNSCC; Preclinical research; TME; cancer; denervation; immunotherapy; radiation therapy; sensory nerves.


Conflict of interest statement

Declaration of interests S.D.K. receives clinical funding from Genentech that does not relate to this work. She receives clinical trial funding from AstraZeneca, a part of which is included in this manuscript. She also receives preclinical research funding from Roche and Amgen unrelated to this manuscript. R.W. serves in an advisory role for AstraZeneca.

Figures

Figure 1:
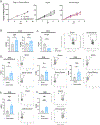
Figure 1:. Facial nerve axotomy reduces tumors growth.
A) Enrichment map displaying all responder versus nonresponder GO biological processes pathways calculated with gene set enrichment and showing NES < 0 and q < 0.05. Lines represent similarity in pathway gene membership. Select pathways chosen by manual inspection of pathways and groups in the map. B) Tree plot for top 25 pathways by q-value for select pathways chosen from panel A. Words in right column represent a 5-word word cloud of common themes in pathway titles. C) Heatmap for top 250 genes by responder vs. nonresponder p-value included in the leading edges of the select pathways in panel A. Select genes are manually annotated for commentary.NR=non-responder (n=5), R=Responder (n=8). D) Representative immunofluorescent images of nerve bundles present in both LY2 and MOC2 tumors (20x). E) BALB/c mice were implanted with 1×10^6 LY2 cells after a facial nerve axotomy (n=5) or sham surgery (n=4). F) C57BL/6 mice were implanted with 1×10^5 MOC2 cells after a facial nerve axotomy or sham surgery (n=6 facial nerve axotomy and n=5 sham surgery). G) Survival of C57BL/6 mice treated with or without a facial nerve axotomy (n=6) or sham surgery (n=5). To compare tumor growth differences a two-way analysis of variance (ANOVA) was used. Time-to-death by tumor-related symptoms was plotted using Kaplan-Meier (KM) curves and the survival difference between groups was compared using log-rank (Mantel-Cox) tests. The significance is denoted by asterisks, *p<0.05, **p<0.01, and ***p<.001. All data are reported with mean ± SEM (standard error of the mean).
Figure 2:
Figure 2:. Denervation increases T cell activation in the TME.
A) RAG−/− mice that were treated with or without a facial nerve axotomy were implanted with 1×10^5 MOC2-OVA tumor cells in the buccal. Tumor growth is shown (n=7 for both groups). B) Populations of CD4 T cells (CD3+CD4+), CD8 T cells (CD3+CD8+), and C) Tregs (CD3+CD4+Foxp3+) cells within the DLNs of mice treated with or without a facial nerve axotomy (n=5 per group). D-E) CD4 and CD8 T cells in the TME expressing activation markers in mice treated with or without a facial nerve axotomy (n=5). Differences in T cell populations was determined using an unpaired student’s t-test. The significance is denoted by asterisks, *p<0.05, **p<0.01, and ***p<.001. All data are reported with mean ± SEM (standard error of the mean).
Figure 3:
Figure 3:. Radiation improves response to denervation.
A) C57BL/6 mice were implanted with 1×10^5 MOC2-OVA cells after a facial nerve axotomy or sham surgery. Mice were subsequently treated with RT (1×10Gy) when the tumors reached ~300mm3. Tumor growth over time is shown. Survival data is shown for the four groups of mice (n=7 per group). B) Time-to-death by tumor-related symptoms was plotted using Kaplan-Meier (KM) curves and the survival difference between groups was compared using log-rank (Mantel-Cox) tests. C-G) CD4 and CD8 T cells in the TME expressing activation markers in mice treated with or without a facial nerve axotomy (n=5). Differences in T cell populations was determined by an unpaired student’s t-test. The significance is denoted by asterisks, *p<0.05, **p<0.01, and ***p<.001. All data are reported with mean ± SEM (standard error of the mean).
Figure 4:
Figure 4:. Intratumoral nerves increase pathways associated with neuropeptide synthesis.
A) Protein expression data of nerves that were harvested from within the TME (involved), within 1.5cm of the TME (adjacent), or normal (not near the tumor). B) Principal component analysis or PCA plot of involved, adjacent, and normal nerves from our proteomics analysis. C) GO pathway analysis of cluster 1 highlighting the top hits from pathways elevated in involved nerves when compared to both adjacent and normal nerves from human proteomics. D) Tumor growth curves and survival plot of C57BL/6 mice implanted with 1×10^5 MOC2 cells treated with botulinum toxin A and 1×10Gy (n=7–8 per group).
Figure 5:
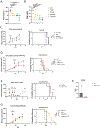
Figure 5:. CGRP increases tumor growth by inhibiting CD8 T cell cytotoxicity.
A) Dose escalation cancer cell death assay. MOC2-OVA cancer cells were co-incubated with OTI CD8 T cells and varying concentrations of CGRP (0nM, 10nM, 100nM, 1000nM, 10000nM). Cancer cell death was measured by release of fluorescent calcein into the supernatant (n=4 technical replicates). Representative experiment of three repetitions. B) ELISpot of CD8 T cell activation in the presence of varying concentrations of CGRP (0nM, 10nM, 100nM, 1000nM, 10000nM). Activation was measured by the amount of IFNγ spots detected (n=3 technical replicates). C) C57BL/6 mice implanted with 1×10^5 MOC2 cells were treated with 1×10Gy RT and CGRP receptor antagonist BIBN4096 (25pg) per intratumoral injection daily. Tumor growth and survival was monitored (n=7–8 per group. D) C57BL/6 mice and TRPV1 KO mice implanted with 1×10^5 MOC2 cells were treated with 1×10Gy RT. Tumor growth and survival were monitored (n=7–8 per group). E) C57BL/6 mice and TRPV1 KO mice implanted with 5×10^4 P029 cells were treated with 3×8Gy RT. Tumor growth and survival were monitored (n=6–7 per group). F) Quantification of serum CGRP levels in TRPV1 KO mice or WT mice treated with RT after tumor implantation on DPI 17 (n=6 per group). G) C57BL/6 mice implanted with 1×10^5 MOC2 cells were treated with 1×10Gy RT and Gabapentin (2mg) via IP injection daily. Tumor growth and survival were monitored (n=7–8 per group). To compare tumor growth differences, a one-way analysis of variance (ANOVA) was used with Tukey’s post hoc test for multiple comparisons. Time-to-death by tumor-related symptoms was plotted using Kaplan-Meier (KM) curves and the survival difference between groups was compared using log-rank (Mantel-Cox) tests. To compare cancer cell death, CD8 T cell activation and differences in CGRP in the TME an unpaired student’s t-test was used. The significance is denoted by asterisks, *p<0.05, **p<0.01, and ***p<.001. All data are reported with mean ± SEM (standard error of the mean).
Figure 6:
Figure 6:. Blocking CGRP function in the TME increases activated Th1 CD4 T cells and CD8 T cells.
A) Tumor growth curves for C57BL/6 mice or TRPV1 KO mice implanted with 1×10^5 MOC2 cells and treated with 1×10Gy. Mice were also treated with Gabapentin or the CGRP receptor antagonist BIBN4096 daily. B-C) CD4 T cells in the TME expressing activation markers (n=5 RT, n=7 Gabapentin, n=5 TRPV1 KO, n=7 BIBN4096). D) CD8 T cells in the TME and those expressing activation markers (n=5 RT, n=7 RT + Gabapentin, n=5 RT + TRPV1 KO, n=7 RT +BIBN4096). E) Cartoon of how different pharmacological inhibitors might inhibit CGRP release or activity upon release into the TME. Created using BioRender.com. Differences in T cell populations was determined by an unpaired student’s t-test. The significance is denoted by asterisks, *p<0.05, **p<0.01, and ***p<.001. All data are reported with mean ± SEM (standard error of the mean).

References

    1. Zhang Z, Liu R, Jin R, Fan Y, Li T, Shuai Y, Li X, Wang X, and Luo J (2019). Integrating Clinical and Genetic Analysis of Perineural Invasion in Head and Neck Squamous Cell Carcinoma. Front Oncol 9, 434. 10.3389/fonc.2019.00434. - DOI - PMC - PubMed
    1. Zhu J, Zhou R, Wang Y, and Yu M (2019). Perineural invasion as a prognostic factor in head and neck squamous cell carcinoma: a systematic review and meta-analysis. Acta Otolaryngol 139, 1038–1043. 10.1080/00016489.2019.1655167. - DOI - PubMed
    1. Saidak Z, Clatot F, Chatelain D, and Galmiche A (2018). A gene expression profile associated with perineural invasion identifies a subset of HNSCC at risk of post-surgical recurrence. Oral Oncol 86, 53–60. 10.1016/j.oraloncology.2018.09.005. - DOI - PubMed
    1. Brandwein-Gensler M, Teixeira MS, Lewis CM, Lee B, Rolnitzky L, Hille JJ, Genden E, Urken ML, and Wang BY (2005). Oral squamous cell carcinoma: histologic risk assessment, but not margin status, is strongly predictive of local disease-free and overall survival. Am J Surg Pathol 29, 167–178. 10.1097/01.pas.0000149687.90710.21. - DOI - PubMed
    1. Rahima B, Shingaki S, Nagata M, and Saito C (2004). Prognostic significance of perineural invasion in oral and oropharyngeal carcinoma. Oral Surg Oral Med Oral Pathol Oral Radiol Endod 97, 423–431. 10.1016/j.tripleo.2003.10.014. - DOI - PubMed

Substances