

Flexible multi-step hypothesis testing of human ECoG data using cluster-based permutation tests with GLMEs
- PMID: 38423264
- PMCID: PMC11268380
- DOI: 10.1016/j.neuroimage.2024.120557
Flexible multi-step hypothesis testing of human ECoG data using cluster-based permutation tests with GLMEs
Abstract
Background: Time series analysis is critical for understanding brain signals and their relationship to behavior and cognition. Cluster-based permutation tests (CBPT) are commonly used to analyze a variety of electrophysiological signals including EEG, MEG, ECoG, and sEEG data without a priori assumptions about specific temporal effects. However, two major limitations of CBPT include the inability to directly analyze experiments with multiple fixed effects and the inability to account for random effects (e.g. variability across subjects). Here, we propose a flexible multi-step hypothesis testing strategy using CBPT with Linear Mixed Effects Models (LMEs) and Generalized Linear Mixed Effects Models (GLMEs) that can be applied to a wide range of experimental designs and data types.
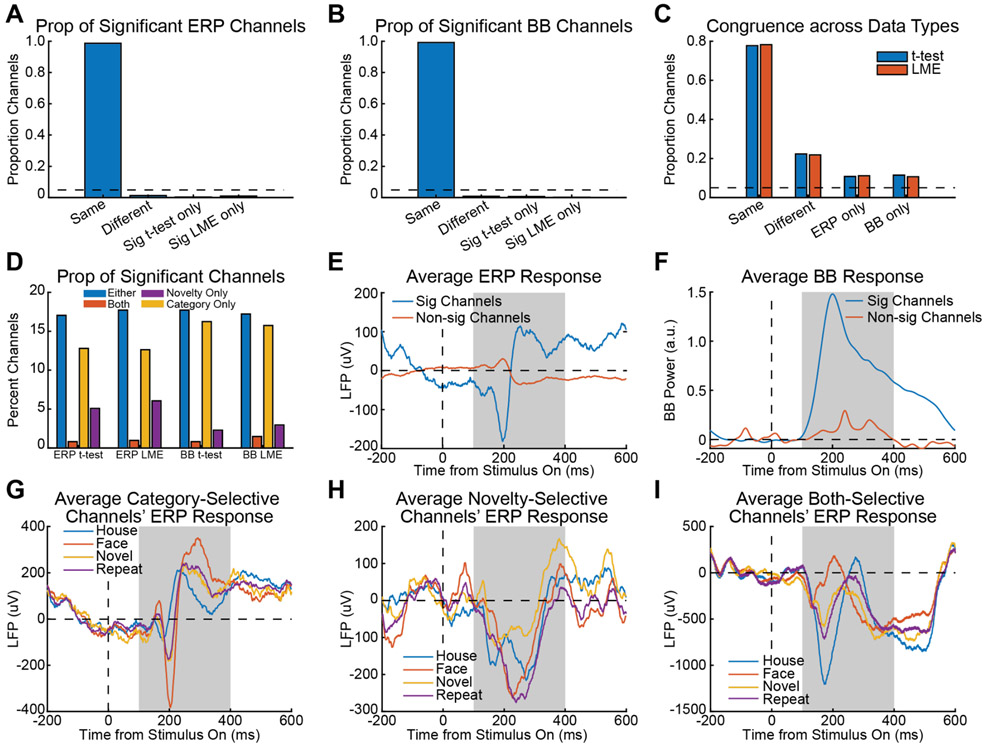
Methods: We first evaluate the statistical robustness of LMEs and GLMEs using simulated data distributions. Second, we apply a multi-step hypothesis testing strategy to analyze ERPs and broadband power signals extracted from human ECoG recordings collected during a simple image viewing experiment with image category and novelty as fixed effects. Third, we assess the statistical power differences between analyzing signals with CBPT using LMEs compared to CBPT using separate t-tests run on each fixed effect through simulations that emulate broadband power signals. Finally, we apply CBPT using GLMEs to high-gamma burst data to demonstrate the extension of the proposed method to the analysis of nonlinear data.
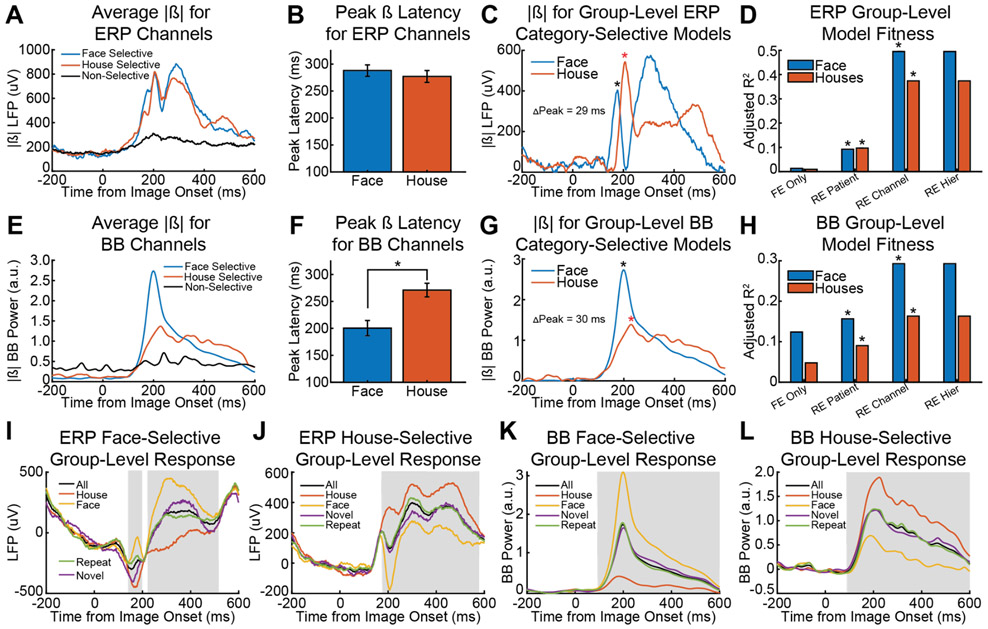
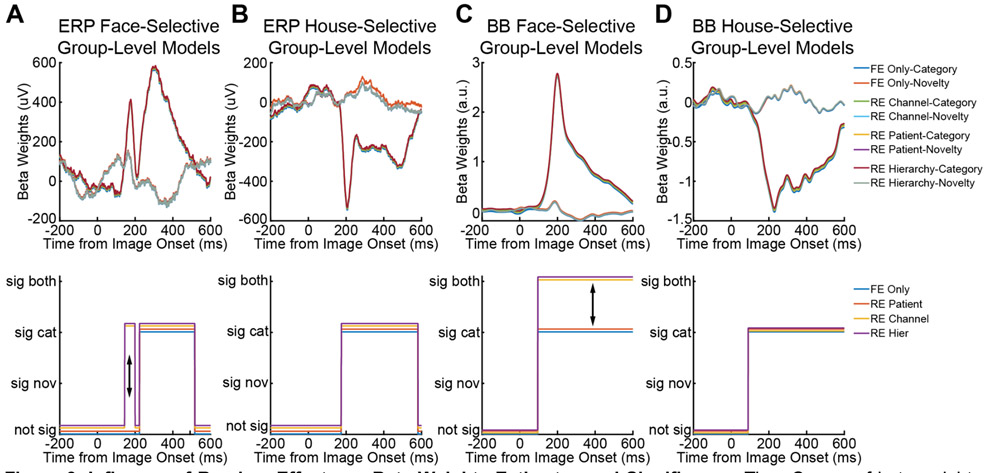
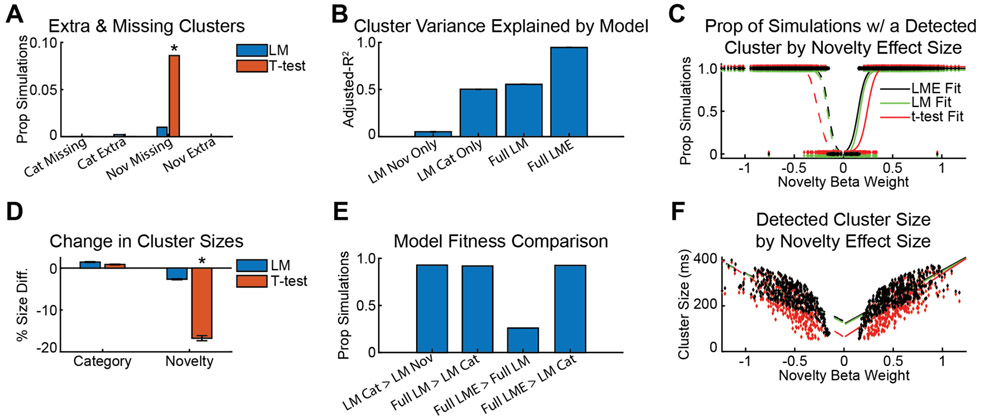
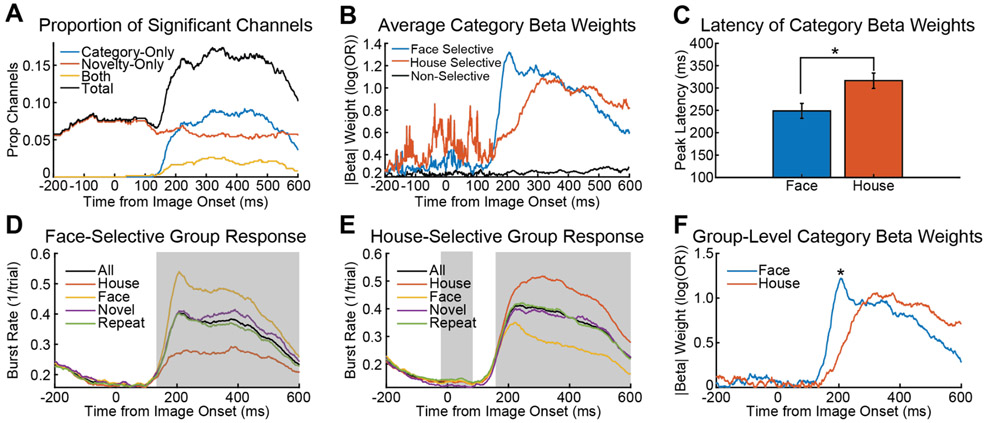
Results: First, we found that LMEs and GLMEs are robust statistical models. In simple simulations LMEs produced highly congruent results with other appropriately applied linear statistical models, but LMEs outperformed many linear statistical models in the analysis of "suboptimal" data and maintained power better than analyzing individual fixed effects with separate t-tests. GLMEs also performed similarly to other nonlinear statistical models. Second, in real world human ECoG data, LMEs performed at least as well as separate t-tests when applied to predefined time windows or when used in conjunction with CBPT. Additionally, fixed effects time courses extracted with CBPT using LMEs from group-level models of pseudo-populations replicated latency effects found in individual category-selective channels. Third, analysis of simulated broadband power signals demonstrated that CBPT using LMEs was superior to CBPT using separate t-tests in identifying time windows with significant fixed effects especially for small effect sizes. Lastly, the analysis of high-gamma burst data using CBPT with GLMEs produced results consistent with CBPT using LMEs applied to broadband power data.
Conclusions: We propose a general approach for statistical analysis of electrophysiological data using CBPT in conjunction with LMEs and GLMEs. We demonstrate that this method is robust for experiments with multiple fixed effects and applicable to the analysis of linear and nonlinear data. Our methodology maximizes the statistical power available in a dataset across multiple experimental variables while accounting for hierarchical random effects and controlling FWER across fixed effects. This approach substantially improves power leading to better reproducibility. Additionally, CBPT using LMEs and GLMEs can be used to analyze individual channels or pseudo-population data for the comparison of functional or anatomical groups of data.
Keywords: Broadband Power; Burst Analysis; Cluster-based statistics; Event Related Potentials (ERPs); Mixed Effects Models; generalized linear models (GLMs); linear models.
Copyright © 2024. Published by Elsevier Inc.
Conflict of interest statement
Declaration of competing interest The authors have no conflicts of interest to declare.
Figures
Update of
-
Flexible Multi-Step Hypothesis Testing of Human ECoG Data using Cluster-based Permutation Tests with GLMEs.bioRxiv [Preprint]. 2023 Apr 2:2023.03.31.535153. doi: 10.1101/2023.03.31.535153. bioRxiv. 2023. Update in: Neuroimage. 2024 Apr 15;290:120557. doi: 10.1016/j.neuroimage.2024.120557. PMID: 37034791 Free PMC article. Updated. Preprint.
Similar articles
-
Flexible Multi-Step Hypothesis Testing of Human ECoG Data using Cluster-based Permutation Tests with GLMEs.bioRxiv [Preprint]. 2023 Apr 2:2023.03.31.535153. doi: 10.1101/2023.03.31.535153. bioRxiv. 2023. Update in: Neuroimage. 2024 Apr 15;290:120557. doi: 10.1016/j.neuroimage.2024.120557. PMID: 37034791 Free PMC article. Updated. Preprint.
-
Recording human electrocorticographic (ECoG) signals for neuroscientific research and real-time functional cortical mapping.J Vis Exp. 2012 Jun 26;(64):3993. doi: 10.3791/3993. J Vis Exp. 2012. PMID: 22782131 Free PMC article.
-
The Temporal and Spatial Dynamics of Cortical Emotion Processing in Different Brain Frequencies as Assessed Using the Cluster-Based Permutation Test: An MEG Study.Brain Sci. 2020 Jun 6;10(6):352. doi: 10.3390/brainsci10060352. Brain Sci. 2020. PMID: 32517238 Free PMC article.
-
Subgroup analyses in randomised controlled trials: quantifying the risks of false-positives and false-negatives.Health Technol Assess. 2001;5(33):1-56. doi: 10.3310/hta5330. Health Technol Assess. 2001. PMID: 11701102 Review.
-
High-frequency gamma oscillations and human brain mapping with electrocorticography.Prog Brain Res. 2006;159:275-95. doi: 10.1016/S0079-6123(06)59019-3. Prog Brain Res. 2006. PMID: 17071238 Review.
Cited by
-
Dynamic prefrontal coupling coordinates adaptive decision-making.Res Sq [Preprint]. 2025 Apr 9:rs.3.rs-6296852. doi: 10.21203/rs.3.rs-6296852/v1. Res Sq. 2025. PMID: 40297698 Free PMC article. Preprint.
References
-
- Anderson Marti, and Ter Braak Cajo. 2003. “Permutation Tests for Multi-Factorial Analysis of Variance.” Journal of Statistical Computation and Simulation 73 (2): 85–113.
-
- Anderson Marti J. 2001. “Permutation Tests for Univariate or Multivariate Analysis of Variance and Regression.” Canadian Journal of Fisheries and Aquatic Sciences. Journal Canadien Des Sciences Halieutiques et Aquatiques 58 (3): 626–39.
-
- Baayen, and Milin. 2010. “Analyzing Reaction Times.” International Journal of Psychological and Brain Sciences. https://dialnet.unirioja.es/servlet/articulo?codigo=3405162.
-
- Benjamini Yoav, and Hochberg Yosef. 1995. “Controlling the False Discovery Rate: A Practical and Powerful Approach to Multiple Testing.” Journal of the Royal Statistical Society 57 (1): 289–300.
MeSH terms
Grants and funding
LinkOut - more resources
Full Text Sources
