

Impact of Tumor Grade Distribution on Genetic Alterations in Clear Cell Renal Cell Carcinoma and Prostate Cancer
- PMID: 38423595
- PMCID: PMC10905277
- DOI: 10.21873/cgp.20441
Impact of Tumor Grade Distribution on Genetic Alterations in Clear Cell Renal Cell Carcinoma and Prostate Cancer
Abstract
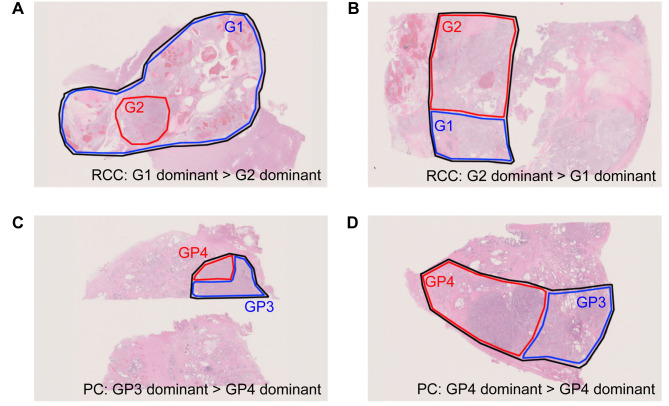
Background/aim: A genomic analysis based on next-generation sequencing is important for deciding cancer treatment strategies. Cancer tissue sometimes displays intratumor heterogeneity and a pathologic specimen may contain more than two tumor grades. Although tumor grades are very important for the cancer prognosis, the impact of higher tumor grade distribution in a specimen used for a genomic analysis is unknown.
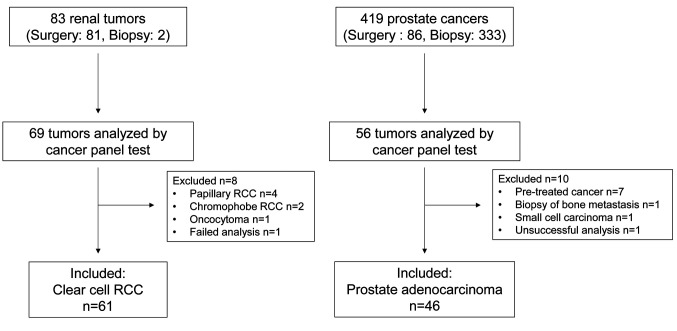
Patients and methods: We retrospectively analyzed the data of 61 clear cell carcinoma and 46 prostate cancer patients that were diagnosed between December 2018 and August 2022 using the GeneRead Human Comprehensive Cancer Panel or SureSelect PrePool custom Tier2. Genome annotation and curation were performed using the GenomeJack software.
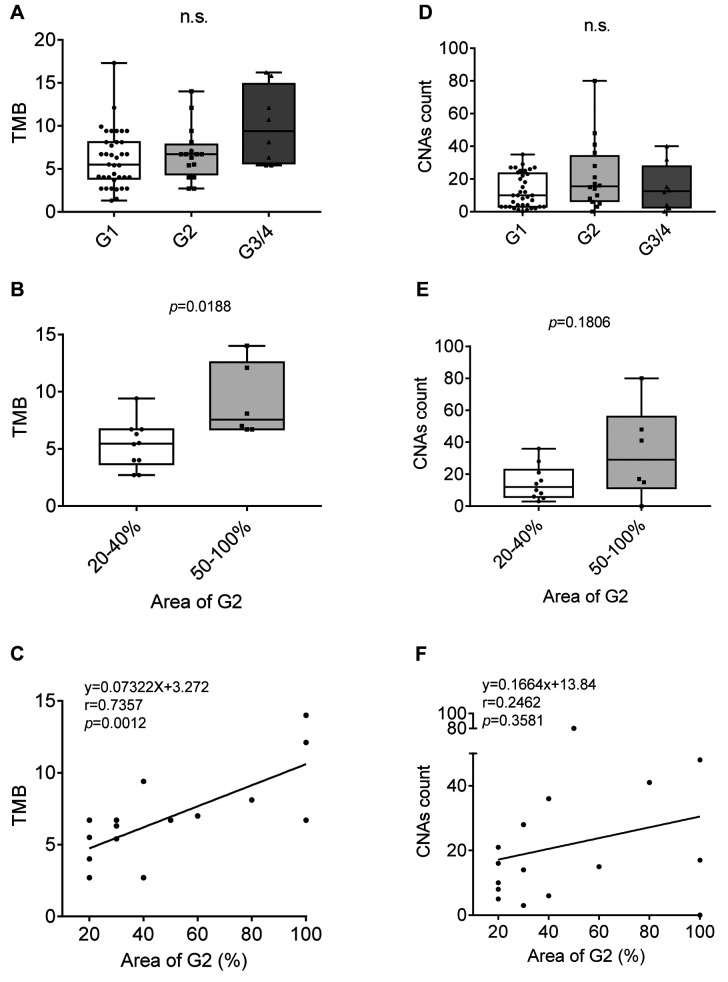
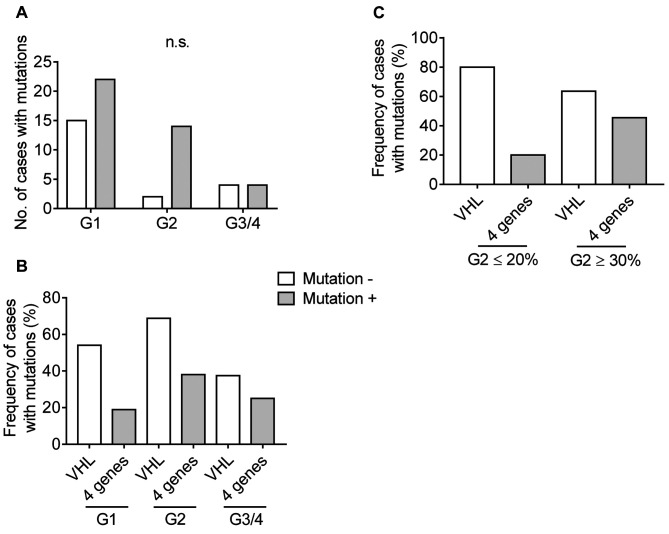
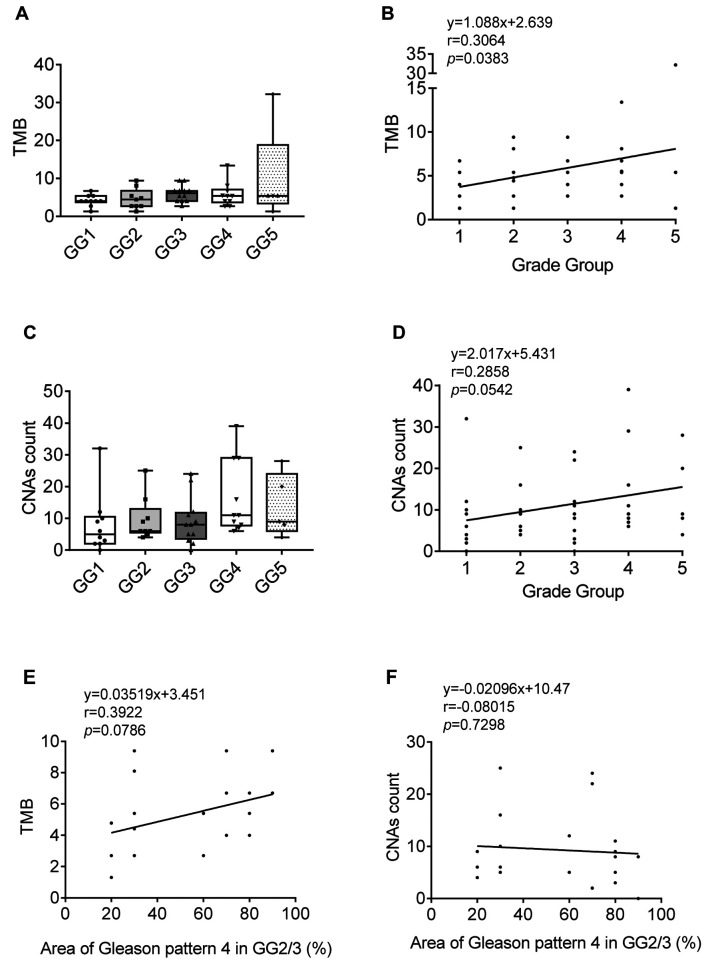
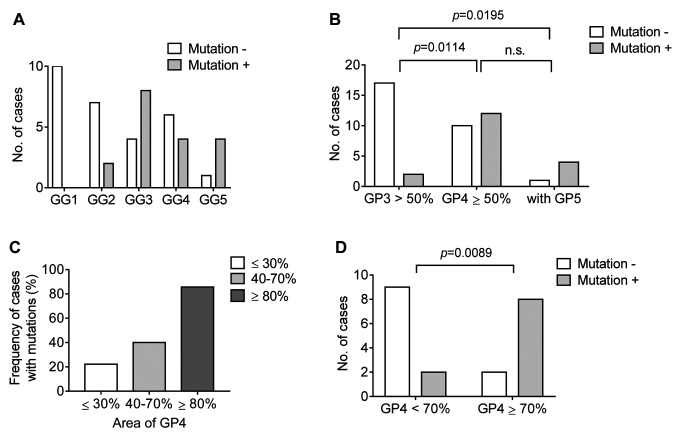
Results: Tumor mutation burden (TMB) was increased in proportion to the higher tumor grade distribution in grade 2 clear cell renal cell carcinoma (ccRCC). In PC, Grade Group 3/4 specimens that included an increased distribution of Gleason pattern 4 had more frequent gene mutations.
Conclusion: Our results suggest the importance of selecting the maximum distribution of higher tumor grade areas to obtain results on the precise gene alterations for genomics-focused treatments.
Keywords: Tumor grade distribution; cancer panel test; genetic alteration; intratumor heterogeneity.
Copyright © 2024, International Institute of Anticancer Research (Dr. George J. Delinasios), All rights reserved.
Conflict of interest statement
The Authors declare that they have no competing interests.
Figures
Similar articles
-
Mutational heterogeneity between different regional tumour grades of clear cell renal cell carcinoma.Exp Mol Pathol. 2020 Aug;115:104431. doi: 10.1016/j.yexmp.2020.104431. Epub 2020 Apr 4. Exp Mol Pathol. 2020. PMID: 32259515
-
Comprehensive genomic profiling of metastatic collecting duct carcinoma, renal medullary carcinoma, and clear cell renal cell carcinoma.Urol Oncol. 2021 Jun;39(6):367.e1-367.e5. doi: 10.1016/j.urolonc.2020.12.009. Epub 2021 Mar 26. Urol Oncol. 2021. PMID: 33775530
-
Clinical and pathologic impact of select chromatin-modulating tumor suppressors in clear cell renal cell carcinoma.Eur Urol. 2013 May;63(5):848-54. doi: 10.1016/j.eururo.2012.09.005. Epub 2012 Sep 27. Eur Urol. 2013. PMID: 23036577 Free PMC article.
-
[Heredity in renal and prostatic neoplasia].Arch Ital Urol Androl. 1997 Sep;69(4):241-6. Arch Ital Urol Androl. 1997. PMID: 9417296 Review. Italian.
-
Genetic pathways involved in carcinogenesis of clear cell renal cell carcinoma: genomics towards personalized medicine.BJU Int. 2012 Jun;109(12):1864-70. doi: 10.1111/j.1464-410X.2011.10661.x. Epub 2011 Oct 28. BJU Int. 2012. PMID: 22035299 Review.
Cited by
-
Prognostic Significance of EZH2-Related Gene Variants in Patients With Prostate Cancer Undergoing Androgen Deprivation Therapy.Cancer Genomics Proteomics. 2025 Jun 26;22(4):611-623. doi: 10.21873/cgp.20525. Cancer Genomics Proteomics. 2025. PMID: 40571313 Free PMC article.
-
Application effect of case management nursing based on patient safety in patients with prostate cancer.World J Clin Cases. 2024 Sep 26;12(27):6070-6076. doi: 10.12998/wjcc.v12.i27.6070. World J Clin Cases. 2024. PMID: 39328862 Free PMC article.
References
-
- Takeda M, Takahama T, Sakai K, Shimizu S, Watanabe S, Kawakami H, Tanaka K, Sato C, Hayashi H, Nonagase Y, Yonesaka K, Takegawa N, Okuno T, Yoshida T, Fumita S, Suzuki S, Haratani K, Saigoh K, Ito A, Mitsudomi T, Handa H, Fukuoka K, Nakagawa K, Nishio K. Clinical application of the FoundationOne CDx assay to therapeutic decision-making for patients with advanced solid tumors. Oncologist. 2021;26(4):e588–e596. doi: 10.1002/onco.13639. - DOI - PMC - PubMed
-
- Woodhouse R, Li M, Hughes J, Delfosse D, Skoletsky J, Ma P, Meng W, Dewal N, Milbury C, Clark T, Donahue A, Stover D, Kennedy M, Dacpano-Komansky J, Burns C, Vietz C, Alexander B, Hegde P, Dennis L. Clinical and analytical validation of FoundationOne Liquid CDx, a novel 324-Gene cfDNA-based comprehensive genomic profiling assay for cancers of solid tumor origin. PLoS One. 2020;15(9):e0237802. doi: 10.1371/journal.pone.0237802. - DOI - PMC - PubMed
MeSH terms
LinkOut - more resources
Full Text Sources
Medical