

Linear and Nonlinear Behaviors of the Photoreceptor Coupled Network
- PMID: 38423760
- PMCID: PMC11026348
- DOI: 10.1523/JNEUROSCI.1433-23.2024
Linear and Nonlinear Behaviors of the Photoreceptor Coupled Network
Abstract
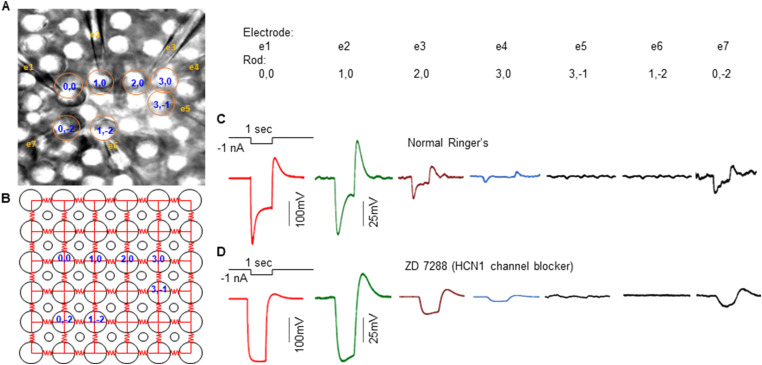
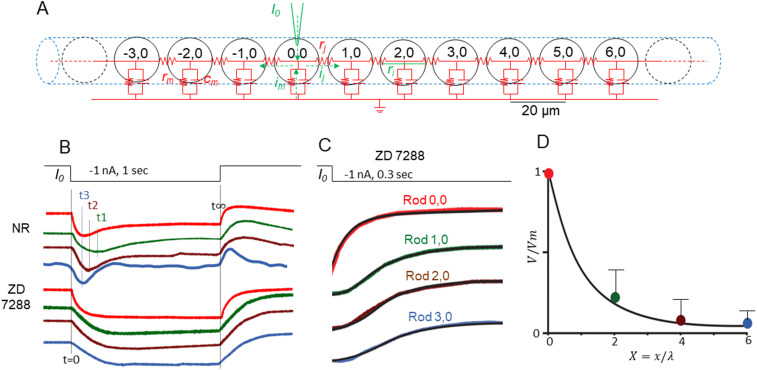
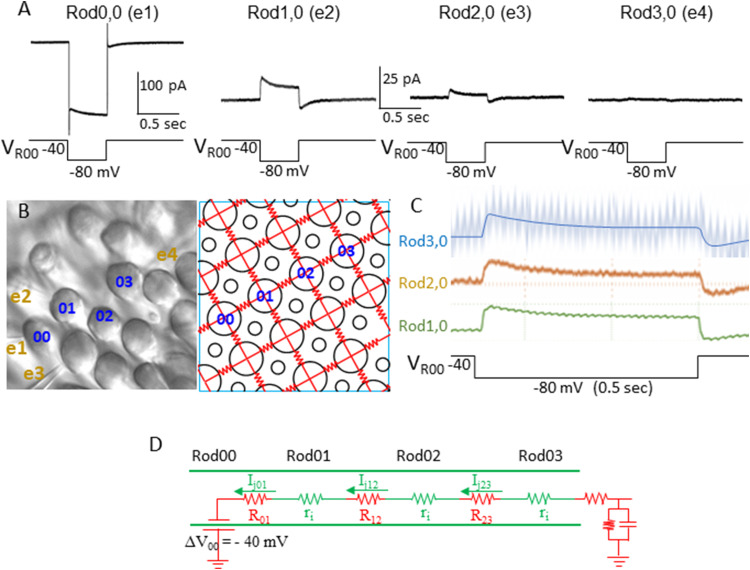
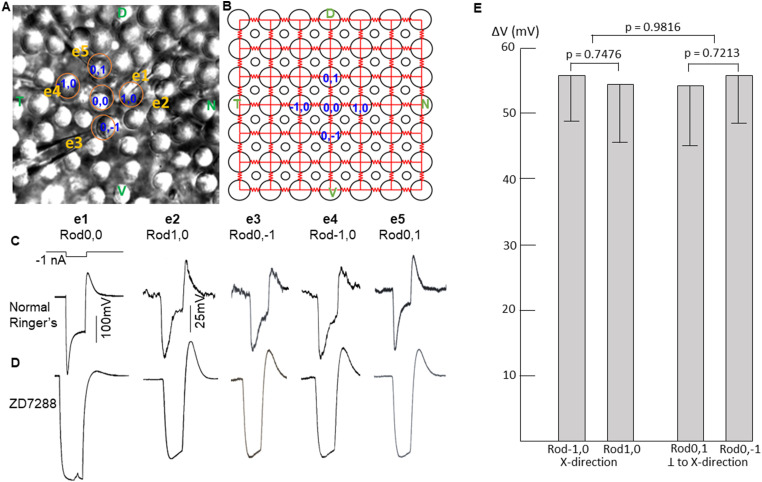
Photoreceptors are electrically coupled to one another, and the spatiotemporal properties of electrical synapses in a two-dimensional retinal network are still not well studied, because of the limitation of the single electrode or pair recording techniques which do not allow simultaneously measuring responses of multiple photoreceptors at various locations in the retina. A multiple electrode recording system is needed. In this study, we investigate the network properties of the two-dimensional rod coupled array of the salamander retina (both sexes were used) by using the newly available multiple patch electrode system that allows simultaneous recordings from up to eight cells and to determine the electrical connectivity among multiple rods. We found direct evidence that voltage signal spread in the rod-rod coupling network in the absence of I h (mediated by HCN channels) is passive and follows the linear cable equation. Under physiological conditions, I h shapes the network signal by progressively shortening the response time-to-peak of distant rods, compensating the time loss of signal traveling from distant rods to bipolar cell somas and facilitating synchronization of rod output signals. Under voltage-clamp conditions, current flow within the coupled rods follows Ohm's law, supporting the idea that nonlinear behaviors of the rod network are dependent on membrane voltage. Rod-rod coupling is largely symmetrical in the 2D array, and voltage-clamp blocking the next neighboring rod largely suppresses rod signal spread into the second neighboring rod, suggesting that indirect coupling pathways play a minor role in rod-rod coupling.
Keywords: HCN channels; Ih; ZD7288; junctional resistance; linear cable equation; photoreceptor coupling; rod–rod coupled network; space constant; time-to-peak.
Copyright © 2024 Pang et al.
Conflict of interest statement
The authors declare no competing financial interests.
Figures
Similar articles
-
Interventions for central serous chorioretinopathy: a network meta-analysis.Cochrane Database Syst Rev. 2025 Jun 16;6(6):CD011841. doi: 10.1002/14651858.CD011841.pub3. Cochrane Database Syst Rev. 2025. PMID: 40522203
-
Drugs for preventing postoperative nausea and vomiting in adults after general anaesthesia: a network meta-analysis.Cochrane Database Syst Rev. 2020 Oct 19;10(10):CD012859. doi: 10.1002/14651858.CD012859.pub2. Cochrane Database Syst Rev. 2020. PMID: 33075160 Free PMC article.
-
Anti-vascular endothelial growth factor for diabetic macular oedema: a network meta-analysis.Cochrane Database Syst Rev. 2017 Jun 22;6(6):CD007419. doi: 10.1002/14651858.CD007419.pub5. Cochrane Database Syst Rev. 2017. Update in: Cochrane Database Syst Rev. 2018 Oct 16;10:CD007419. doi: 10.1002/14651858.CD007419.pub6. PMID: 28639415 Free PMC article. Updated.
-
A rapid and systematic review of the clinical effectiveness and cost-effectiveness of paclitaxel, docetaxel, gemcitabine and vinorelbine in non-small-cell lung cancer.Health Technol Assess. 2001;5(32):1-195. doi: 10.3310/hta5320. Health Technol Assess. 2001. PMID: 12065068
-
The effect of sample site and collection procedure on identification of SARS-CoV-2 infection.Cochrane Database Syst Rev. 2024 Dec 16;12(12):CD014780. doi: 10.1002/14651858.CD014780. Cochrane Database Syst Rev. 2024. PMID: 39679851 Free PMC article.
References
-
- Adler R, Curcio C, Hicks D, Price D, Wong F (1999) Cell death in age-related macular degeneration. Mol Vis 5:31. PMID: - PubMed
MeSH terms
Grants and funding
LinkOut - more resources
Full Text Sources