. 2024 Jun 28;195(3):2176-2194.
doi: 10.1093/plphys/kiae098.

Deletion of the sugar importer gene OsSWEET1b accelerates sugar starvation-promoted leaf senescence in rice

Affiliations

Deletion of the sugar importer gene OsSWEET1b accelerates sugar starvation-promoted leaf senescence in rice

Dan Chen et al. Plant Physiol. .

Abstract

Leaf senescence is a combined response of plant cells stimulated by internal and external signals. Sugars acting as signaling molecules or energy metabolites can influence the progression of leaf senescence. Both sugar starvation and accumulation can promote leaf senescence with diverse mechanisms that are reported in different species. Sugars Will Eventually be Exported Transporters (SWEETs) are proposed to play essential roles in sugar transport, but whether they have roles in senescence and the corresponding mechanism are unclear. Here, we functionally characterized a sugar transporter, OsSWEET1b, which transports sugar and promotes senescence in rice (Oryza sativa L.). OsSWEET1b could import glucose and galactose when heterologously expressed in Xenopus oocytes and translocate glucose and galactose from the extracellular apoplast into the intracellular cytosol in rice. Loss of function of OsSWEET1b decreased glucose and galactose accumulation in leaves. ossweet1b mutants showed accelerated leaf senescence under natural and dark-induced conditions. Exogenous application of glucose and galactose complemented the defect of OsSWEET1b deletion-promoted senescence. Moreover, the senescence-activated transcription factor OsWRKY53, acting as a transcriptional repressor, genetically functions upstream of OsSWEET1b to suppress its expression. OsWRKY53-overexpressing plants had attenuated sugar accumulation, exhibiting a similar phenotype as the ossweet1b mutants. Our findings demonstrate that OsWRKY53 downregulates OsSWEET1b to impair its influx transport activity, leading to compromised sugar accumulation in the cytosol of rice leaves where sugar starvation promotes leaf senescence.


Conflict of interest statement

Conflict of interest statement. None declared.

Figures

Figure 1.
Figure 1.
The ossweet1b mutant shows accelerated leaf senescence. A) Senescing flag leaf of OsSWEET1b-OE, ossweet1b, and WT at the tillering stage. B) SPAD values of flag leaf of OsSWEET1b-OE, ossweet1b, and WT at the tillering stage. C) Fv/Fm values of flag leaf of OsSWEET1b-OE, ossweet1b, and WT at the tillering stage. D) Electrolyte leakage analysis of flag leaf of OsSWEET1b-OE, ossweet1b, and WT at the tillering stage. E) Chlorophyll contents of flag leaf of OsSWEET1b-OE, ossweet1b, and WT at the tillering stage. F) Senescing flag leaf of OsSWEET1b-OE, ossweet1b, and WT at the heading stage. G) SPAD values of flag leaf of OsSWEET1b-OE, ossweet1b, and WT at the heading stage. H) Fv/Fm values of flag leaf of OsSWEET1b-OE, ossweet1b, and WT at the heading stage. I) Electrolyte leakage analysis of flag leaf of OsSWEET1b-OE, ossweet1b, and WT at the heading stage. J) Chlorophyll contents of flag leaf of OsSWEET1b-OE, ossweet1b, and WT at the heading stage. K) Senescing flag leaf of OsSWEET1b-OE, ossweet1b, and WT at the grain filling stage. L) SPAD values of flag leaf of OsSWEET1b-OE, ossweet1b, and WT at the grain filling stage. M) Fv/Fm values of flag leaf of OsSWEET1b-OE, ossweet1b, and WT at the grain filling stage. N) Electrolyte leakage analysis of flag leaf of OsSWEET1b-OE, ossweet1b, and WT at the grain filling stage. O) Chlorophyll contents of flag leaf of OsSWEET1b-OE, ossweet1b, and WT at the grain filling stage. Scale bars: 1 cm. Data represent mean ± Sd; n = 30 includes 3 biological replicates and 10 technical replicates for each biological replicate in B), C), D), G), H), I), L), M), and N). Data represent mean ± Se; n = 3 biological replicates in E), J), and O). Asterisks in B), C), D), E), G), H), I), J), L), M), N), and O) indicate a significant difference between transgenic plants and WT as determined by 2-tailed Student's t test at **P < 0.01 or *P < 0.05.
Figure 2.
Figure 2.
Transcript levels of representative chlorophyll synthesis genes, chlorophyll degradation genes, and SAGs in flag leaf at the grain filling stage. A) Transcript levels of chlorophyll synthesis genes. B) Transcript levels of chlorophyll degradation genes. C) Transcript levels of SAGs. Data represent mean ± Se for 3 biological replicates. Gene expression analysis was performed by RT-qPCR and normalized to Actin. Asterisks in A), B), and C) indicate a significant difference between transgenic plants and WT as determined by 2-tailed Student's t test at **P < 0.01 or *P < 0.05.
Figure 3.
Figure 3.
Impaired ROS homeostasis in the ossweet1b mutants. A) DAB staining for the OsSWEET1b-OE plants, ossweet1b mutants, and WT flag leaf. Scale bars: 1 cm. B) H2O2 levels in the transgenic rice plants and WT flag leaf. C) SOD activity in the transgenic rice plants and WT flag leaf. D) POD activity in the transgenic rice plants and WT flag leaf. E) MDA activity in the transgenic rice plants and WT flag leaf. Data represent mean ± Se of 3 biological replicates. Asterisks in B), C), D), and E) indicate a significant difference between transgenic plants and WT as determined by 2-tailed Student's t test at **P < 0.01 or *P < 0.05.
Figure 4.
Figure 4.
Sugar transporter activity of OsSWEET1b. A) Subcellular localization of OsSWEET1b:GFP in rice protoplasts. SCAMP1:RFP is used as a plasma membrane-localized marker protein. Scale bars: 10 μm. B) Uptake of glucose, sucrose, and galactose from Xenopus oocytes. C) Kinetics of OsSWEET1b for glucose and galactose uptake in Xenopus oocytes. D) Efflux of glucose, sucrose, and galactose from Xenopus oocytes. Data represent mean ± Sd of 8 biological replicates. Asterisks in B) and D) indicate a significant difference between control and SWEET protein as determined by 2-tailed Student's t test at **P < 0.01 or *P < 0.05.
Figure 5.
Figure 5.
Sugar contents in leaves of the ossweet1b mutant and OsSWEET1b-OE plant. A) Sugar contents in the transgenic rice plants and WT flag leaf at the different growth stages. B) Apoplastic sugar contents in the transgenic rice plants and WT at 3-wk-old seedling stage. C) Sugar contents in protoplasts of the transgenic rice plants and WT at 3-wk-old seedling stage. Data represent mean ± Se of 3 biological replicates. Asterisks in A), B), and C) indicate a significant difference between transgenic plants and WT as determined by 2-tailed Student's t test at **P < 0.01 or *P < 0.05.
Figure 6.
Figure 6.
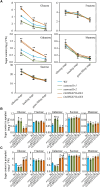
Exogenous applications of glucose and galactose delay the accelerated leaf senescence of ossweet1b mutant. A) Phenotype of detached leaf of ossweet1b and WT after dark treatment with or without additional glucose. DDI, day of dark incubation. B) Total chlorophyll content of ossweet1b and WT after dark treatment with or without additional glucose. C) Relative transcript levels of OsI57 and OsDOS in detached leaf of ossweet1b and WT after dark treatment with or without additional glucose. D) Phenotype of detached leaf of ossweet1b and WT after dark treatment with or without additional galactose. E) Total chlorophyll content of ossweet1b and WT after dark treatment with or without additional galactose. F) Relative transcript levels of OsI57 and OsDOS in detached leaf of ossweet1b and WT after dark treatment with or without additional galactose. Data represent mean ± Se of 3 biological replicates. Gene expression analysis was performed by RT-qPCR and normalized to Actin. Statistical significance was determined through 2-way ANOVA with Tukey's multiple comparisons test at **P < 0.01 or *P < 0.05.
Figure 7.
Figure 7.
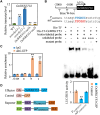
OsWRKY53 binds to OsSWEET1b promoter and suppresses OsSWEET1b transcription. A)OsSWEET1b expression in OsWRKY53-OE, oswrky53 mutants, and WT. B) DNA binding activity assay of OsWRKY53 by EMSA. The blue capital letters indicate the intact W-box, and the red capital letters represent the mutated W-box. C) Binding assay of OsWRKY53 to the promoter of OsSWEET1b by ChIP-qPCR in OsWRKY53:GFP plants using the anti-GFP antibody. Anti-GFP antibody was used for immunoprecipitation and IgG acted as a control. D) Activity assay of OsWRKY53 in regulating OsSWEET1b expression. Data represent mean ± Se of 3 biological replicates. Gene expression analysis was performed by RT-qPCR and normalized to Actin. Asterisks in A) and C) indicate a significant difference between transgenic plants and WT as determined by 2-tailed Student's t test at **P < 0.01 or in D) indicate a significant difference between control and reporter determined by 2-tailed Student's t test at **P < 0.01.
Figure 8.
Figure 8.
OsWRKY53 genetically acts upstream of OsSWEET1b. A) Leaf phenotype of oswrky53, ossweet1b, and oswrky53 osweet1b mutants at the heading stage. Scale bar: 1 cm. B) SPAD values of flag leaf of oswrky53, ossweet1b, and oswrky53 osweet1b mutants at the heading stage. C) Fv/Fm values of flag leaf of oswrky53, ossweet1b, and oswrky53 osweet1b mutants at the heading stage. D) Electrolyte leakage analysis of flag leaf of oswrky53, ossweet1b, and oswrky53 osweet1b mutants at the heading stage. E) Chlorophyll content of flag leaf of oswrky53, ossweet1b, and oswrky53 osweet1b mutants at the heading stage. F) Glucose and galactose contents in flag leaf of the oswrky53 and oswrky53 osweet1b mutants at the different growth stages. G) Apoplastic sugar contents in the oswrky53 and oswrky53 osweet1b mutants at 3-wk-old seedling stage. H) Sugar contents in protoplasts of the oswrky53 and oswrky53 osweet1b mutants at 3-wk-old seedling stage. Data represent mean ± Se of 3 biological replicates. The different letters above each bar in B), C), D), and E) indicate statistically significant differences, as determined by 1-way ANOVA analysis followed by Tukey's multiple test (P < 0.05). Asterisks in F), G), and H) indicate a significant difference between transgenic plants and WT as determined by 2-tailed Student's t test at **P < 0.01 or *P < 0.05.
Figure 9.
Figure 9.
Proposed working model of OsWRKY53-regulated senescence. OsWRKY53 binds and suppresses the expressions of OsSWEET1b and OsABA8ox1 or OsABA8ox2, causing decreased sugar accumulation and increased ABA accumulation in leaf cells, respectively. The attenuated sugar content and enhanced ABA level coordinately promote leaf senescence.

Similar articles

Cited by

References

    1. Asim M, Zhang Y, Sun Y, Guo M, Khan R, Wang XL, Hussain Q, Shi Y. Leaf senescence attributes: the novel and emerging role of sugars as signaling molecules and the overlap of sugars and hormones signaling nodes. Crit Rev Biotechnol. 2023:43:1092–1110. 10.1080/07388551.2022.2094215 - DOI - PubMed
    1. Burdiak P, Mielecki J, Gawroński P, Karpiński S. The CRK5 and WRKY53 are conditional regulators of senescence and stomatal conductance in Arabidopsis. Cells 2022:11(22):3558. 10.3390/cells11223558 - DOI - PMC - PubMed
    1. Chen LQ, Cheung LS, Feng L, Tanner W, Frommer WB. Transport of sugars. Annu Rev Biochem. 2015:84(1):865–894. 10.1146/annurev-biochem-060614-033904 - DOI - PubMed
    1. Chen LQ, Lin IW, Qu XQ, Sosso D, McFarlane HE, Londoño A, Samuels AL, Frommer WB. A cascade of sequentially expressed sucrose transporters in the seed coat and endosperm provides nutrition for the Arabidopsis embryo. Plant Cell. 2015:27(3):607–619. 10.1105/tpc.114.134585 - DOI - PMC - PubMed
    1. Chen LQ, Qu XQ, Hou BH, Sosso D, Osorio S, Fernie AR, Frommer WB. Sucrose efflux mediated by SWEET proteins as a key step for phloem transport. Science 2012:335(6065):207–211. 10.1126/science.1213351 - DOI - PubMed