. 2024 Feb 29;15(1):1879.
doi: 10.1038/s41467-024-45548-w.

The transcription factor ChREBP Orchestrates liver carcinogenesis by coordinating the PI3K/AKT signaling and cancer metabolism

Affiliations

The transcription factor ChREBP Orchestrates liver carcinogenesis by coordinating the PI3K/AKT signaling and cancer metabolism

Emmanuel Benichou et al. Nat Commun. .

Abstract

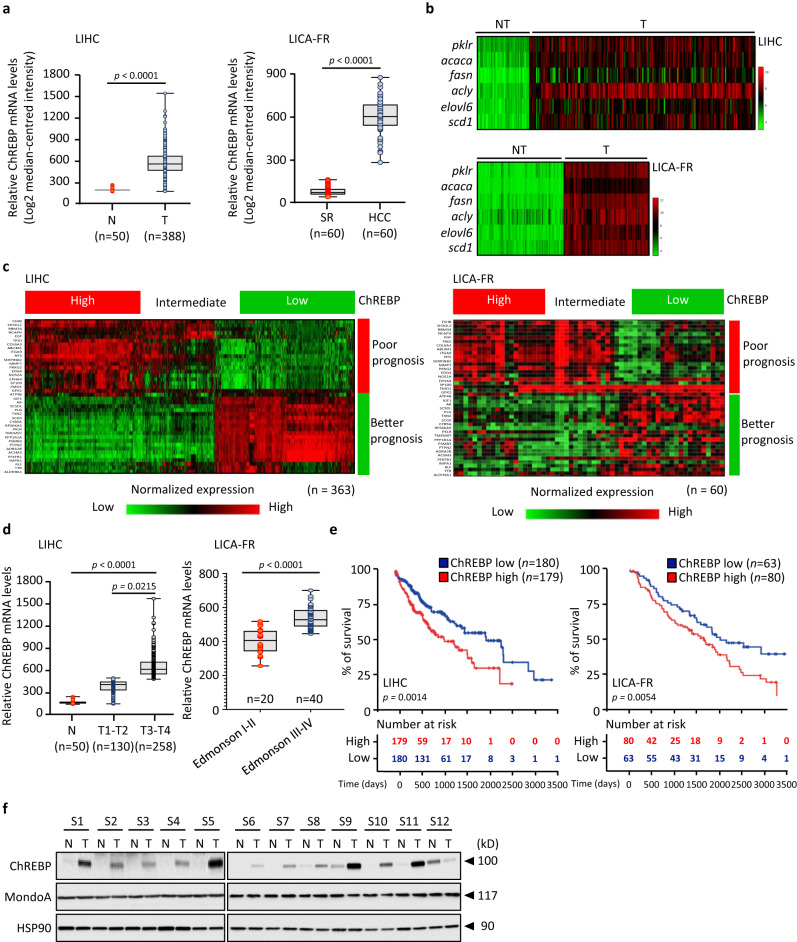
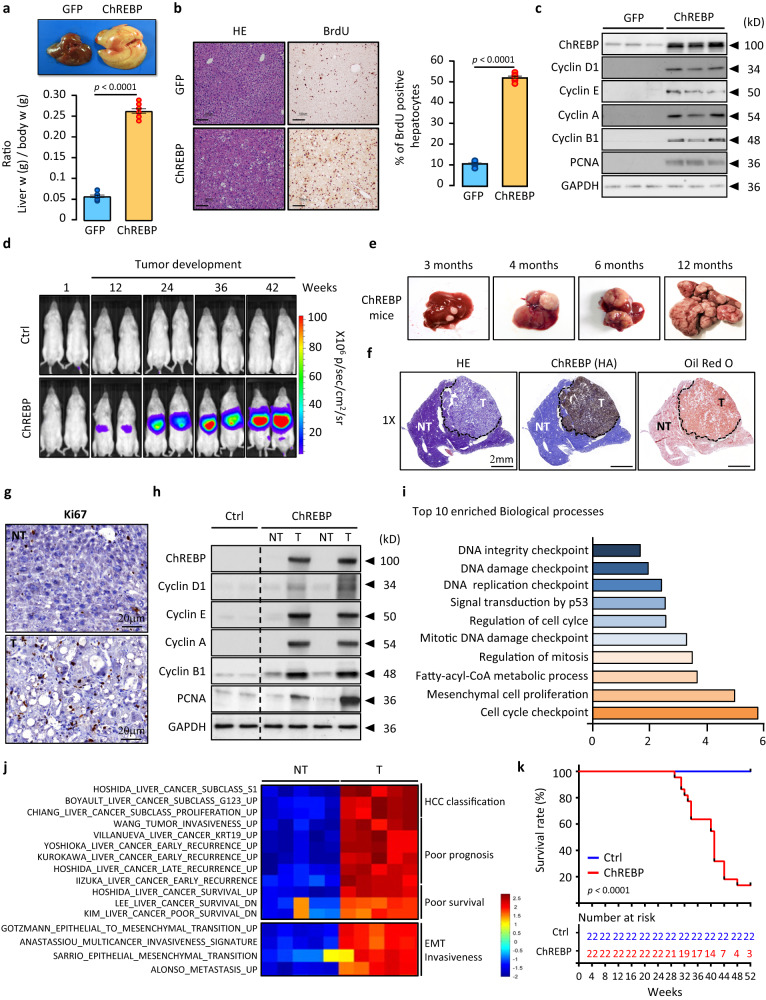
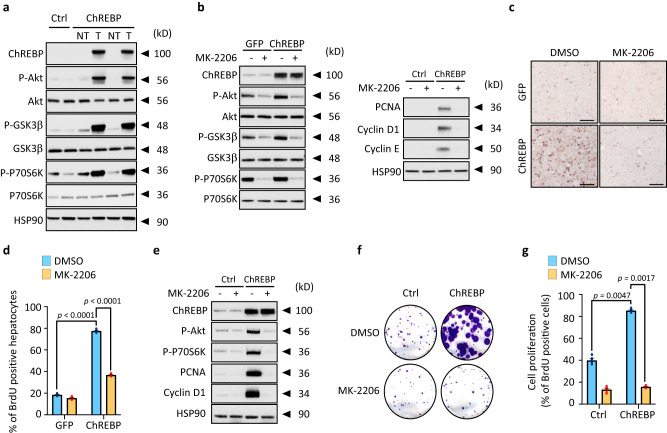
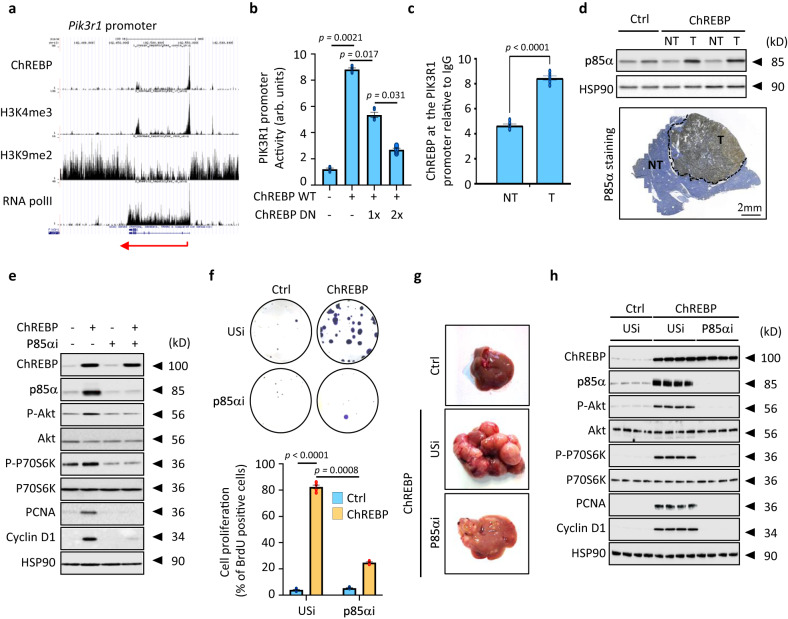
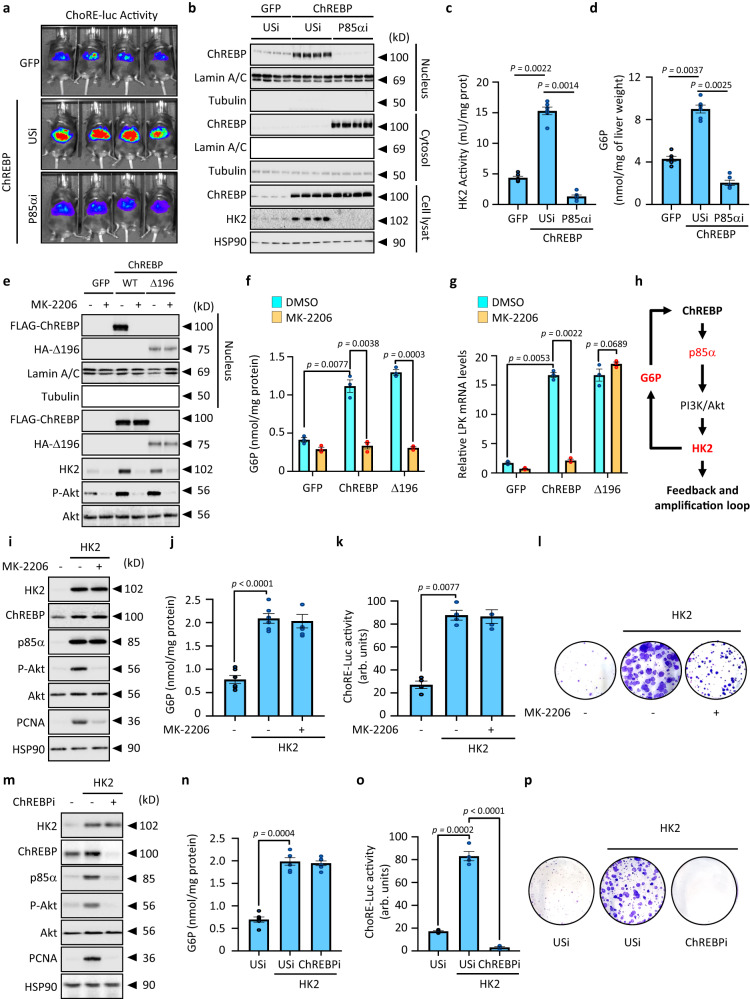
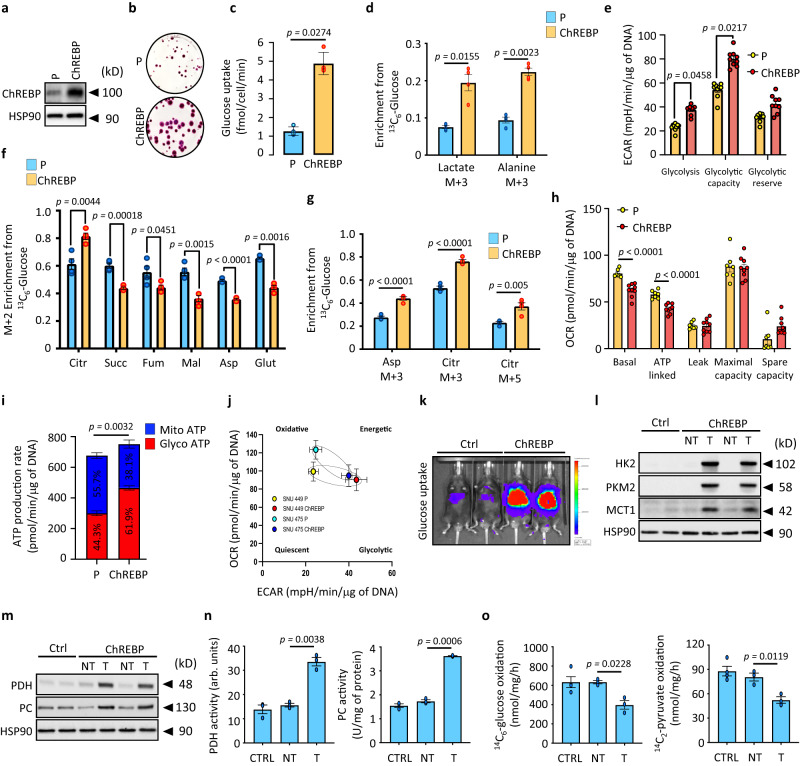
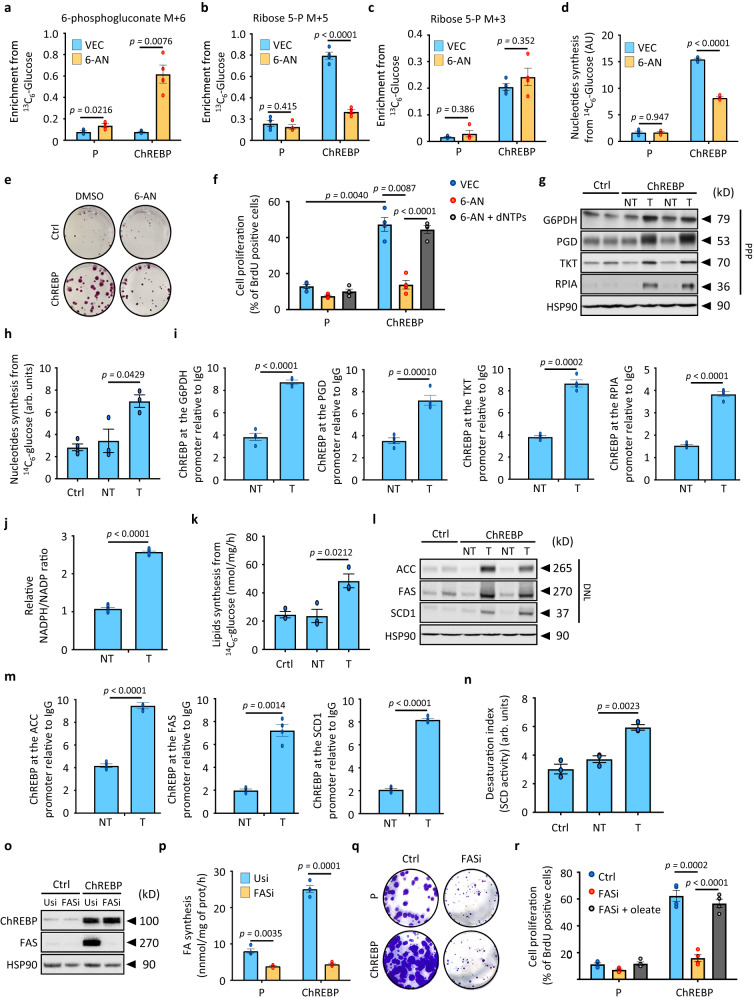
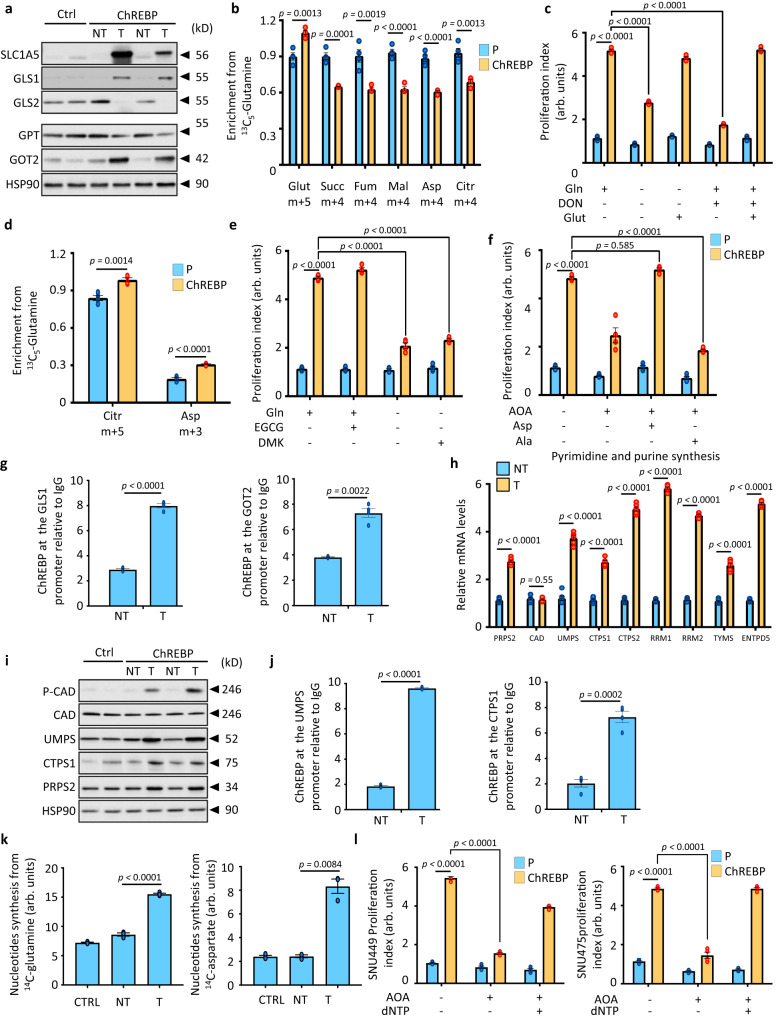
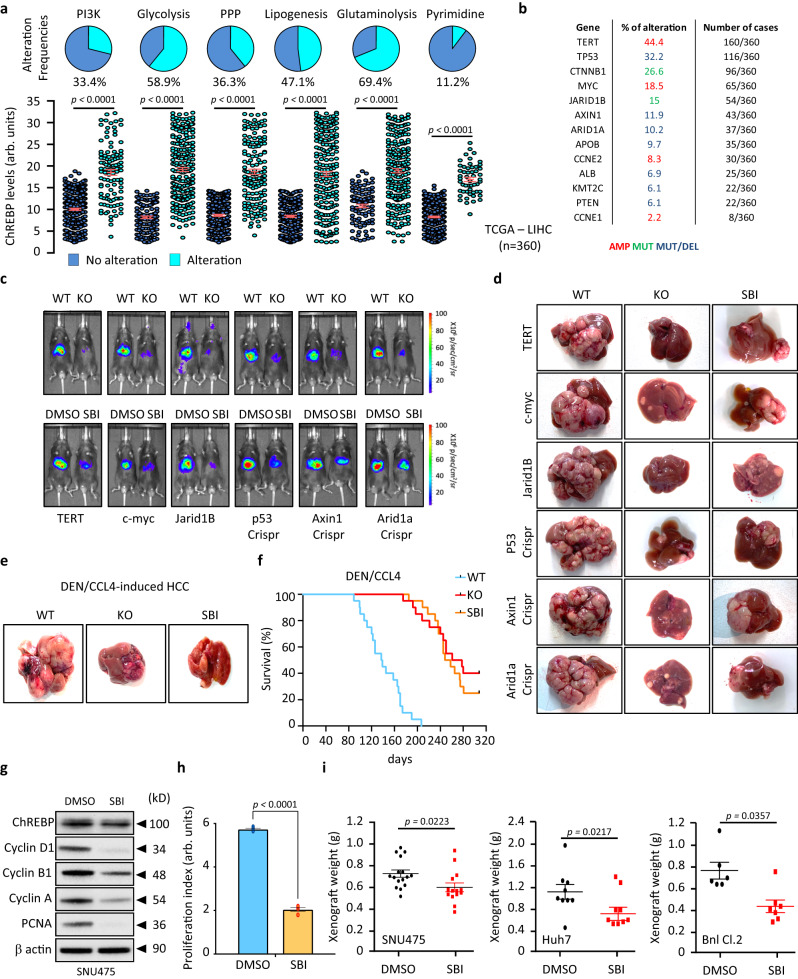
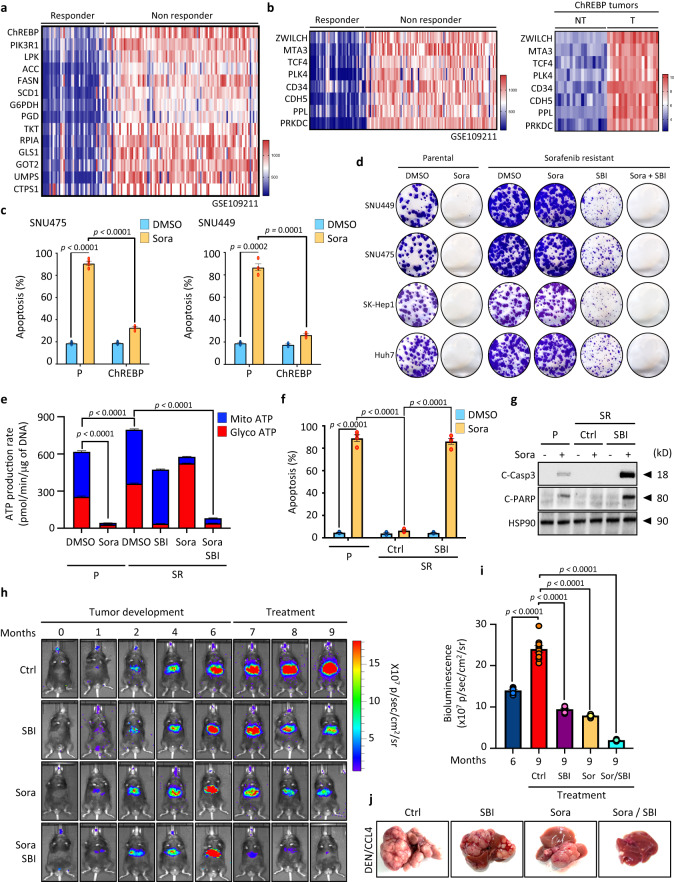
Cancer cells integrate multiple biosynthetic demands to drive unrestricted proliferation. How these cellular processes crosstalk to fuel cancer cell growth is still not fully understood. Here, we uncover the mechanisms by which the transcription factor Carbohydrate responsive element binding protein (ChREBP) functions as an oncogene during hepatocellular carcinoma (HCC) development. Mechanistically, ChREBP triggers the expression of the PI3K regulatory subunit p85α, to sustain the activity of the pro-oncogenic PI3K/AKT signaling pathway in HCC. In parallel, increased ChREBP activity reroutes glucose and glutamine metabolic fluxes into fatty acid and nucleic acid synthesis to support PI3K/AKT-mediated HCC growth. Thus, HCC cells have a ChREBP-driven circuitry that ensures balanced coordination between PI3K/AKT signaling and appropriate cell anabolism to support HCC development. Finally, pharmacological inhibition of ChREBP by SBI-993 significantly suppresses in vivo HCC tumor growth. Overall, we show that targeting ChREBP with specific inhibitors provides an attractive therapeutic window for HCC treatment.


Conflict of interest statement

The authors declare no competing interests.

Figures

Fig. 1
Fig. 1. ChREBP expression is increased in human HCC and signs tumors with poor prognosis.
a Data mining of ChREBP gene expression level between HCC (T) and normal liver tissues (N) from the LIHC and LICA-FR datasets relative to the TBP gene expression (Supplementary Data 1 and 2 and Source Data). b Heatmap showing the expression of well-described ChREBP-regulated genes in the LIHC and LICA-FR datasets relative to the TBP gene expression. c Heatmap of a 40-HCC gene signature, which classified the patients from the LIHC and LICA-FR datasets with either poor or better prognosis depending on ChREBP expression within the tumors relative to the TBP gene expression. ChREBP expression was divided into tertiles based on low, intermediate, or high expression levels. d ChREBP expression in HCC based on individual tumor grade from the LIHC and LICA-FR datasets relative to the TBP gene expression. e Kaplan–Meier analysis from the LIHC and LICA-FR Oncomine datasets depicting the overall survival rate of patients with low or high ChREBP expression levels within tumors (mRNA level, bottom 50% vs. top 50%). The tables shown below the Kaplan–Meier survival curves listed the number of patients at risk at a specific time point. f Expression profile of ChREBP and MondoA protein contents in 12 paired HCC (T) and adjacent non-tumoral tissues (N) (clinical characteristics of patients can be found as Source data provided as a Source Data file) (n = 12). a, d For all box plots, the boundary of the box closest to zero indicates the 25th percentile, a black line within the box marks the median, and the boundary of the box farthest from zero indicates the 75th percentile. Whiskers above and below the box indicate the 10th and 90th percentiles. Points above and below the whiskers indicate outliers outside the 10th and 90th percentiles (statistical analysis can be found in the Source Data file). a, d Statistical analyses were made using unpaired two-sided Student’s t test. e Significant difference in survival between cohorts was calculated using the log-rank (Mantel Cox) test. Source data are provided as a Source Data file.
Fig. 2
Fig. 2. ChREBP overexpression promotes HCC initiation and development in mice.
ac C57BL6/J male mice were injected with either GFP or ChREBP overexpressing adenovirus and were studied 3 weeks later. a ChREBP overexpressing mice exhibit hepatomegaly as shown by the increase in the ratio of liver weigh/body weight (n = 6 biologically independent mice per group). b Representative staining and quantification of liver sections with BrdU from GFP or ChREBP mice (n = 6 biologically independent mice per group). Scale bars = 100 μm. c Representative Western blot analysis of proteins of the cell cycle (n = 6 biologically independent mice per group). d Representative bioluminescent imaging depicting tumor development over time after stable ChREBP overexpression (n = 10 biologically independent mice per group). e Representative stepwise development of HCC in ChREBP overexpressing mice (n = 10 biologically independent mice per group). f Representative staining of liver sections with H&E, oil red O and specific antibodies against HA-tag (ChREBP) from ChREBP overexpressing mice (n = 10 biologically independent mice per group). NT, non-tumoral; T, tumor. Scale bar = 2 mm. g Tumors proliferation index determined by Ki67 immunostaining (representative shown out of 6 mice per group). Scale bar from magnifications of NT and T areas = 20 mm. Quantification is shown in Supplementary Fig. 2c. h Western blot analysis of proteins of the cell cycle (n = 10 biologically independent mice per group). i Top ten enriched biological processes from gene ontology analysis performed from a list of 324 genes differentially upregulated in ChREBP tumors (n = 12 biologically independent mice per group). j Heatmap indicating gene-sets significantly affected in ChREBP tumors (n = 5 biologically independent mice per group). Full list of significantly enriched gene-sets can be found in Source Data File. k Kaplan-Meier analysis depicting the survival rate of ChREBP overexpressing mice (n = 22 biologically independent mice per group). The tables shown below the Kaplan–Meier survival curves listed the number of mice at risk at the specific time point. Significant difference in survival between groups was calculated using the log-rank (Mantel Cox) test. a, b All error bars represent mean ± SEM. Statistical analyses were made using unpaired two-sided Student’s t test. Source data are provided as a Source Data file.
Fig. 3
Fig. 3. ChREBP overactivation stimulates the pro-oncogenic PI3K/AKT signaling.
a Representative Western blot analysis of the activity of the PI3K/AKT signaling in ChREBP tumors (n = 10 biologically independent mice per group). b, c Mice, injected with either GFP or ChREBP overexpressing adenovirus, were orally treated with MK-2206. Captisol (30%) was used as a vehicle for the drug and the control animals were treated with vehicle only. MK-2206 (120 mg/kg) was given orally for 3 weeks on alternate days. b Western blot analysis of the PI3K/AKT signaling and proteins of the cell cycle (n = 6 biologically independent mice per group). c Representative staining of liver sections with BrdU. Scale bars = 100 μm (d) Quantification of BrdU staining is shown (n = 6 biologically independent mice per group). eg HepG2 cells, stably overexpressing ChREBP, were treated with MK-2206 (100 nM) for 24 h. e Representative Western blot analysis of proteins of the PI3K/AKT signaling and cell cycle (n = 3 independent experiments). f Representative clonogenic assay shown (n = 3 independent experiments). g Cell proliferation index determined by measuring the % of BrdU positive cells (n = 3 independent experiments). All error bars represent mean ± SEM. Statistical analyses were determined by two-way analysis of variance (ANOVA) and Tukey’s multiple-comparisons test. Source data are provided as a Source Data file.
Fig. 4
Fig. 4. p85α drives the stimulatory effects of ChREBP on PI3K/AKT signaling and hepatocyte proliferation.
a UCSC genome browser image illustrating normalized tag counts for ChREBP, H3K4me3, H3K9me2 and RNA polII at the Pik3r1 gene promoter. b Pik3r1 promoter activity in HEK 293 cells after ChREBP overexpression. A dominant negative form of ChREBP (DN ChREBP) was co-overexpressed to antagonize ChREBP action on Pik3r1 promoter. Pik3r1 promoter activity is relative to the RSV-β-galactosidase activity (arb. units = arbitrary unit) (n = 3 independent experiments). c ChIP experiments measuring ChREBP occupancy at the Pik3r1 promoter in ChREBP tumors relative to IgG controls (n = 6 biologically independent mice per group). d (Top panel) Representative Western blot analysis of p85α expression in ChREBP tumors (n = 10 biologically independent mice per group). (Bottom panel) Representative staining of liver sections with p85α antibody from ChREBP tumors (n = 10 biologically independent mice per group). NT, non-tumoral tissue; T, tumors. Scale bar = 2 mm. e, f P85α was stably inhibited in Huh7 cell line overexpressing ChREBP through Crispr/Cas9. e Representative Western blot analysis of PI3K/AKT signaling (n = 5). f (Top panel) Representative clonogenic assays shown (n = 8 independent experiments). (Bottom panel) Cell proliferation index determined by measuring the % of BrdU positive Huh7 cells (n = 5 independent experiments). g, h P85α was stably inhibited through Crispr/Cas9 in the liver of C57BL6/J mice overexpressing ChREBP using hydrodynamic injection. g Representative of tumor morphology is shown out of 10 mice per group (n = 10 biologically independent mice per group). h Representative Western blot of ChREBP and P85α expression levels in addition to PI3K/AKT signaling in tumors (n = 10 biologically independent mice per group). All error bars represent mean ± SEM. b Statistical analyses were determined by two-way ANOVA and Tukey’s multiple-comparisons test. c Statistical analyses were determined by unpaired two-sided Student’s t test. Source data are provided as a Source Data file.
Fig. 5
Fig. 5. Hexokinase 2 is a part of an amplification loop linking glucose mediated ChREBP activation with enhanced PI3K/AKT signaling.
ad C57BL6/J male mice were injected with either GFP or ChREBP overexpressing adenovirus. Simultaneously, P85α expression was also inhibited through adenoviral-mediated shRNA delivery. Mice were study 3 weeks later. a Representative in vivo bioluminescence imaging depicting ChREBP activity on ChREBP-regulated reporter construct (ChoRE-luc) (n = 6 biologically independent mice per group). b Representative Western blot analysis of ChREBP sub-cellular localization in response to P85α silencing (n = 6 biologically independent mice per group). c Measurement of HK2 activity (n = 6 biologically independent mice per group). d Measurement of G6P concentration (n = 6 biologically independent mice per group). eh FLAG tagged WT or HA tagged Δ196 isoforms of ChREBP were overexpressed in Huh7 cells. Cells were then treated with 100 nM of MK-2206 for 24h. e Representative Western blot depicting ChREBP cellular localization and PI3K/AKT signaling in response to MK-2206 treatment (n = 3 independent experiments). f Measurement of G6P concentration (n = 3 independent experiments). g LPK expression relative to the TBP gene expression (n = 3 independent experiments). h Model of the amplification loop linking glucose mediated ChREBP activation with enhanced PI3K/AKT signaling. il HK2 was overexpressed in Huh7 cells using HK2 expressing adenovirus. After HK2 overexpression (24 h), cells were then treated with 100 nM of MK-2206 for 24 h. i Representative Western blot showing the effect of HK2 expression on PI3K/AKT signaling (n = 6 independent experiments). j Measurement of G6P concentration in Huh7 cells (n = 6 independent experiments). k Measurement of ChREBP transcriptional activity on ChoRE-luc reporter construct (n = 6 independent experiments). l Representative clonogenic assays shown (n = 6 independent experiments). mp ChREBP expression was inhibited in HK2 overexpressing Huh7 cells. m Representative Western blot depicting the activity of the PI3K/AKT signaling pathway in response to ChREBP silencing (n = 6 independent experiments). n Measurement of G6P concentration in Huh7 cells (n = 6 independent experiments). o Measurement of ChREBP transcriptional activity on ChoRE-luc reporter construct (n = 6 independent experiments). p Representative clonogenic assays shown (n = 6 independent experiments). All error bars represent mean ± SEM. All statistical analyses were made using two-way ANOVA and Tukey’s multiple-comparisons test. Source data are provided as a Source Data file.
Fig. 6
Fig. 6. ChREBP overexpression reroutes glucose metabolism away from oxidation to support glycolysis.
ChREBP was stably overexpressed using the Crispr/Cas9 technology in SNU449 hepatoma cell line. a Representative Western blot illustrating stable ChREBP overexpression. b Representative clonogenic assays shown (n = 3 independent experiments). c Rate of glucose uptake (n = 5 independent experiments). d Enrichment in (m+3) lactate and (m+3) alanine from 13C6-glucose in response to ChREBP overexpression (n = 4 independent experiments). e Graph showing glycolysis, glycolytic capacity, and glycolytic reserve of parental and ChREBP overexpressing SNU449 (n = 9 independent experiments). Representative curve can be found in supplementary Fig. 7c. f (m+2) enrichment in citrate (citr), succinate (succ), fumarate (fum), malate (mal), aspartate (asp) and glutamate (glut) from 13C6-glucose in response to ChREBP overexpression (n = 4 independent experiments). g Enrichment in (m+3) aspartate, (m+3) and (m+5) citrate from 13C6-glucose in response to ChREBP overexpression (n = 4 independent experiments). h Graph showing basal OCR, proton leakage, maximal respiration, spare capacity, and ATP production of parental and ChREBP overexpressing SNU449 (n = 9 independent experiments). Representative profile after mitochondrial stress assay showing the OCR of these SNU449 cells can be found in Supplementary Fig. 7d. i ATP production rate from glycolysis or oxidative phosphorylation in parental or ChREBP overexpressing SNU449 (n = 9 independent experiments). j Energy map charting basal OCR versus basal glycolysis values (n = 9 independent experiments). ko ChREBP was stably overexpressed in liver of C57Bl6/J mice using the SB transposon system as previously described. k Representative image of liver glucose uptake of ChREBP overexpressing mice with BiGluc probe as described in (n = 5 biologically independent mice per group). l Representative Western blot analysis of glycolytic enzymes (n = 10 biologically independent mice per group). m Representative Western blot analysis of PDH and PC protein content in ChREBP tumors (n = 10 biologically independent mice per group). n Measurement of PDH and PC activity (n = 3 biologically independent mice per group). o Glucose and pyruvate oxidation rate determined by measuring the production of 14CO2 from 14C6-glucose or 14C-(2)-pyruvate for 4 h (n = 4 biologically independent mice per group). All error bars represent mean ± SEM. ci Statistical analyses were determined by unpaired two-sided Student’s t test. n, o All statistical analyses were made using two-way ANOVA and Tukey’s multiple-comparisons test. Source data are provided as a Source Data file.
Fig. 7
Fig. 7. Metabolic rewiring of glucose metabolism into the PPP and de novo lipogenesis participates to ChREBP pro-proliferative effects.
ac Parental and ChREBP overexpressing SNU449 cells were treated with 6-AN (6-aminonicotinamide, 40 μM) for 24 h. Cells were then incubated for 30 min with 11 mM of 13C6-glucose. a Enrichment in (m+6) 6-phosphogluconate from 13C6-glucose (n = 4 independent experiments). b Enrichment in (m+5) ribose 5-phopshate from 13C6-glucose in response to ChREBP overexpression (n = 4 independent experiments). c Enrichment in (m+3) ribose 5-phopshate from 13C6-glucose in response to ChREBP overexpression (n = 4 independent experiments). d De novo nucleotide synthesis from parental and ChREBP overexpressing SNU449 cells incubated 6 h with 11 mM of 14C6-labeled glucose (n = 4 independent experiments). e Effect of 6-AN treatment (40 μM, 24 h) on ChREBP-mediated increase in hepatocyte proliferation was studied in SNU449 cells. Representative clonogenic assays shown (n = 7 independent experiments). f Effect of 6-AN treatment (40 μM, 24 h) and dNTPs rescue (100 μM each) on ChREBP-mediated increase in cell proliferation. Cell proliferation index was determined by measuring the % of BrdU positive cells (n = 4 independent experiments). g Representative Western blot analysis of proteins involved in PPP pathway (n = 10 biologically independent mice per group). h De novo nucleotide synthesis from 14C6-labeled glucose in ChREBP tumors (n = 3 biologically independent mice per group). i ChIP experiments measuring ChREBP occupancy at the G6PDH, PGD, TKT and RPIA promoters in ChREBP tumors relative to IgG controls (n = 4 biologically independent mice per group). j Relative NADPH/NADP ratio in ChREBP overexpressing tumors (n = 6 biologically independent mice per group). k De novo lipid synthesis from 14C6-labeled glucose in ChREBP tumors (n = 3 biologically independent mice per group). l Representative Western blot analysis of proteins involved in de novo lipogenic pathways (n = 10 biologically independent mice per group). m ChIP experiments measuring ChREBP occupancy at the ACC, FAS and SCD1 promoters in ChREBP tumors relative to IgG controls (n = 4 biologically independent mice per group). n Measurement of SCD1 activity in ChREBP tumors (n = 3 biologically independent mice per group). or FAS expression was knockdown by Crispr/Cas9 in ChREBP overexpressing SNU449 cells (FASi). o Representative Western blot showing FAS deletion in ChREBP overexpressing SNU449 (n = 3 independent experiments). p De novo lipid synthesis from 14C6-labeled glucose. SNU449 cells were incubated 6 h with 11 mM of 14C6-labeled glucose (n = 3 independent experiments). q Representative clonogenic assays shown after FAS silencing (n = 3 independent experiments). r Effect of FAS silencing and oleate supplementation (50 μM) on ChREBP-mediated increase in cell proliferation. Cell proliferation index was determined by measuring the % of BrdU positive cells (n = 3 independent experiments). All error bars represent mean ± SEM. ad, f, h, k, n, p, r Statistical analyses were made using two-way ANOVA and Tukey’s multiple-comparisons test. i, j and m Statistical analyses were determined by unpaired two-sided Student’s t test. Source data are provided as a Source Data file.
Fig. 8
Fig. 8. ChREBP favors tumor growth by channeling glutamine metabolism into de novo pyrimidine synthesis.
a Representative Western blot analysis of proteins involved in Gln processing (n = 10 biologically independent mice per group). b Enrichment in (m+5) glutamate and (m+4) succinate, (m+4) fumarate, (m+4) malate, (m+4) aspartate and (m+4) citrate from 13C5-glutamine in response to ChREBP overexpression in SNU449 cells (n = 4 independent experiments). c Proliferation index of SNU449 cells overexpressing ChREBP after Gln deprivation or GLS inhibition (n = 4 independent experiments). Glutamate (Glu) 4 mM. d Enrichment in (m+3) citrate and (m+3) aspartate from 13C5-glutamine in response to ChREBP overexpression (n = 4 independent experiments). e Proliferation index of SNU449 cells overexpressing ChREBP after GLUD1 inhibition (n = 4 independent experiments). Dimethyl-αKG (DMK) 2 mM. f Proliferation index of SNU449 cells overexpressing ChREBP after AOA treatment (n = 4 independent experiments). Aspartate (Asp) or Alanine (Ala) (0.1 mM). g ChIP experiments measuring ChREBP occupancy at the GLS1 and GOT2 promoters relative to IgG controls in ChREBP tumors (n = 3 biologically independent mice per group). h Expression of genes involved in purine and pyrimidine synthesis relative to the TBP gene expression (n = 12 biologically independent mice per group). i Representative Western blot analysis of proteins involved in de novo pyrimidine synthesis (n = 10 biologically independent mice per group). j ChIP experiments measuring ChREBP occupancy at the UMPS and CTPS1 promoters in ChREBP tumors relative to IgG controls (n = 4 biologically independent mice per group). k Measurement of de novo nucleotide synthesis from 14C5-labeled Gln and 14C4-labeled Asp in ChREBP tumors (n = 3 independent experiments). l Proliferation index of SNU449 and SNU475 cells overexpressing ChREBP after dNTPs supplementation (100 mM each) and AOA treatment (n = 3 independent experiments). All error bars represent mean ± SEM. b, d, g, h, j Statistical analyses were determined by unpaired two-sided Student’s t test. c, e, f, k, i Statistical analyses were made using two-way ANOVA and Tukey’s multiple-comparisons test. Source data are provided as a Source Data file.
Fig. 9
Fig. 9. ChREBP represents a promising target for HCC treatment.
a In the TCGA-LIHC cohort, correlation of ChREBP expression between tumors with or without alterations in PI3K/AKT pathway, glycolysis, PPP, lipogenesis, glutaminolysis and pyrimidine synthesis. Upper panel displays alteration frequencies of the canonical pathways. Bottom panel demonstrates that HCC tissues carrying alteration of these pathways exhibited higher ChREBP expression levels. b Frequency of alteration of main oncogenes or tumor suppressors in HCC from the TCGA LIHC cohort. Amplification (AMP), mutation (MUT) and deletion (DEL) (c, d) HCC development was induced in WT or liver-specific ChREBP deficient mice (KO) by stably overexpressing either TERT, c-myc or jarid1B using the SB transposon system. HCC development was also induced by stably inhibiting the expression of p53, axin1 or arid1a using hydrodynamic injections. In these genetic models of HCC development, SBI-993 was also injected twice a week at 50 mg/kg in WT mice to determine whether pharmacological inhibition of ChREBP can reduce tumor development. c Representative bioluminescent imaging depicting tumor development in response to TERT, c-myc or jarid1B overexpression or in response to p53, axin1 or arid1a knockdown (n = 20 biologically independent mice per group). d Representative macroscopic images of HCC development in response to TERT, c-myc or jarid1B overexpression or in response to p53, axin1 or arid1a knockdown (n = 20 biologically independent mice per group). e, f HCC development was induced in either WT or liver specific ChREBP deficient mice by i.p injection of DEN (100 mg/kg) at day 15 postpartum followed by 25 biweekly i.p injections of CCl4 (0.5 ml/kg). Mice were studied at 12 months (n = 20 biologically independent mice per group). SBI-993 was also injected twice a week at 50 mg/kg in WT mice during DEN/CCL4 treatment to determine whether pharmacological inhibition of ChREBP can reduce tumor development (n = 20 biologically independent mice per group). e Representative images of HCC development shown (n = 20 biologically independent mice per group). f Kaplan–Meier analysis depicting mice overall survival rate (n = 20 biologically independent mice per group). Number of mice at risk at the specific time point can be found in the Source Data file. WT vs SBI p < 0.0001. WT vs KO p < 0.0001. KO vs SBI p = 0.635. g Representative Western blot analysis of cell cycle proteins in parental SNU475 cells treated with SBI-993 (20 μM) (n = 3 independent experiments). h Proliferation index of SNU475 cells (n = 3 independent experiments). i Xenograft mouse model using parental SNU475, Huh7 and Bnl Cl.2 cells. After engraftment, Nude mice were daily injected with SBI-993 (50 mg/kg) for 3 weeks. Tumor weight shown at 3 weeks (SNU475 n = 16, Huh7 n = 9, Bnl Cl.2 n = 6 biologically independent mice per group). All error bars represent mean ± SEM. a, h, i Statistical analyses were determined by unpaired two-sided Student’s t test. f Significant difference in survival between cohorts was calculated using the log-rank (Mantel Cox) test. Source data are provided as a Source Data file.
Fig. 10
Fig. 10. Enhanced ChREBP activity participates to sorafenib resistance.
a Data mining of the expression levels of ChREBP and ChREBP-regulated genes in the form of an heatmap, between sorafenib responder and non-responder patients from the dataset GSE109211. b Expression of genes associated with sorafenib resistance, in the form of an heatmap, in responder and non-responder patients from the dataset GSE109211 and in ChREBP tumors (T) compared to non-tumoral tissues (NT) (n = 18 biologically independent mice per group). c Caspase 3/7 activity measured in parental or in ChREBP overexpressing SNU475 (left panel) and SNU449 (right panel) in response to 15 μM sorafenib treatment for 24 h (n = 4 independent experiments). d Representative clonogenic assays showing the effect of sorafenib (15 μM) with or without SBI-993 (40 μM) treatment on sorafenib resistant SNU449, SNU475, SK-Hep1 and Huh7 cells (n = 3 independent experiments). e ATP production rate from glycolysis or oxidative phosphorylation in parental or sorafenib resistant SNU449 cells (n = 9). P (parental), SR (sorafenib resistant clone), Sora (Sorafenib). f Effect of SBI-993 and sorafenib co-treatment on SR-SNU449 cell apoptosis (n = 4 independent experiments). g Representative Western blot depicting caspase 3 and PARP activity in SR-SNU449 cells treated with sorafenib alone or in combination with SBI-993 (n = 3 independent experiments). hj HCC was induced in C57bl6/J mice by i.p injection of DEN (100 mg/kg) at day 15 postpartum followed by 24 biweekly i.p injections of CCl4 (0.5 ml/kg). At 6 months of age, mice were then treated with sorafenib alone or in combination with SBI-993 for 3 months. Sorafenib (10 mg/kg) was given orally using Captisol (30% in water) as vehicle. SBI-993 was i.p injected at 50 mg/kg. h Representative bioluminescence imaging depicting tumor development in response to sorafenib and SBI-993 treatment (n = 10 biologically independent mice per group). i Quantification of bioluminescence activity reflecting tumor development shown (n = 10 biologically independent mice per group). j Representative macroscopic images of HCC development after sorafenib and or SBI-993 treatment (n = 10 biologically independent mice per group). All error bars represent mean ± SEM. Statistical analyses were made using two-way ANOVA and Tukey’s multiple-comparisons test. Source data are provided as a Source Data file.

References

    1. Jindal A, Thadi A, Shailubhai K. Hepatocellular carcinoma: etiology and current and future drugs. J. Clin. Exp. Hepatol. 2019;9:221–232. doi: 10.1016/j.jceh.2019.01.004. - DOI - PMC - PubMed
    1. Llovet JM, et al. Immunotherapies for hepatocellular carcinoma. Nat. Rev. Clin. Oncol. 2022;19:151–172. doi: 10.1038/s41571-021-00573-2. - DOI - PubMed
    1. Hanahan D, Weinberg RA. Hallmarks of cancer: the next generation. Cell. 2011;144:646–674. doi: 10.1016/j.cell.2011.02.013. - DOI - PubMed
    1. Kato Y, Maeda T, Suzuki A, Baba Y. Cancer metabolism: new insights into classic characteristics. Jpn Dent. Sci. Rev. 2018;54:8–21. doi: 10.1016/j.jdsr.2017.08.003. - DOI - PMC - PubMed
    1. Luengo A, Gui DY, Vander Heiden MG. Targeting metabolism for cancer therapy. Cell Chem. Biol. 2017;24:1161–1180. doi: 10.1016/j.chembiol.2017.08.028. - DOI - PMC - PubMed

MeSH terms

Substances