. 2024 Feb 29;15(1):1871.
doi: 10.1038/s41467-024-45796-w.

MYC induces CDK4/6 inhibitors resistance by promoting pRB1 degradation

Affiliations

MYC induces CDK4/6 inhibitors resistance by promoting pRB1 degradation

Jian Ma et al. Nat Commun. .

Abstract

CDK4/6 inhibitors (CDK4/6i) show anticancer activity in certain human malignancies, such as breast cancer. However, their application to other tumor types and intrinsic resistance mechanisms are still unclear. Here, we demonstrate that MYC amplification confers resistance to CDK4/6i in bladder, prostate and breast cancer cells. Mechanistically, MYC binds to the promoter of the E3 ubiquitin ligase KLHL42 and enhances its transcription, leading to RB1 deficiency by inducing both phosphorylated and total pRB1 ubiquitination and degradation. We identify a compound that degrades MYC, A80.2HCl, which induces MYC degradation at nanomolar concentrations, restores pRB1 protein levels and re-establish sensitivity of MYC high-expressing cancer cells to CDK4/6i. The combination of CDK4/6i and A80.2HCl result in marked regression in tumor growth in vivo. Altogether, these results reveal the molecular mechanisms underlying MYC-induced resistance to CDK4/6i and suggest the utilization of the MYC degrading molecule A80.2HCl to potentiate the therapeutic efficacy of CDK4/6i.


Conflict of interest statement

W.W. is a co-founder and consultant for the ReKindle Therapeutics. Z.R. is the VP of Kintor Pharmaceutical, Inc. Other authors declare no competing interests.

Figures

Fig. 1
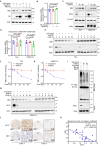
Fig. 1. High MYC expression drives resistance to CDK4/6i by masking pRB1.
a Pharmacological tests of palbociclib using mini-PDX models,, palbociclib sensitivity results for control and MYC amplified tumors. Data were shown as the mean ± SD of six mice (n = 6). Two-tailed unpaired Student’s t-test. P values based on the order of appearance: 0.0034 and 0.7280. Volcano plots showing differentially regulated genes by RNA-seq analysis from CDK4/6i treated T24 (b) and UMUC14 (c) cells. d Control or MYC-knockdown T24 cells were harvested for RNA-seq analysis and pathway analysis. Differentially regulated genes with more than 2-fold change were included in this pathway analysis. Color represents the level of significance, and P value adjusted. Data is analyzed by standard accumulative hypergeometric statistical test. e Heatmap showing the differential expression of the indicated pathway genes downregulated after MYC knockdown in T24 cells. f Control or MYC-overexpressing T24, C4-2, and MDA-MB-231 cells were harvested for western blotting with the indicated antibodies. g Quantification of colony formation of control or MYC-overexpressing T24, C4-2, and MDA-MB-231 cells treated with vehicle or palbociclib. Data were shown as the mean ± SD of three independent experiments (n = 3). Two-tailed unpaired Student’s t-test. P values based on the order of appearance: 0.0169, 0.0006 and 0.0405; 0.0014, 0.0003 and 0.1484; 0.0068, 7.61E-06 and 0.9398. h, i Control or MYC-overexpressing T24 cells were injected s.c. into the right flank of NSG mice. Tumor volume was measured at the indicated time points. Tumors were harvested and photographed on day 30 (h). In i, data were shown as the mean ± SD of five mice (n = 5). Two-way ANOVA (two-sided). P values based on the order of appearance: 0.0476 and 0.1463. Source data are provided in this paper. Similar results for f panel were obtained in three independent experiments.
Fig. 2
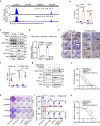
Fig. 2. High MYC expression reduces pRB1 abundance via proteasomal degradation.
293 T cells were transfected with an HA vector (EV) or HA-tagged MYC for 24 h. Cells were treated with or without MG132 for 6 h and harvested for western blotting (a) and RT‒qPCR (b). In b, data were shown as the mean ± SD of three independent experiments (n = 3). Two-tailed unpaired Student’s t-test. P values based on the order of appearance: 0.9173 and 0.1478. Control or MYC-knockdown T24 and UMUC14 cells were harvested for western blotting (c) and RT‒qPCR analyses (d). In d, Data were shown as the mean ± SD of three independent experiments (n = 3). Two-tailed unpaired Student’s t-test. P values based on the order of appearance: 0.7595, 0.7677, 0.9438 and 0.3232. Control or MYC-knockdown T24 cells were treated with 200 μg/μl CHX for Western blotting (e). Protein bands were quantified in f. In f, data were shown as the mean ± SD of three independent experiments (n = 3). Control or MYC-knockdown UMUC14 cells were treated with 200 μg/μl CHX for Western blotting (g). Protein bands were quantified in h. In h, data were shown as the mean ± SD of three independent experiments (n = 3). i Control or MYC-knockdown 293 T cells were transfected with the indicated plasmids and harvested for IP under denaturing conditions and subjected to immunoblotting. j Representative images of IHC analysis with anti-MYC and anti-RB1 antibodies on TMA (n = 40 TMA elements) tissue sections. Scale bar in 10 X fields: 200 μm; Scale bar in 40 X fields: 20 μm. k Correlation analysis of the IHC staining of MYC and pRB1 proteins in bladder cancer patient specimens. Two-sided Spearman correlation coefficient, P = 2.05E-8. Source data are provided in this paper. Similar results for (a, c, e, g and i) panels were obtained in three independent experiments.
Fig. 3
Fig. 3. The E3 ubiquitin ligase KLHL42 interacts with pRB1 and induces pRB1 proteasomal degradation.
a IP-MS ratio plot showing the normalized log2(MYC-OE/RB1) against log2(MYC-OE/IgG). Ubiquitin-associated genes are highlighted in pink. b, c Coimmunoprecipitated endogenous RB and KLHL42 proteins in T24 cells overexpressing MYC. d Schematic diagram depicting a set of truncated pRB1 constructs used in this study. e Western blot analysis of KLHL42 proteins in T24 WCL pulled down by GST or GST-RB recombinant proteins. f Schematic diagram depicting the KLHL42 deletion mutants used in this study. g 293 T cells transfected with the indicated plasmids were harvested for immunoprecipitation (IP) under denaturing conditions and subjected to immunoblotting. Control or KLHL42 knockdown T24 cells were harvested for western blotting (h) and RT‒qPCR analyses (i). In i, data were shown as the mean ± SD of three independent experiments (n = 3). Two-tailed unpaired Student’s t-test. P values based on the order of appearance: 0.0594, and 0.2288. j 293 T cells were transfected with increased Myc-KLHL42 in combination with Flag-RB1 and HA-Ub and harvested for IP under denaturing conditions and subjected to immunoblotting. k Control or KLHL42-knockdown 293 T cells were transfected with the indicated plasmids and harvested for IP under denaturing conditions and subjected to immunoblotting. Control or KLHL42-knockdown T24 cells were treated with 200 μg/μl CHX for Western blotting (l). Protein bands were quantified in m. In m, data were shown as the mean ± SD of three independent experiments (n = 3). n Correlation analysis of IHC staining of KLHL42 and pRB1 proteins in bladder cancer patient specimens. Two-sided spearman correlation coefficient, P = 0.0003. Source data are provided in this paper. Similar results for (b, c, e, g, h, j, k and l) panels were obtained in three independent experiments.
Fig. 4
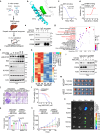
Fig. 4. KLHL42 is a transcriptional target of MYC that mediates CDK4/6i resistance.
a Screenshot of the UCSC genome browser showing ChIP-seq signal profiles of MYC in the KLHL42 gene locus in different human cell lines, as previously reported,. b ChIP‒qPCR analysis of MYC binding at the promotor of the KLHL42 gene in T24 and UMUC14 cells. Data were shown as the mean ± SD of three independent experiments (n = 3). Two-tailed unpaired Student’s t-test. P values based on the order of appearance: 0.0001, and 0.0004. Control or MYC-knockdown T24 and UMUC14 cells were harvested for western blotting (c) and RT‒qPCR analyses (d). In d, data were shown as the mean ± SD of three independent experiments (n = 3). Two-tailed unpaired Student’s t-test. P values based on the order of appearance: 0.0025, 0.0016, 0.0003, and 0.0004. e, f Representative images of IHC analysis with anti-RB1, anti-Myc and anti-KLHL42 antibodies on FFPE samples of prostate specimens from Pbsn-Cre and High Myc transgenic mice and the quantitative data of Rb1, Myc and Klhl42 staining were shown in f. Scale bar in 10 X fields: 200 μm; Scale bar in 40 X fields: 20 μm. In f, data were shown as the mean ± SD (Pbsn-cre n = 5, Hi-Myc tumor n = 8). Two-tailed unpaired Student’s t-test. P values based on the order of appearance: 0.0017, 2.66E-05, and 1.17E−06. g T24 and UMUC14 cells infected with the indicated lentivirus expressing shRNAs were harvested for western blotting. T24 and UMUC14 cells infected with the indicated lentivirus expressing shRNAs treated with vehicle or palbociclib were harvested for colony formation assay (h). In i, data were shown as the mean ± SD of three independent experiments (n = 3). Two-tailed unpaired Student’s t-test. P values based on the order of appearance: 0.0018, 0.0009, 0.0006 and 0.0004; 0.9882, 0.0002, 0.0003 and 0.0012. T24 (j) and UMUC14 (k) cells infected with the indicated lentivirus expressing shRNAs treated with palbociclib were harvested for the cell viability assay. Data were shown as the mean ± SEM of three independent experiments (n = 3). Source data are provided in this paper. Similar results for c and g panels were obtained in three independent experiments.
Fig. 5
Fig. 5. Identification of A80.2HCl as a MYC-degrading molecule.
a Workflow of in vitro and in vivo screening performed to identify A80.2HCl. b Docking simulation cartoon illustrating that A80.2HCl bound to MYC (PDB ID: 1A93). c The binding affinity between the A80.2HCl drug and MYC was measured by ITC. d The binding affinity of the A80.2HCl drug and CRBN was measured by Homogeneous Time-Resolved Fluorescence (HTRF). Data were shown as mean ± SD of three independent experiments (n = 2). e Coimmunoprecipitated endogenous CRBN, GSPT1 and MYC proteins from T24 cells. f T24 cells treated with increased quantities of A80.2HCl were harvested for western blotting. g T24 cells treated with vehicle or A80.2HCl were harvested for RNA-seq analysis and pathway analysis. Differentially regulated genes with more than 2-fold change were included in this pathway analysis. Data is analyzed by standard accumulative hypergeometric statistical test. P value adjusted. h Heatmap showing the differential expression of the indicated pathway genes suppressed by A80.2HCl treatment in T24 cells. i CRBNWT and CRBNKO T24 cells treated with vehicle and A80.2HCl were harvested for western blotting. Control or MYC-knockdown T24 and UMUC14 cells treated with A80.2HCl were harvested for colony formation assay (j). In k, data were shown as the mean ± SD of three independent experiments (n = 3). Two-tailed unpaired Student’s t-test. P values based on the order of appearance: 0.0005, 0.4652, 0.0005 and 0.6992. l Control or MYC-knockdown T24 cells treated with A80.2HCl were harvested for cell viability assay. Data were shown as the mean ± SEM of three independent experiments (n = 3). m, n Control or MYC-knockdown T24 cells were injected s.c. into the right flank of NSG mice and treated with the indicated drugs. Tumor was measured at the indicated time points and harvested on day 30 (m). In n, data were shown as the mean ± SD of five mice (n = 5). Two-way ANOVA (two-sided). P values based on the order of appearance: <0.0001 and 0.6673. o Biodistribution of A80.2HCl in T24 xenograft models. Source data are provided in this paper. Similar results for (e, f and i) panels were obtained in three independent experiments.
Fig. 6
Fig. 6. A80.2HCl potentiates the therapeutic efficacy of CDK4/6i.
a T24 cells treated with the indicated drugs were harvested for RNA-seq analysis, and heatmap showing the differential expression of the indicated pathway genes. b Venn diagram showing the overlapping downregulated genes after the indicated treatment of T24 cells. c Pathway analysis of 1609 genes downregulated after A80.2HCl + palbociclib treatment. Differentially regulated genes with more than 2-fold change were included in this pathway analysis. Color represents the level of significance, and P value adjusted. Data is analyzed by standard accumulative hypergeometric statistical. T24 (d) and UMUC14 (e) cells treated with the indicated drugs were harvested for cell viability assays. Data were shown as the mean ± SEM of three independent experiments (n = 3). T24 and UMUC14 cells treated with the indicated drugs were harvested for colony formation assay (f). In g, data were shown as the mean ± SD of three independent experiments (n = 3). Two-tailed unpaired Student’s t-test. P values based on the order of appearance: 0.0065, 0.0024, 0.9214 and 0.0003. h T24 cells were injected s.c. into the right flank of NSG mice, which were treated with the indicated drugs. Tumor volume was measured at the indicated time points. Data were shown as the mean ± SD of five mice (n = 5). Two-way ANOVA (two-sided). P values based on the order of appearance: 0.0235 and 0.0048. i Drug sensitivity analysis with mini-PDX models of breast cancer tissues with MYC amplification. Data were shown as the mean ± SD of six mice (n = 6). Two-tailed unpaired Student’s t-test. P values based on the order of appearance: 0.3279, and 0.0005. Source data are provided in this paper.
Fig. 7
Fig. 7. A schematic illustration of the working model.
MYC amplification drives CDK4/6i resistance by activating an E3 ligase KLHL42, which is responsible for pRB1 ubiquitination and degradation, and subsequently confers resistance to CDK4/6i. A MYC degrader A80.2HCl that can efficiently reduce MYC protein level protects pRB1 and overcomes CDK4/6i resistance. The combination of A80.2HCl and CDK4/6i sheds light on potentially strategies for cancer treatment.

References

    1. Alvarez-Fernandez M, Malumbres M. Mechanisms of sensitivity and resistance to CDK4/6 inhibition. Cancer Cell. 2020;37:514–529. doi: 10.1016/j.ccell.2020.03.010. - DOI - PubMed
    1. Goel S, et al. CDK4/6 inhibition triggers anti-tumour immunity. Nature. 2017;548:471–475. doi: 10.1038/nature23465. - DOI - PMC - PubMed
    1. Patnaik A, et al. Efficacy and safety of Abemaciclib, an Inhibitor of CDK4 and CDK6, for patients with breast cancer, non-small cell lung cancer, and other solid tumors. Cancer Discov. 2016;6:740–753. doi: 10.1158/2159-8290.CD-16-0095. - DOI - PubMed
    1. Finn RS, et al. Palbociclib and Letrozole in advanced breast cancer. N. Engl. J. Med. 2016;375:1925–1936. doi: 10.1056/NEJMoa1607303. - DOI - PubMed
    1. Yang C, et al. Acquired CDK6 amplification promotes breast cancer resistance to CDK4/6 inhibitors and loss of ER signaling and dependence. Oncogene. 2017;36:2255–2264. doi: 10.1038/onc.2016.379. - DOI - PMC - PubMed

Substances