. 2024 Feb 29;15(1):1791.
doi: 10.1038/s41467-024-46033-0.

Exploring the gut DNA virome in fecal immunochemical test stool samples reveals associations with lifestyle in a large population-based study

Affiliations

Exploring the gut DNA virome in fecal immunochemical test stool samples reveals associations with lifestyle in a large population-based study

Paula Istvan et al. Nat Commun. .

Abstract

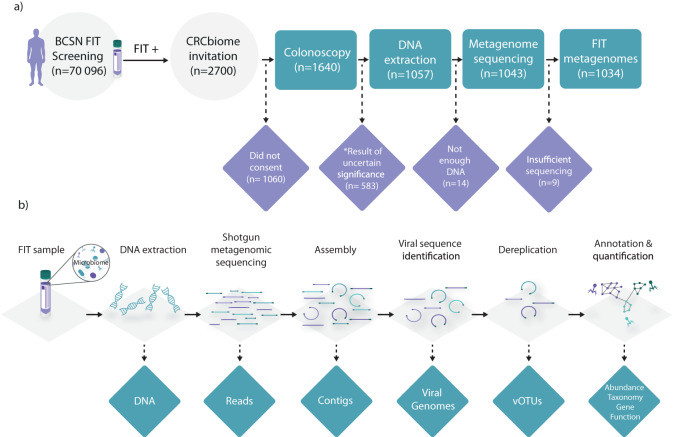
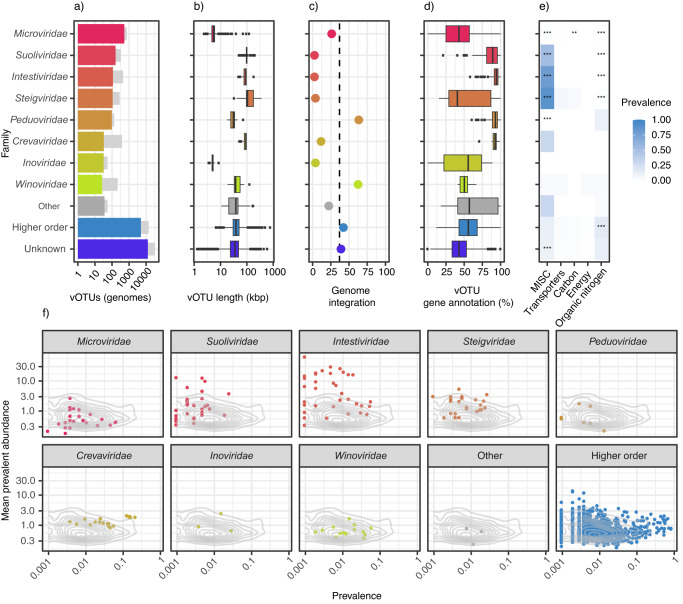
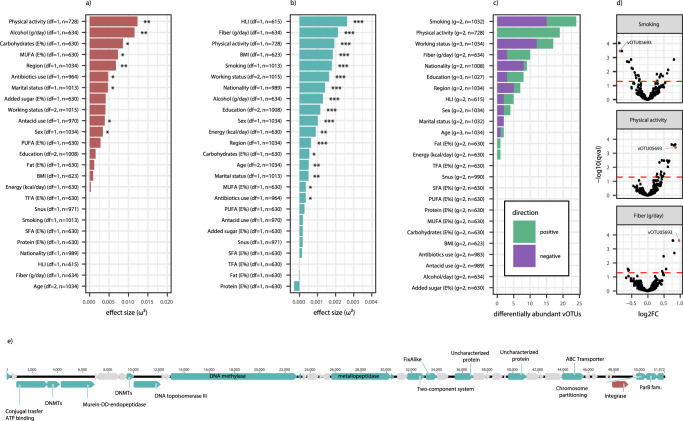
Stool samples for fecal immunochemical tests (FIT) are collected in large numbers worldwide as part of colorectal cancer screening programs. Employing FIT samples from 1034 CRCbiome participants, recruited from a Norwegian colorectal cancer screening study, we identify, annotate and characterize more than 18000 DNA viruses, using shotgun metagenome sequencing. Only six percent of them are assigned to a known taxonomic family, with Microviridae being the most prevalent viral family. Linking individual profiles to comprehensive lifestyle and demographic data shows 17/25 of the variables to be associated with the gut virome. Physical activity, smoking, and dietary fiber consumption exhibit strong and consistent associations with both diversity and relative abundance of individual viruses, as well as with enrichment for auxiliary metabolic genes. We demonstrate the suitability of FIT samples for virome analysis, opening an opportunity for large-scale studies of this enigmatic part of the gut microbiome. The diverse viral populations and their connections to the individual lifestyle uncovered herein paves the way for further exploration of the role of the gut virome in health and disease.


Conflict of interest statement

The authors declare no competing interests.

Figures

Fig. 1
Fig. 1. Study design.
a participant flowchart. 2700 FIT-positive Bowel Cancer Screening in Norway (BCSN) participants were invited to the study. Excluded samples are indicated in purple. *Participants were excluded if they had findings of uncertain clinical significance, i.e., a low number of non-advanced adenomas or non-advanced sessile serrated lesions. b Workflow for virome characterization. DNA was extracted from the FIT leftover buffer. Shotgun metagenomic sequencing was performed on the Illumina platform and the resulting reads were assembled using metaSPAdes. Viral genomes were identified using Virsorter2, and then dereplicated using Galah. Representative vOTUs were taxonomically annotated using vConTACT2. DRAM-v was used for annotation of gene function. For details, see Methods. Created using Adobe Illustrator.
Fig. 2
Fig. 2. Quality assessment of the virome dataset.
a Histograms of measures by sample including storage time, DNA concentration, number of sequencing reads, number of metagenome contigs, assembly N50, number of viral genomes, vOTUs observed after read mapping, and alpha diversity (inverse Simpson index). b Pairwise Spearman’s rank correlation coefficients (rho) of the measures in (a). All correlations were statistically significant (FDR < 0.05), except for those with coefficients enclosed in parentheses. c, d Principal coordinate analysis (PCoA) of c Jaccard distances derived from pairwise comparison of the identified viral genomes, and d Bray-Curtis distances derived from the abundance of CRCbiome vOTUs, in paired FIT and Norgen samples. Genomes with more than 95% ANI were considered to represent the same genome. Paired samples at the same level of subsampling are indicated by a connecting line, with the color representing the number of raw sequencing reads used as input, and with triangles representing FIT samples and points representing Norgen samples.
Fig. 3
Fig. 3. Clustering of the vOTUs based on their gene similarity on a protein level.
Green - vOTUs that had taxonomic family annotation; orange - vOTUs that were assigned taxonomic order, but not family; gray - vOTUs with no taxonomic assignment; purple - reference viral genomes. Outlier vOTUs (those with no significant associations) were excluded from visualization.
Fig. 4
Fig. 4. Genome annotation and population distribution.
a Taxonomic classification of vOTUs at the family level. The vOTUs belonging to families with fewer than 20 representatives are categorized as “other”. The “unknown” group constitutes those not clustering with any reference genomes, whereas those clustering with reference genomes annotated at higher levels are labeled “higher order”. Light gray bars indicate the total number of genomes (pre-dereplication) according to the taxonomic assignment of their representative vOTUs. b Genome size distribution for genomes belonging to each taxonomic category. For stratification by completeness, see Supplementary Fig. 1. c The percentage of viral genomes classified as integrated. The dashed line represents the overall percentage of integrated genomes. See Supplementary Table 5 for details. d Percentage of annotated genes per vOTUs according to viral family. e The fraction of genomes carrying genes annotated with AMGs by AMG category and family. Asterisks indicate significant deviations in AMG category prevalence for one family when compared to the rest (post-hoc two-sided Fisher exact test, *p < 0.05, **p < 0.01, ***p < 0.001; p-adjustment by Bonferroni). MISC Miscellaneous, Carbon Carbon utilization. f Prevalence and mean abundance (if detected) for vOTUs with at least 2 constituent genomes by taxonomic assignment. The 2D density contour lines indicate the overall distribution of prevalence and abundance for vOTUs (≥2 constituent genomes). In b and d the borders of the boxes span the first (Q1) to third (Q3) quartiles, with the middle line representing the median. Whiskers extend to the most extreme point in the dataset but not further than Q1-1.5IQR (lower limit) and Q3 + 1.5IQR (higher limit). Outliers are shown as individual points.
Fig. 5
Fig. 5. Associations of viral diversity with diet, lifestyle, and demographic variables.
a Effect sizes of alpha diversity of vOTU abundance as measured by the inverse Simpson index by two-sided ANOVA. b Effect sizes of associations between vOTU beta diversity (Bray-Curtis index) by PERMANOVA. Effect sizes for alpha and beta diversity are derived using the omega-squared measure from ANOVA tests of the association between diversity measures and each variable, with correction for sample sequencing coverage. *p < 0.05, **p < 0.01, ***p < 0.001; exact p-values are given in Supplementary Data 2 and Supplementary table 6. c Number of significantly differentially abundant vOTUs identified by MaAsLin2, colored by direction of association. For continuous variables, the top and bottom tertiles were compared. Details are available in Supplementary Data 3. d Volcano plots showing the relationship between effect size (log2 fold change) and significance level (q-value) for vOTUs for physical activity, smoking, and fiber intake, from top to bottom. The red dotted line indicates the significance threshold. MUFA mono-unsaturated fatty acids, PUFA poly-unsaturated fatty acids, TFA trans fatty acids, SFA short-chain fatty acids, BMI body mass index, HLI healthy lifestyle index. e Genomic map representation of CRCbiome_vOTU05693, associated with smoking, physical activity, and dietary fiber intake, with predicted genes with annotations in green, without annotations in gray, and integrase gene annotation highlighted in red.

Similar articles

Cited by

References

    1. Nayfach S, et al. Metagenomic compendium of 189,680 DNA viruses from the human gut microbiome. Nat. Microbiol. 2021;6:960–970. doi: 10.1038/s41564-021-00928-6. - DOI - PMC - PubMed
    1. Gregory AC, et al. The gut virome database reveals age-dependent patterns of virome diversity in the human gut. Cell Host Microbe. 2020;28:724–740.e8. doi: 10.1016/j.chom.2020.08.003. - DOI - PMC - PubMed
    1. Nishijima S, et al. Extensive gut virome variation and its associations with host and environmental factors in a population-level cohort. Nat. Commun. 2022;13:5252. doi: 10.1038/s41467-022-32832-w. - DOI - PMC - PubMed
    1. Shah SA, et al. Expanding known viral diversity in the healthy infant gut. Nat. Microbiol. 2023;8:986–998. doi: 10.1038/s41564-023-01345-7. - DOI - PMC - PubMed
    1. Camarillo-Guerrero LF, Almeida A, Rangel-Pineros G, Finn RD, Lawley TD. Massive expansion of human gut bacteriophage diversity. Cell. 2021;184:1098–1109.e9. doi: 10.1016/j.cell.2021.01.029. - DOI - PMC - PubMed