. 2024 Feb 29;15(1):1880.
doi: 10.1038/s41467-024-46090-5.

Specificity, synergy, and mechanisms of splice-modifying drugs

Affiliations

Specificity, synergy, and mechanisms of splice-modifying drugs

Yuma Ishigami et al. Nat Commun. .

Abstract

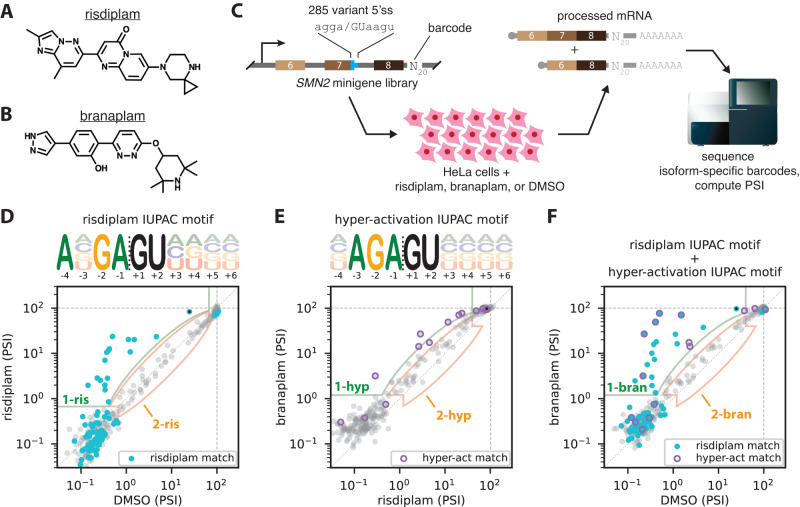
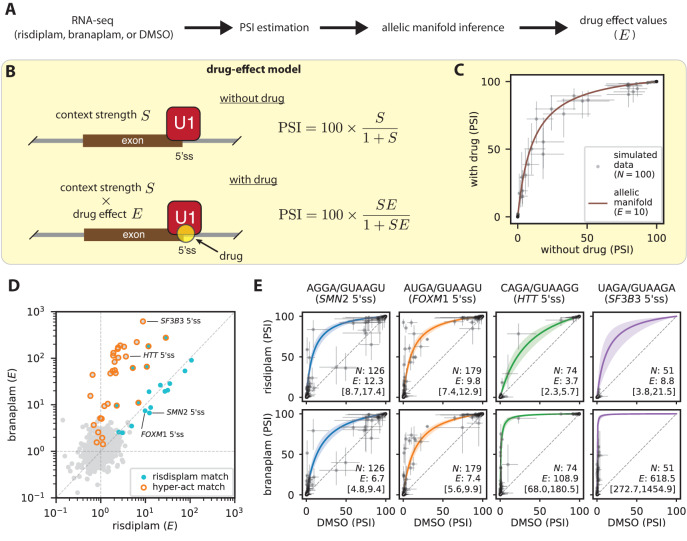
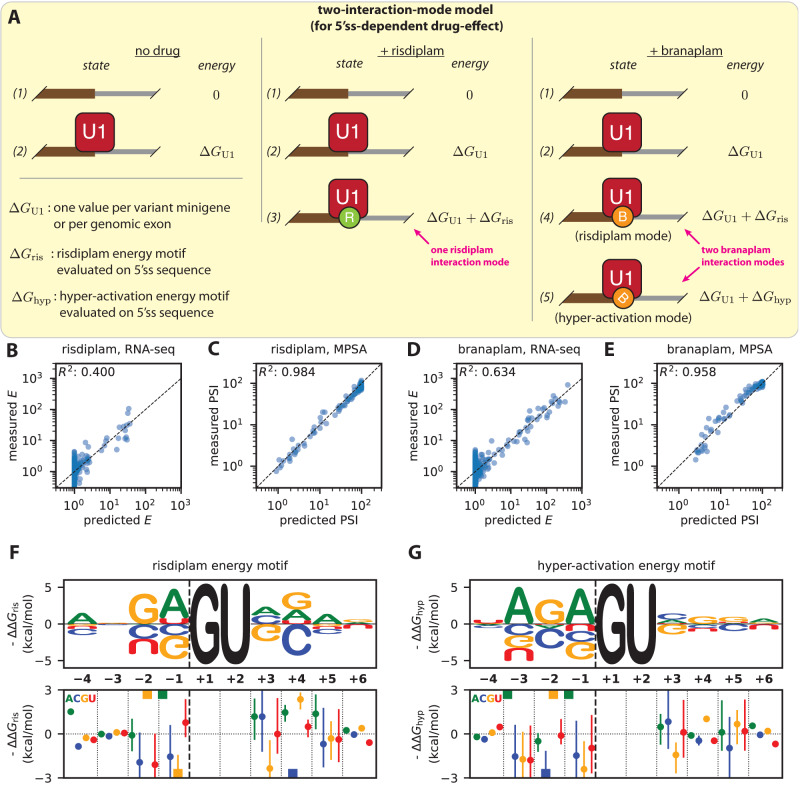
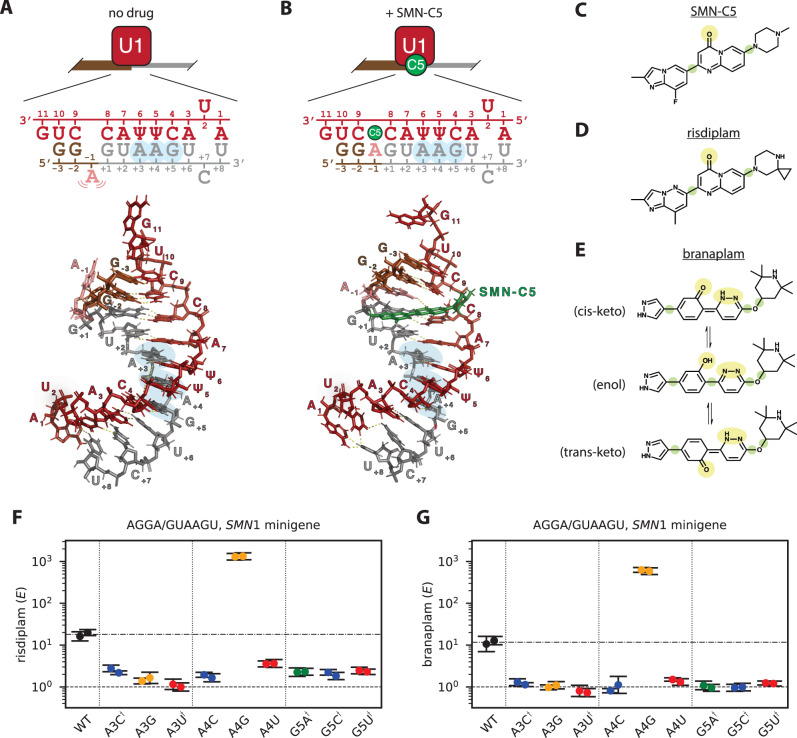
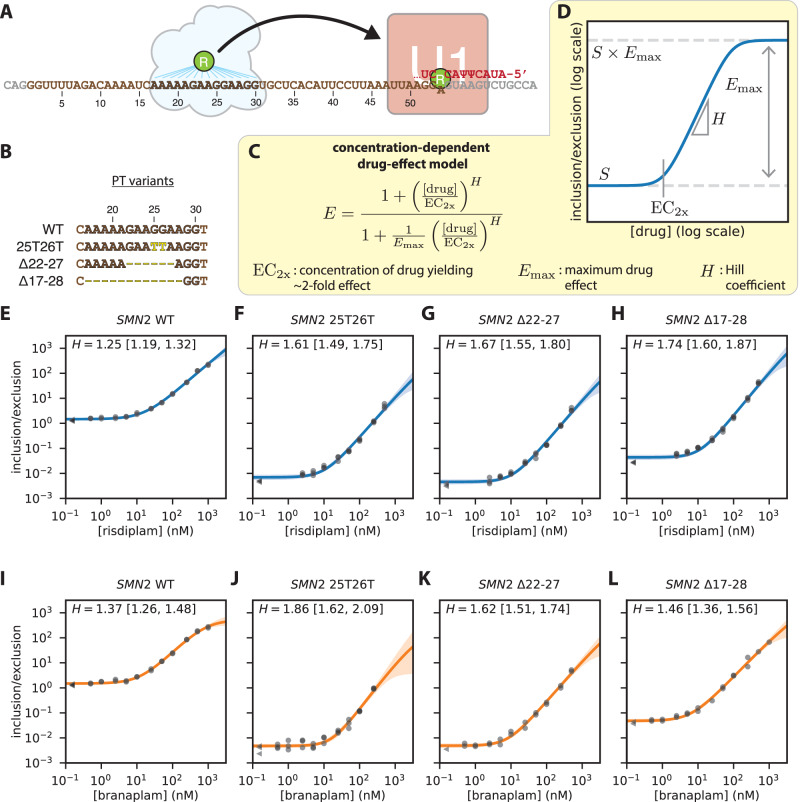
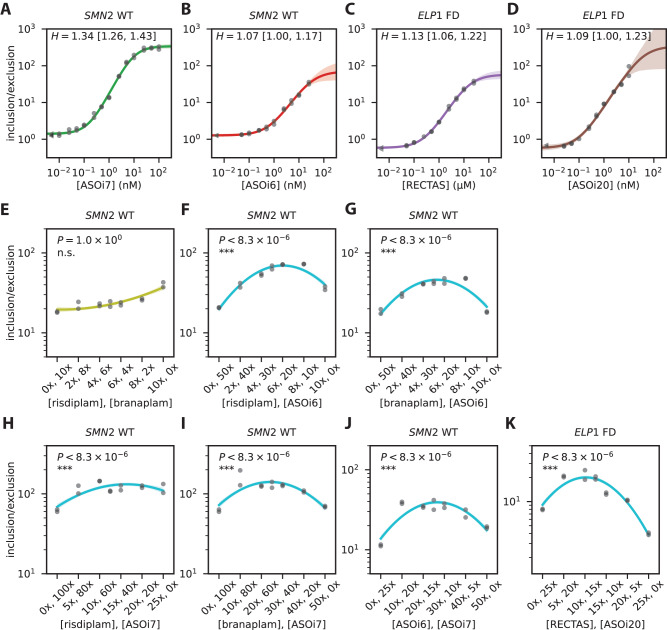
Drugs that target pre-mRNA splicing hold great therapeutic potential, but the quantitative understanding of how these drugs work is limited. Here we introduce mechanistically interpretable quantitative models for the sequence-specific and concentration-dependent behavior of splice-modifying drugs. Using massively parallel splicing assays, RNA-seq experiments, and precision dose-response curves, we obtain quantitative models for two small-molecule drugs, risdiplam and branaplam, developed for treating spinal muscular atrophy. The results quantitatively characterize the specificities of risdiplam and branaplam for 5' splice site sequences, suggest that branaplam recognizes 5' splice sites via two distinct interaction modes, and contradict the prevailing two-site hypothesis for risdiplam activity at SMN2 exon 7. The results also show that anomalous single-drug cooperativity, as well as multi-drug synergy, are widespread among small-molecule drugs and antisense-oligonucleotide drugs that promote exon inclusion. Our quantitative models thus clarify the mechanisms of existing treatments and provide a basis for the rational development of new therapies.


Conflict of interest statement

A.R.K. is an inventor on issued nusinersen patents licensed by CSHL to Ionis Pharmaceuticals and Biogen; an inventor on an issued patent for familial dysautonomia ASOs; a co-founder, Director, Chair of the SAB, and shareholder of Stoke Pharmaceuticals; a paid consultant for Biogen; a collaborator of Ionis Pharmaceuticals; and a member of the SABs and shareholder of Skyhawk Pharmaceuticals, Envisagenics, Autoimmunity BioSolutions, and assembl.cns. Other authors declare no competing interests.

Figures

Fig. 1
Fig. 1. MPSAs reveal IUPAC motifs for the 5’ss specificities of risdiplam and branaplam.
A, B Structures of (A) risdiplam and (B) branaplam. C MPSA performed in the context of a minigene library spanning exons 6, 7, and 8 of SMN2. In this library, the 5’ss of exon 20 was replaced by 285 variant 5’ss sequences of the form agga/GUaagu, where lower-case letters indicate mutagenized positions. DF PSI values measured in the presence of (D) risdiplam vs. DMSO, (E) branaplam vs. risdiplam, or (F) branaplam vs. DMSO. Black dots, wild-type SMN2 exon 7 5’ss (AGGA/GUAAGU). Cyan dots, 5’ss that match the risdiplam IUPAC motif. Purple circles, 5’ss that match the hyper-activation IUPAC motif. Light green outlined areas, 5’ss classified as activated by y-axis treatment relative to x-axis treatment (class 1-ris in panel D, class 1-hyp in panel E, class 1-bran in panel F). Peach outlined areas, 5’ss classified as insensitive to y-axis treatment relative to x-axis treatment (class 2-ris in panel D, class 2-hyp in panel E, class 2-bran in panel F). MPSA, massively parallel splicing assay. 5’ss, 5’ splice site. PSI, percent spliced in. DMSO, dimethyl sulfoxide.
Fig. 2
Fig. 2. RNA-seq measurements of drug effect are consistent with IUPAC motifs for the 5’ss specificities of risdiplam and branaplam.
A Experimental and computational approach for measuring 5’ss-specific drug effects by RNA-seq. B Allelic manifold model for PSI as a function of 5’ss-specific drug effect (quantified by E; E=1 in the absence of drug) and locus-specific context strength (quantified by S). See Fig. S5 for a derivation of this model as a biophysical model defined by states and Gibbs free energies. C Example allelic manifold and simulated RNA-seq data. D Scatter plot of drug effects determined for 2521 distinct 5’ss sequences occurring in at least 10 exons identified by rMATS; see SI Sec. 1.7 for details. 5’ss sequences matching the risdiplam IUPAC motif and/or hyper-activation IUPAC motif are indicated. SMN2 5’ss: AGGA/GUAAGU, sequence of the 5’ss of SMN2 exon 7. FOXM1 5’ss: AUGA/GUAAGU, sequence of the alternative 5’ss of FOXM1 exon 9. HTT 5’ss: CAGA/GUAAGG, sequence of the 5’ss of HTT pseudoexon 50a. SF3B3 5’ss: UAGA/GUAAGA, sequence of the 5’ss of SF3B3 pseudoexon 2a. E Allelic manifolds determined for the four 5’ss sequences annotated in panel D. N, number of exons identified by rMATS and having the indicated 5’ss. E, 5’ss-dependent drug effect inferred by Bayesian curve fitting (median and 95% posterior credible interval). PSI, percent spliced in. 5’ss, 5’ splice site. DMSO, dimethyl sulfoxide.
Fig. 3
Fig. 3. Biophysical model for the sequence specificity of risdiplam and branaplam.
A The “two-interaction-mode model” for how risdiplam and branaplam affect splicing. PSI is assumed to be 100 times the equilibrium occupancy of U1 binding to the 5’ss. Model assumes three sequence-dependent Gibbs free energies: ΔGU1, energy of U1 binding to the 5’ss; ΔGris, energy of risdiplam binding to the U1/5’ss complex or of branaplam binding to the U1/5’ss complex in the “risdiplam mode”; ΔGhyp, Gibbs free energy of branaplam binding to the U1/5’ss complex in the “hyper-activation mode”. Model parameters were inferred from the PSI values measured by MPSA on cells treated with DMSO, risdiplam, or branaplam (Fig. 1D–F), as well as from drug effect values E for risdiplam or branaplam determined by the RNA-seq (Fig. 2D). See text, SI Sec. 3.2, and SI Sec. 4.2 for additional information. BE Experimentally measured vs. model-predicted PSI values and drug-effect values. PSI values are from the SMN2 exon 7 MPSA performed on cells treated with risdiplam or branaplam (Fig. 1); drug-effect values are from the RNA-seq analysis in Fig. 2. F, G Inferred single-nucleotide effects for (F) the “risdiplam energy motif” and (G) the “hyper-activation energy motif”. Top panels show median parameter values illustrated as sequence logos. Bottom panels show medians (colored dots, with colors corresponding to each of the four RNA bases as indicated) and 95% credible intervals (colored lines) for motif parameters. Colored squares, median values that lie outside the y-axis limits. 5’ss, 5’ splice site. MPSA, massively parallel splicing assay.
Fig. 4
Fig. 4. Risdiplam and branaplam specificities are incompletely explained by the bulge-repair mechanism.
A, B Bulge-repair mechanism proposed for the specificity of risdiplam. NMR structures (PDB:6HMI [10.2210/pdb6HMI/pdb] and PDB:6HMO [10.2210/pdb6HMO/pdb], from ref. ) show a U1 RNA/5’ss RNA complex in the (A) presence and (B) absence of SMN-C5, a risdiplam analog. A schematic of each structure is also shown. Red, U1 snRNA; brown, exonic 5’ss RNA; gray, intronic 5’ss RNA; green, SMN-C5; salmon, bulged A−1 stabilized by SMN-C5. Blue highlight, intronic positions observed to affect the activities of risdiplam and branaplam in panels (F) and (G). CE Structures of (C) SMN-C5, (D) risdiplam, and (E) three tautomeric forms of branaplam (cis-keto, enol, and trans-keto). Yellow highlight, potential hydrogen-bonding partners for the amino group of A−1. Green highlight, rotational degree of freedom. F, G qPCR validation of intronic specificities for (F) risdiplam and (G) branaplam, assayed on the indicated single-nucleotide variants of AGGA/GUAAGU in the context of an SMN1 minigene. E denotes drug effect, which was measured by qPCR as described in SI Sec. 1.8. Note that E=1 corresponds to no drug effect. Dots, n = 2 biological replicates; error bars, standard error across n = 4 technical replicates; dashed line, no effect; dashed/dotted line, wild-type effect value (geometric mean of biological replicates). Daggers indicate 5’ss variants for which the dominant inclusion isoform uses a cryptic 5’ss at position +52 of SMN1 intron 7.
Fig. 5
Fig. 5. Dose-response curves falsify the two-site hypothesis for risdiplam.
A Two-site hypothesis for risdiplam activity at SMN2 exon 7. Cloud, proteins hypothesized to mediate the effect of risdiplam at the PT of SMN2 exon 7 [hnRNP G (ref. ) or FUBP1 and KHSRP (ref. )]. B PT variants assayed in SMN2 minigenes. C Empirical model for concentration-dependent drug activity; see also Fig. S11. D Schematic illustration of model predictions for the inclusion/exclusion ratio as a function of drug concentration, as well as how model parameters shape this function. EH Risdiplam titration curves for SMN2 exon 7 minigenes containing (E) the wild-type PT or (FH) mutated PTs. IL Branaplam titration curves for SMN2 exon 7 minigenes containing (I) the wild-type PT or (JL) mutated PTs. Dots and triangles, median qPCR measurements of n = 4 technical replicates, shown for n = 3 biological replicates at nonzero drug concentration (dots) or zero drug concentration (triangles). Lines and shaded regions, predictions (median and 95% credible interval) of inferred dose-response curves. H, inferred Hill coefficients (median and 95% credible interval). PT, purine tract.
Fig. 6
Fig. 6. Anomalous cooperativity and multi-drug synergy among splice-modifying drugs.
A, B Single-drug dose-response curves for SMN2 exon 7 in response to (A) ASOi7 and (B) ASOi6. C, D Single-drug dose-response curves for ELP1 exon 20 in response to (C) RECTAS and (D) ASOi20. Dots, median qPCR measurements of n = 4 technical replicates, shown for n = 2 biological replicates. Lines and shaded regions, predictions (median and 95% credible interval) of inferred dose-response curves. EJ Two-drug linear-mixture curves measured for SMN2 exon 7 in response to (E) risdiplam/branaplam mixtures, (F) risdiplam/ASOi6 mixtures, (G) branaplam/ASOi6 mixtures, (H) risdiplam/ASOi7 mixtures, (I) branaplam/ASOi7 mixtures, and (J) ASOi6/ASOi7 mixtures. K Two-drug linear-mixture curves measured for ELP1 exon 20 in response to RECTAS/ASOi7 mixtures. In panels E-K, curves are second-order polynomials fit to the data points shown using a Bayesian inference procedure (described in SI Sec. 4.5). 1x concentration of each drug (corresponding to approximate EC2x values) is 14 nM for risdiplam, 7 nM for branaplam, 0.6 nM for ASOi6, 0.1 nM for ASOi7, 300 nM for RECTAS, and 0.08 nM for ASOi20. P, p-value for no-synergy null hypothesis (i.e., that the maximal inclusion/exclusion ratio occurs at one of the two ends of the mixture curve) computed using Hamiltonian Monte Carlo sampling as described in SI Sec. 4.5. ***, P<0.001; **, P<0.01; *,P<0.05; n.s., P0.05.

References

    1. Tang, Z., Zhao, J., Pearson, Z. J., Boskovic, Z. V. & Wang, J. RNA-targeting splicing modifiers: drug development and screening assays. Molecules26, 2263 (2021). 10.3390/molecules26082263 - DOI - PMC - PubMed
    1. Warner, K. D., Hajdin, C. E. & Weeks, K. M. Principles for targeting RNA with drug-like small molecules. Nat. Rev. Drug Discov.17, 547–558 (2018). 10.1038/nrd.2018.93 - DOI - PMC - PubMed
    1. Daguenet, E., Dujardin, G. & Valcárcel, J. The pathogenicity of splicing defects: mechanistic insights into pre‐mRNA processing inform novel therapeutic approaches. EMBO Rep.16, 1640–1655 (2015). 10.15252/embr.201541116 - DOI - PMC - PubMed
    1. Wu, P. Inhibition of RNA-binding proteins with small molecules. Nat. Rev. Chem.4, 441–458 (2020). 10.1038/s41570-020-0201-4 - DOI - PubMed
    1. Scotti, M. M. & Swanson, M. S. RNA mis-splicing in disease. Nat. Rev. Genet.17, 19–32 (2015). 10.1038/nrg.2015.3 - DOI - PMC - PubMed

MeSH terms