. 2024 Feb 29;14(1):5023.
doi: 10.1038/s41598-024-53643-7.

Transcriptomics of temperature-sensitive R gene-mediated resistance identifies a WAKL10 protein interaction network

Affiliations

Transcriptomics of temperature-sensitive R gene-mediated resistance identifies a WAKL10 protein interaction network

Katherine Noel et al. Sci Rep. .

Abstract

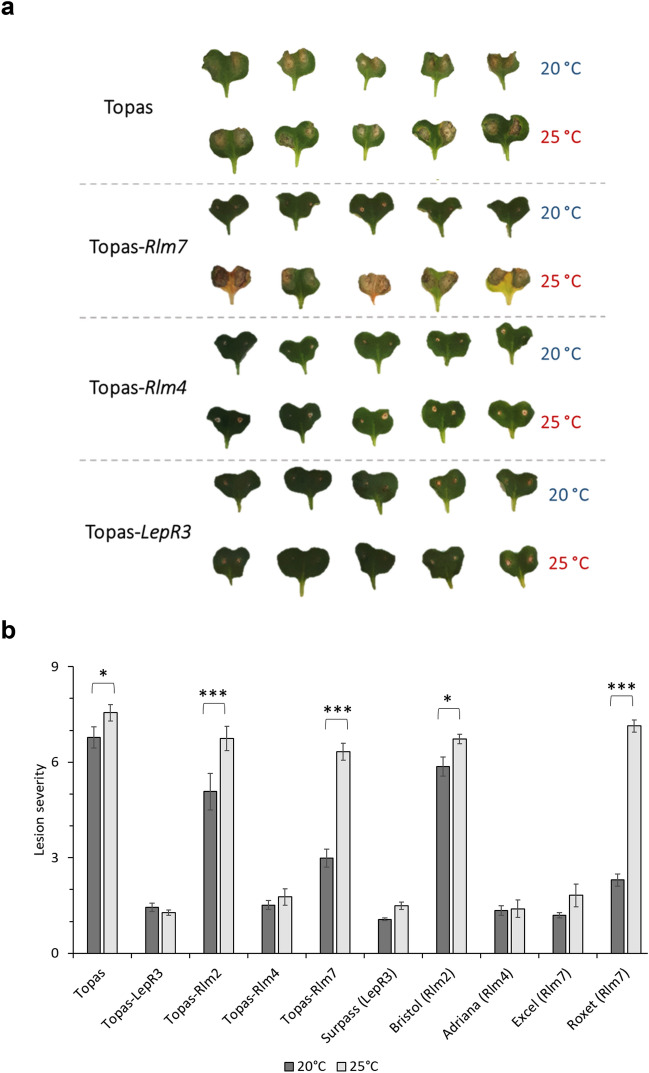
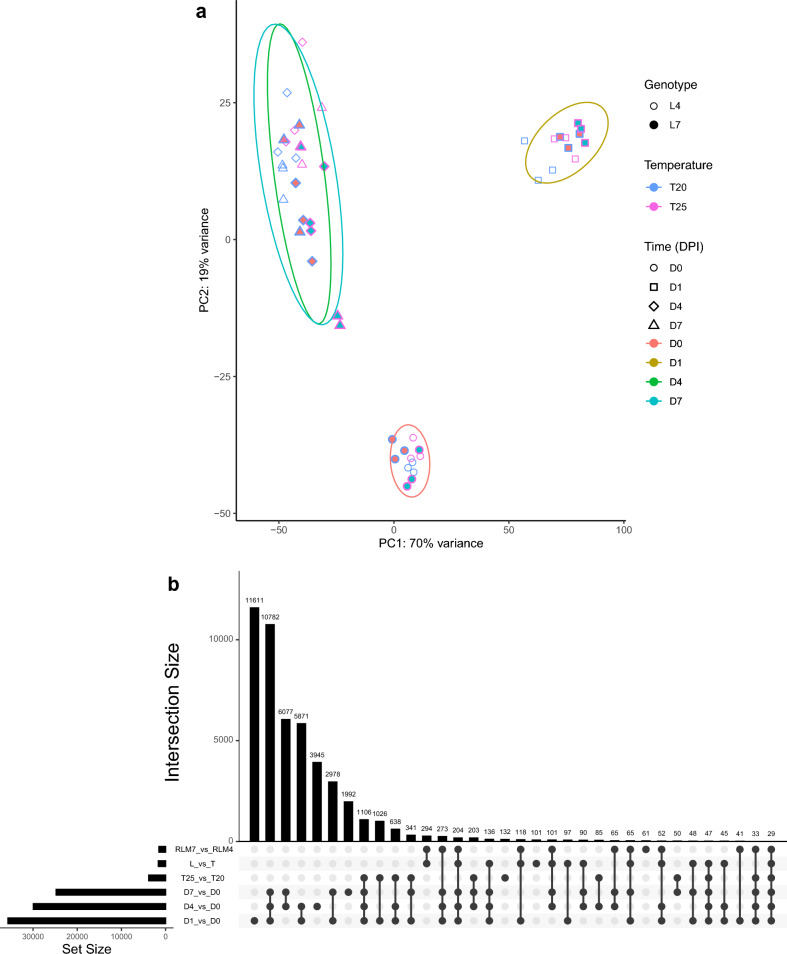
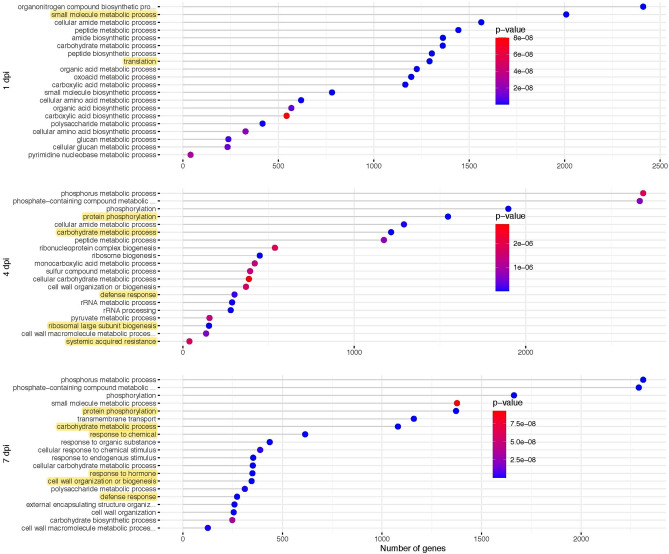
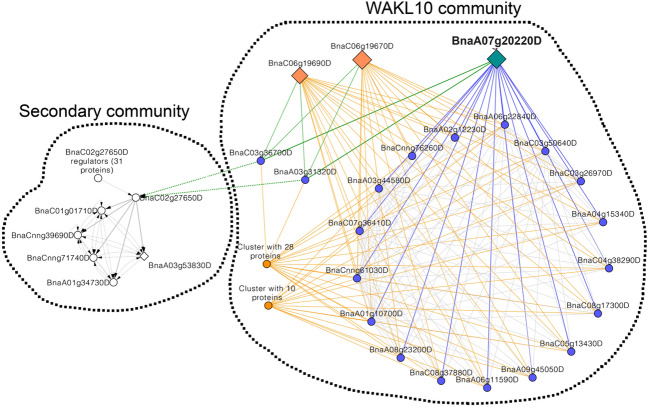
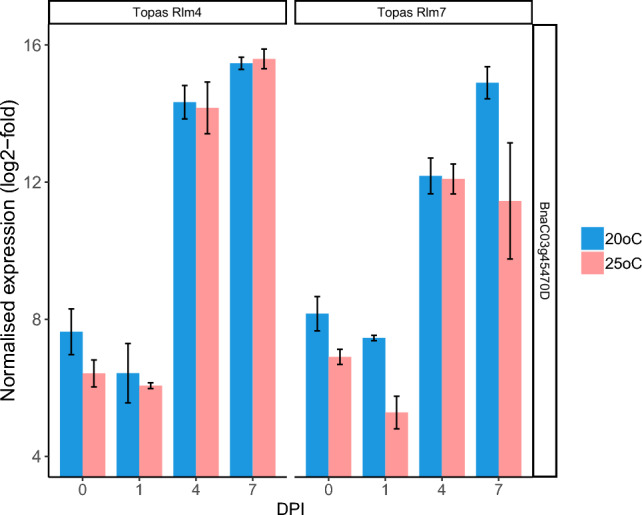
Understanding temperature-sensitivity of R gene-mediated resistance against apoplastic pathogens is important for sustainable food production in the face of global warming. Here, we show that resistance of Brassica napus cotyledons against Leptosphaeria maculans was temperature-sensitive in introgression line Topas-Rlm7 but temperature-resilient in Topas-Rlm4. A set of 1,646 host genes was differentially expressed in Topas-Rlm4 and Topas-Rlm7 in response to temperature. Amongst these were three WAKL10 genes, including BnaA07g20220D, representing the temperature-sensitive Rlm7-1 allele and Rlm4. Network analysis identified a WAKL10 protein interaction cluster specifically for Topas-Rlm7 at 25 °C. Diffusion analysis of the Topas-Rlm4 network identified WRKY22 as a putative regulatory target of the ESCRT-III complex-associated protein VPS60.1, which belongs to the WAKL10 protein interaction community. Combined enrichment analysis of gene ontology terms considering gene expression and network data linked vesicle-mediated transport to defence. Thus, dysregulation of effector-triggered defence in Topas-Rlm7 disrupts vesicle-associated resistance against the apoplastic pathogen L. maculans.


Conflict of interest statement

The authors declare no competing interests.

Figures

Figure 1
Figure 1
Symptoms and lesion severity of different Brassica napus lines and cultivars at 20 °C and 25 °C. (a) Cotyledons of the susceptible doubled-haploid background Topas and its single R gene introgression lines (Topas-Rlm7, Topas-Rlm4 or Topas-LepR3) were point-inoculated with 10 µl of 107 spores ml−1 conidial suspensions of Leptosphaeria maculans isolate JN3 (AvrLm1-4-5-6-7-8). Cotyledons were photographed at 12 days post-inoculation (dpi). (b) Average lesion severity, 0 (resistant) to 9 (susceptible) scale, assessed on cotyledons of Topas introgression lines containing LepR3, Rlm2, Rlm4 or Rlm7, and a differential set of cultivars containing each of these R genes, after point-inoculation with 10 µl of 107 ml−1 conidial suspension of isolate JN3 at 13 dpi. Four sites were assessed per plant. Eight biological replicates were included for each of the introgression lines and six biological replicates were included for each the differential set of cultivars for which each assay was done twice. Bars represent mean lesion scores and error bars show standard errors of the mean (*P < 0.05, ***P < 0.001).
Figure 2
Figure 2
RNA-seq analysis of Brassica napus introgression lines Topas-Rlm4 or Topas-Rlm7 at 0-, 1-, 4- or 7-days post-inoculation (dpi) with Leptosphaeria maculans isolate JN3 (AvrLm1-4-5-6-7-8) at 20 °C or 25 °C. (a) Principal component (PC) analysis of RNA-seq samples. Host transcriptome data were separated by line Topas-Rlm4 (L4, open symbols) and Topas-Rlm7 (L7, filled symbols), temperature 20 °C and 25 °C (blue versus red outlines) and time 0, 1, 4 and 7 dpi (different shapes). Ellipses outline areas of 95% confidence for the different time-points. (b) Intersection between differentially expressed genes (DEGs) in B. napus after inoculation with L. maculans. UpSet plot showing temporal differences in numbers of DEGs at 1 (D1 vs. D0), 4 (D4 vs. D0) and 7 (D7 vs. D0) dpi. The effect of temperature on DEGs at 20 °C versus 25 °C (T25 vs T20) is shown, as is the effect of introgression line (RLM7 vs RLM4); the line x temperature (L vs T) interaction effect relates to DEGs in Topas-Rlm4 versus Topas-Rlm7 at these two temperatures. DEGs were defined using Padj < 0.01. Interaction sizes less than 29 were removed to improve plot resolution.
Figure 3
Figure 3
Gene ontology (GO) enrichment analysis of three different stages of colonisation using the biological process (BP) category. The number of genes associated with each GO term is shown on the x-axis and the specifically enriched GO terms for each time point are shown on the y-axis. Colour gradients represent the P-values for each of the GO terms. Highlighted text is mentioned in the results.
Figure 4
Figure 4
Heat map of 1646 differentially expressed genes (DEGs) that varied between Topas-Rlm4 and Topas-Rlm7 in a temperature-dependent fashion. Means of normalised expression values (n = 3) are shown according to the colour gradient. Hierarchical clustering of DEGs was done using one minus Pearson correlation with average as linkage method. Eight clusters were generated and illustrated using Roman numerals. The most significant gene ontology (GO) terms of the biological process (BP) category are listed for the first four clusters in blue because six or more DEGs represented the listed GO term (n ≥ 6, P < 0.002); numbers of DEGs belonging to the GO term are listed in parentheses. Clusters V to VIII had only two or one DEGs in the most significant GO term. DEGs of interest related to this study are highlighted in bold letters. ERF72 contains an APETELA2 (AP2)/B3-domain; CHMP7 and VPS46.2 have an SNF7-domain. MPK6 refers to mitogen-activated protein kinase 6. WAKL10 are WALL ASSOCIATED KINASE-LIKE 10 genes. SLAH2 and SLAH3 refer to SLOW ANION CHANNEL-ASSOCIATED 1 (SLAC1) homologs 2 and 3, respectively. CLC-A and CLC-B are chloride channel A and B genes, respectively. VDCA1 refers to voltage dependent anion channel 1. DEGs related to ion transport are not highlighted in bold.
Figure 5
Figure 5
Gene-set (GS) sub-network archetypes. Red edges: protein–protein interactions (PPI); blue edges: regulatory interactions amongst transcription factors; green edges: KEGG interactions among genes and metabolites. (a) The GS sub-network was generated using 1,646 differentially expressed genes (DEGs) that were regulated in Brassica napus in response to Leptosphaeria maculans infection dependent on the Topas introgression line (IL) and temperature and a total of 459,312 network connections. This sub-network included all these connections. (b) Sub-network in Topas-Rlm4 with connections influenced by temperature in this IL are shown. (C) Sub-network in Topas-Rlm7 with connections influenced by temperature in this IL are shown. Note that a WAKL10 PPI network occurs only in Topas-Rlm7.
Figure 6
Figure 6
Network communities from WAKL10 network diffusion analysis. Diamond nodes represent differentially expressed genes with size of the symbol related to the log2-fold change. The blue nodes represent proteins directly connecting WAKL10 (BnaA07g20220D, BnaC06g19670D, BnaC06g19690D) to other proteins (orange and blue edges). The blue nodes include ubiquitin-conjugating enzyme 34 (BnaA06g11590D, BnaA08g23200D, BnaA09g45050D, BnaC08g37880D, BnaC08g17300D, BnaC05g13430D), IQ-domain 6 (BnaA04g15340D, BnaC04g38290D, BnaC03g26970D), LRR protein kinase family protein (BnaC03g50640D, BnaA06g22840D, BnaCnng61030D, BnaA01g10700D, BnaC07g36410D, BnaA03g44580D) and NDR1/HIN1-like gene NHL6 (BnaCnng76260D, BnaA02g12230D). The green edges represent the main connections between the WAKL10 community and a secondary community retrieved from the Topas-Rlm4 network. The nodes connecting the green edges represent SNF-domain containing ESCRT-III complex-associated VPS60.1 (BnaA03g31320D, BnaC03g36700D) that connects to WRKY22 (BnaC02g27650). WRKY22 further connects to APETELA2/ETHYLENE RESPONSE FACTOR (AP2/ERF)-type transcription factors (BnaC01g01710D, BnaCnng39690D, BnaCnng71740D, BnaA01g34730D, BnaA03g53830D).
Figure 7
Figure 7
Leptosphaeria maculans-induced PR1 (BnaC03g45470D) expression as evidenced using RNA-seq. Normalised expression was determined using DESeq2 and expressed as log2-fold. Brassica napus introgression lines Topas-Rlm4 or Topas-Rlm7 were inoculated with Leptosphaeria maculans isolate JN3 (AvrLm1-4-5-6-7-8) and incubated at 20 °C or 25 °C. Samples were taken at different days post-inoculation (DPI). Bar plots were generated in R with means and standard errors of the mean indicated. Three biological replicates per treatment were used.

Similar articles

Cited by

References

    1. Bailey-Serres J, Parker JE, Ainsworth EA, Oldroyd GED, Schroeder JI. Genetic strategies for improving crop yields. Nature. 2019;575:109–118. doi: 10.1038/s41586-019-1679-0. - DOI - PMC - PubMed
    1. Daugherty MP, Zeilinger AR, Almeida RPP. Conflicting effects of climate and vector behavior on the spread of a plant pathogen. Phytobiomes. 2017;1:46–53. doi: 10.1094/PBIOMES-01-17-0004-R. - DOI
    1. Prank M, Kenaley SC, Bergstrom GC, Acevedo M, Mahowald NM. Climate change impacts the spread potential of wheat stem rust, a significant crop disease. Environ. Res. Lett. 2019;14:124053. doi: 10.1088/1748-9326/ab57de. - DOI
    1. Butterworth MH, et al. North-South divide: Contrasting impacts of climate change on crop yields in Scotland and England. J. R. Soc. Interface. 2010;7:123–130. doi: 10.1098/rsif.2009.0111. - DOI - PMC - PubMed
    1. Stotz HU, Mitrousia GK, de Wit PJ, Fitt BDL. Effector-triggered defence against apoplastic fungal pathogens. Trends Plant Sci. 2014;19:491–500. doi: 10.1016/j.tplants.2014.04.009. - DOI - PMC - PubMed