. 2024 Feb 29;15(1):1854.
doi: 10.1038/s41467-024-46104-2.

Altered receptor binding, antibody evasion and retention of T cell recognition by the SARS-CoV-2 XBB.1.5 spike protein

Affiliations

Altered receptor binding, antibody evasion and retention of T cell recognition by the SARS-CoV-2 XBB.1.5 spike protein

Dhiraj Mannar et al. Nat Commun. .

Abstract

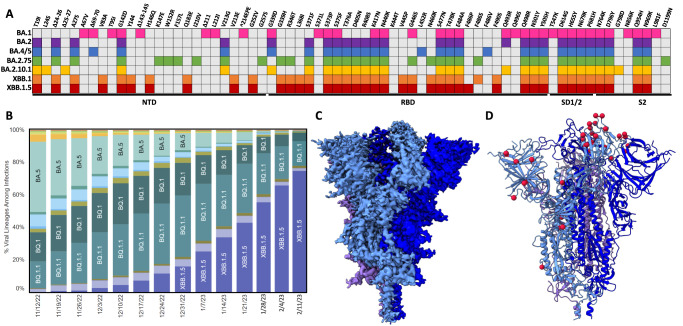
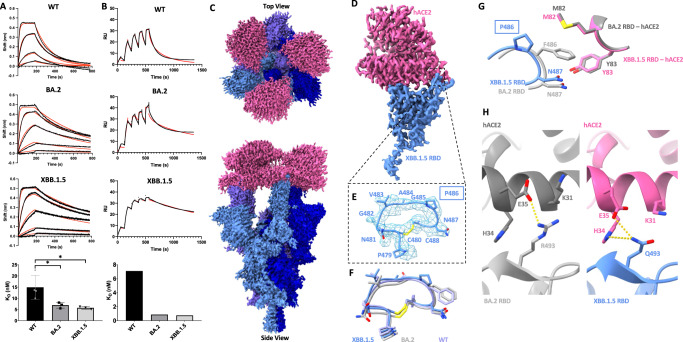
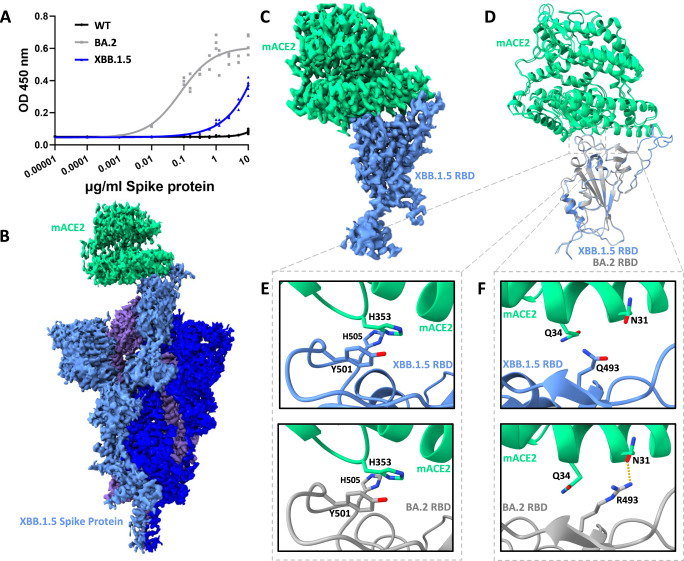
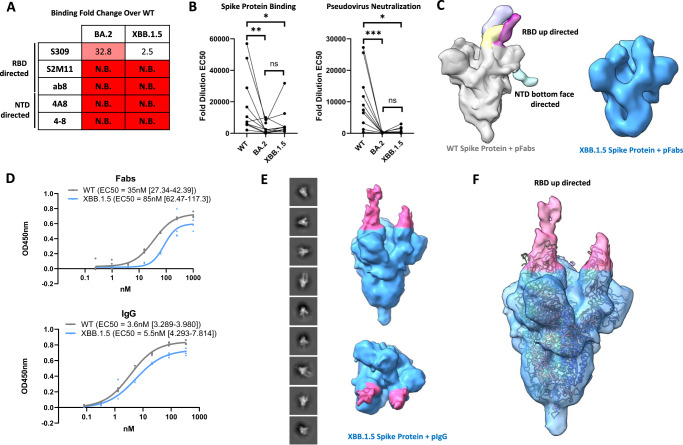
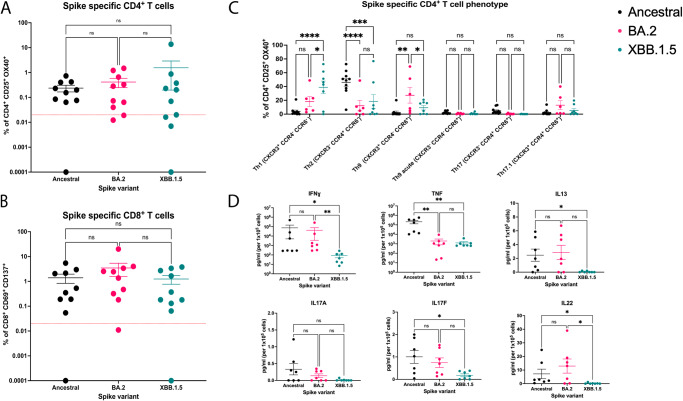
The XBB.1.5 variant of SARS-CoV-2 has rapidly achieved global dominance and exhibits a high growth advantage over previous variants. Preliminary reports suggest that the success of XBB.1.5 stems from mutations within its spike glycoprotein, causing immune evasion and enhanced receptor binding. We present receptor binding studies that demonstrate retention of binding contacts with the human ACE2 receptor and a striking decrease in binding to mouse ACE2 due to the revertant R493Q mutation. Despite extensive evasion of antibody binding, we highlight a region on the XBB.1.5 spike protein receptor binding domain (RBD) that is recognized by serum antibodies from a donor with hybrid immunity, collected prior to the emergence of the XBB.1.5 variant. T cell assays reveal high frequencies of XBB.1.5 spike-specific CD4+ and CD8+ T cells amongst donors with hybrid immunity, with the CD4+ T cells skewed towards a Th1 cell phenotype and having attenuated effector cytokine secretion as compared to ancestral spike protein-specific cells. Thus, while the XBB.1.5 variant has retained efficient human receptor binding and gained antigenic alterations, it remains susceptible to recognition by T cells induced via vaccination and previous infection.


Conflict of interest statement

S.S. is the Founder and CEO of Gandeeva Therapeutics Inc. T.S. has previously maintained a research contract with AbCellera Biologics Inc. The remaining authors declare no competing interests.

Figures

Fig. 1
Fig. 1. Mutational profile and prevalence of the XBB.1.5 SARS-CoV-2 lineage.
A Amino acid mutations in the spike glycoprotein open reading frame for various Omicron and XBB sub-lineages. Each coloured box represents a mutation within a specific omicron sub-lineage. NTD amino terminal domain, RBD receptor binding domain. B Weekly weighted estimates of lineage proportion from sequencing data in the United States. Weeks from 28 Jan–11 Feb 2023 represent Nowcast estimates which consistently align with the weighted proportions based on reported sequencing data. C CryoEM density map of the XBB.1.5 spike protein, with each protomer coloured a shade of blue or purple. D Resultant atomic model of the XBB.1.5 spike protein with modelled mutational locations denoted with red spheres on a single protomer.
Fig. 2
Fig. 2. Analysis of human ACE2 (hACE2) engagement by the XBB.1.5 spike protein.
A Biolayer interferometry analysis of WT, BA.2, and XBB.1.5 RBDs binding to immobilized dimeric hACE2. Black curves represent raw data which were fit to a model using a 1:1 binding stoichiometry (red) to determine the reported dissociation constants. Experiments were performed 4 times (n = 4) for the WT and 3 times (n = 3) for the remaining variants, and a representative curve is shown for each condition. Results are summarized at the bottom; error bars denote the standard deviation. Statistical significance was assessed via ANOVA with Dunnett’s post test for multiple comparisons against the WT (*P ≤ 0.05), WT vs BA.2 (P = 0.0412), WT vs XBB.1.5 (P = 0.0228). B Single-cycle kinetic analyses of WT, BA.2, and XBB.1.5 RBDs binding to immobilized dimeric hACE2 measured via surface plasmon resonance. Black curves represent raw data which were fit to a model using a 1:1 binding stoichiometry (red) to determine the reported dissociation constants which are tabulated below from a single experiment. RU: Response units. Experiments were performed one time. C Global Cryo-EM density map of the XBB.1.5 spike–hACE2 complex. D Local Cryo-EM density map of the hACE2–XBB.1.5 RBD region. E Map and model of the hACE2 binding ridge loop in the XBB.1.5 RBD when bound to hACE2. F Comparison of the hACE2 binding ridge loop region between XBB.1.5, BA.2, and WT RBDs when bound to ACE2. G Comparison of the hACE2 contacts made by RBD residues 486 and 487 in the XBB.1.5 and BA.2 RBD. H Comparison of the hACE2 contacts made by residue 493 within BA.2 and XBB.1.5 RBDs. Dashed lines indicate potential interactions (salt bridges or hydrogen bonds). Models were aligned by the RBD for all superpositions. PDB ID: 6M0J and 8DM6 were used for the WT-ACE2 complex and BA.2-ACE2 complex, respectively.
Fig. 3
Fig. 3. The XBB.1.5 spike protein–mouse ACE2 interaction.
A ELISA of WT, BA.2, and XBB.1.5 spike proteins binding to mACE2. The results of two independent experiments are plotted, with technical triplicates performed in each experiment. OD450 nm: Optical density at 450 nm. B CryoEM density of XBB.1.5 spike protein bound to mACE2. The spike protein is shown in shades of blue and purple while mACE2 is shown in green. C As in (B), but for the focused-refined mACE2–XBB.1.5 RBD complex. D The resultant atomic model of the mACE2–XBB.1.5 RBD complex structurally aligned with the mACE2–BA.2 RBD complex (PDB ID: 8DM8). E Focused view of mutated residues Y501 and H505 in the mACE2–XBB.1.5 RBD complex (top) and mACE2–BA.2 RBD complex (bottom). F Focused view of RBD residue 493 in the mACE2–XBB.1.5 RBD complex (top) and mACE2–BA.2 RBD complex (bottom).
Fig. 4
Fig. 4. Analysis of antibody binding to the XBB.1.5 spike protein.
A Analysis of monoclonal antibody binding to the WT, BA.2, and XBB.1.5 spike proteins via ELISA. EC50 ratios over the WT spike protein binding EC50 are shown for each antibody assayed (N.B. no binding). B Analysis of serum IgG binding to the WT, BA.2, and XBB.1.5 spike proteins via ELISA (left) and serum neutralization of pseudoviruses harbouring the WT, BA.2, and XBB.1.5 spike proteins (right) from n = 10 vaccinated adults. Fold dilution EC50 values are plotted for each spike protein. A pairwise statistical significance test was performed using the Friedmans and Dunn’s post-test for multiple comparisons (*P ≤ 0.05, **P ≤ 0.01, ***P ≤ 0.0001, ns: not significant). Calculated P values are as follows – spike protein binding: WT vs BA.2 (P = 0.001), WT vs XBB.1.5 (P = 0.0417), BA.2 vs XBB.1.5 (P = 0.7907), pseudovirus neutralization: WT vs BA.2 (P = 0.0001), WT vs XBB.1.5 (P = 0.0304), BA.2 vs XBB.1.5 (P = 0.3526). C Negative stain electron microscopy studies of WT and XBB.1.5 spike proteins using polyclonal Fab fragments (pFabs). Top: Superposition of all Fab-spike protein reconstructions obtained using polyclonal Fabs and the WT spike protein. Maps were superposed in chimeraX and Fab densities are colourized and annotated by general location of the epitope recognized. Bottom: Representative 3D reconstruction of the XBB.1.5 spike trimer showing no additional density corresponding to Fab fragments. D ELISA analysis of polyclonal Fabs and IgGs binding to WT and XBB.1.5 spike proteins. Experiments were done in technical quadruplicate (n = 4) and are shown as points. EC50 values along with 95% confidence intervals are shown. E Negative stain electron microscopy studies of polyclonal IgG (pIgG) binding the XBB.1.5 spike protein. 2D class averages along with both side and top views of the resulting 3D reconstruction are shown. Additional density corresponding to Fab regions are coloured in pink. F Fit of a SARS-CoV-2 Spike protein model with all RBDs in the up position (PDB 7X7N with ligands removed) into the obtained 3D reconstruction of an IgG-XBB.1.5 spike protein complex.
Fig. 5
Fig. 5. T cell responses to ancestral (WT), BA.2 and XBB.1.5 SARS-CoV-2 spike proteins.
After 44-hours of stimulation with antigen we quantified the A frequency of spike protein specific CD4+ T cells (CD25+OX40+) and B frequency of spike protein specific CD8+ T cells (CD137+CD69+) in PBMCs from n = 10 vaccinated adults for three spike variants. Kruskal–Wallis tests with Dunn’s multiple comparisons tests were used to determine significant differences in T cell responses (ns not significant). C Phenotypic analysis of spike specific CD4+ T cells from (A), responses were of sufficient magnitude to quantify subsets for n = 10 ancestral, n = 6 BA.2 and n = 8 XBB.1.5 spike stimulated assays. A two-way ANOVA with Tukey’s multiple comparisons test was used to determine significant differences in CD4+ T cell phenotypes between spike variants. (*P ≤ 0.05, **P ≤ 0.01, ***P ≤ 0.0001, ns: not significant). Calculated P values are as follows: Th1: WT vs BA.2 (P = 0.1111), WT vs XBB.1.5 (P < 0.0001), BA.2 vs XBB.1.5 (P = 0.0164). Th2: WT vs BA.2 (P < 0.0001), WT vs XBB.1.5 (P = 0.0001), BA.2 vs XBB.1.5 (P = 0.6877). Th9: WT vs BA.2 (P = 0.0018), WT vs XBB.1.5 (P = 0.5457), BA.2 vs XBB.1.5 (P = 0.0427). Th9 acute: WT vs BA.2 (P = 0.9742), WT vs XBB.1.5 (P = 0.9732), BA.2 vs XBB.1.5 (P > 0.9999). Th17: WT vs BA.2 (P = 0.7978), WT vs XBB.1.5 (P = 0.7335), BA.2 vs XBB.1.5 (P = 0.9988). Th17.1: WT vs BA.2 (P = 0.3035), WT vs XBB.1.5 (P = 0.9065), BA.2 vs XBB.1.5 (P = 0.5498). D Cytokine concentrations in supernatants collected from spike-stimulated wells at 44 hours were quantified as pg/mL per 105 cells for n = 7 individuals. A two-way ANOVA with Tukey’s multiple comparisons test was used to determine significant differences in cytokine levels. (*P ≤ 0.05, **P ≤ 0.01, ns not significant). Calculated P values are as follows: IFNγ: WT vs BA.2 (P > 0.999), WT vs XBB.1.5 (P = 0.0153), BA.2 vs XBB.1.5 (P = 0.0032). TNF: WT vs BA.2 (P = 0.0050), WT vs XBB.1.5 (P < 0.0043), BA.2 vs XBB.1.5 (P > 0.9999). IL-13: WT vs BA.2 (P > 0.9999), WT vs XBB.1.5 (P = 0.0445), BA.2 vs XBB.1.5 (P = 0.0676). IL-17A: P = 0.2188). (IL-17F: WT vs BA.2 (P = 0.6622), WT vs XBB.1.5 (P < 0.0330), BA.2 vs XBB.1.5 (P = 0.1723). IL-22: WT vs BA.2 (P > 0.9999), WT vs XBB.1.5 (P = 0.0221), BA.2 vs XBB.1.5 (P = 0.0114).

Similar articles

Cited by

References

    1. Shu Y, McCauley J. GISAID: Global initiative on sharing all influenza data—from vision to reality. Eurosurveillance. 2017;22:2–4. doi: 10.2807/1560-7917.ES.2017.22.13.30494. - DOI - PMC - PubMed
    1. Andrews N, et al. Covid-19 vaccine effectiveness against the Omicron (B.1.1.529) variant. N. Engl. J. Med. 2022;386:1532–1546. doi: 10.1056/NEJMoa2119451. - DOI - PMC - PubMed
    1. Buchan SA, et al. Estimated effectiveness of COVID-19 vaccines against omicron or delta symptomatic infection and severe outcomes. JAMA Netw. Open. 2022;5:e2232760. doi: 10.1001/jamanetworkopen.2022.32760. - DOI - PMC - PubMed
    1. Tsang, N. N. Y., So, H. C., Cowling, B. J., Leung, G. M. & Ip, D. K. M. Effectiveness of BNT162b2 and CoronaVac COVID-19 vaccination against asymptomatic and symptomatic infection of SARS-CoV-2 omicron BA.2 in Hong Kong: a prospective cohort study. Lancet Infect. Dis. 10.1016/S1473-3099(22)00732-0 (2023). - PMC - PubMed
    1. Saville JW, et al. Structural analysis of receptor engagement and antigenic drift within the BA.2 spike protein. Cell Rep. 2023;42:111964. doi: 10.1016/j.celrep.2022.111964. - DOI - PMC - PubMed

Substances