The Deinococcus protease PprI senses DNA damage by directly interacting with single-stranded DNA
- PMID: 38424107
- PMCID: PMC10904395
- DOI: 10.1038/s41467-024-46208-9
The Deinococcus protease PprI senses DNA damage by directly interacting with single-stranded DNA
Abstract
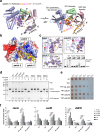
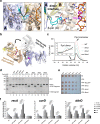
Bacteria have evolved various response systems to adapt to environmental stress. A protease-based derepression mechanism in response to DNA damage was characterized in Deinococcus, which is controlled by the specific cleavage of repressor DdrO by metallopeptidase PprI (also called IrrE). Despite the efforts to document the biochemical, physiological, and downstream regulation of PprI-DdrO, the upstream regulatory signal activating this system remains unclear. Here, we show that single-stranded DNA physically interacts with PprI protease, which enhances the PprI-DdrO interactions as well as the DdrO cleavage in a length-dependent manner both in vivo and in vitro. Structures of PprI, in its apo and complexed forms with single-stranded DNA, reveal two DNA-binding interfaces shaping the cleavage site. Moreover, we show that the dynamic monomer-dimer equilibrium of PprI is also important for its cleavage activity. Our data provide evidence that single-stranded DNA could serve as the signal for DNA damage sensing in the metalloprotease/repressor system in bacteria. These results also shed light on the survival and acquired drug resistance of certain bacteria under antimicrobial stress through a SOS-independent pathway.
© 2024. The Author(s).
Conflict of interest statement
The authors declare no competing interests.
Figures


Similar articles
-
Protease activity of PprI facilitates DNA damage response: Mn2+-dependence and substrate sequence-specificity of the proteolytic reaction.PLoS One. 2015 Mar 26;10(3):e0122071. doi: 10.1371/journal.pone.0122071. eCollection 2015. PLoS One. 2015. PMID: 25811789 Free PMC article.
-
Structure and DNA damage-dependent derepression mechanism for the XRE family member DG-DdrO.Nucleic Acids Res. 2019 Oct 10;47(18):9925-9933. doi: 10.1093/nar/gkz720. Nucleic Acids Res. 2019. PMID: 31410466 Free PMC article.
-
Conservation and diversity of the IrrE/DdrO-controlled radiation response in radiation-resistant Deinococcus bacteria.Microbiologyopen. 2017 Aug;6(4):e00477. doi: 10.1002/mbo3.477. Epub 2017 Apr 11. Microbiologyopen. 2017. PMID: 28397370 Free PMC article.
-
PprI: The Key Protein in Response to DNA Damage in Deinococcus.Front Cell Dev Biol. 2021 Jan 18;8:609714. doi: 10.3389/fcell.2020.609714. eCollection 2020. Front Cell Dev Biol. 2021. PMID: 33537302 Free PMC article. Review.
-
Coexistence of SOS-Dependent and SOS-Independent Regulation of DNA Repair Genes in Radiation-Resistant Deinococcus Bacteria.Cells. 2021 Apr 16;10(4):924. doi: 10.3390/cells10040924. Cells. 2021. PMID: 33923690 Free PMC article. Review.
Cited by
-
The -10 region adjacent to open reading frames is a common expression pattern in Deinococcus-Thermus.Life Sci Alliance. 2025 Aug 11;8(11):e202503354. doi: 10.26508/lsa.202503354. Print 2025 Nov. Life Sci Alliance. 2025. PMID: 40789641 Free PMC article.
-
cAMP-independent DNA binding of the CRP family protein DdrI from Deinococcus radiodurans.mBio. 2024 Jul 17;15(7):e0114424. doi: 10.1128/mbio.01144-24. Epub 2024 Jun 25. mBio. 2024. PMID: 38916345 Free PMC article.
-
Allosteric activation mechanism of DriD, a WYL-domain containing transcription regulator.Commun Biol. 2025 Apr 29;8(1):679. doi: 10.1038/s42003-025-08111-x. Commun Biol. 2025. PMID: 40301632 Free PMC article.
-
Unraveling the Central Role of Global Regulator PprI in Deinococcus radiodurans Through Label-Free Quantitative Proteomics.Proteomes. 2025 May 23;13(2):19. doi: 10.3390/proteomes13020019. Proteomes. 2025. PMID: 40559992 Free PMC article.
-
DdiA, an XRE family transcriptional regulator, is a co-regulator of the DNA damage response in Myxococcus xanthus.J Bacteriol. 2025 Jul 24;207(7):e0018425. doi: 10.1128/jb.00184-25. Epub 2025 Jul 3. J Bacteriol. 2025. PMID: 40608330 Free PMC article.
References
-
- Huen MS, Chen J. The DNA damage response pathways: at the crossroad of protein modifications. Cell Res. 2008;18:8–16. - PubMed
-
- Jeggo PA, Lobrich M. Contribution of DNA repair and cell cycle checkpoint arrest to the maintenance of genomic stability. DNA Repair. 2006;5:1192–1198. - PubMed
-
- Cox MM, Battista JR. Deinococcus radiodurans - the consummate survivor. Nat. Rev. Microbiol. 2005;3:882–892. - PubMed
MeSH terms
Substances
Grants and funding
- 32370028/National Natural Science Foundation of China (National Science Foundation of China)
- 32200016/National Natural Science Foundation of China (National Science Foundation of China)
- 32222001/National Natural Science Foundation of China (National Science Foundation of China)
- U1967217/National Natural Science Foundation of China (National Science Foundation of China)
- LQ23C010002/Natural Science Foundation of Zhejiang Province (Zhejiang Provincial Natural Science Foundation)
LinkOut - more resources
Full Text Sources
Molecular Biology Databases

