. 2024 Feb 29;15(1):1852.
doi: 10.1038/s41467-024-46159-1.

Deregulated protein homeostasis constrains fetal hematopoietic stem cell pool expansion in Fanconi anemia

Affiliations

Deregulated protein homeostasis constrains fetal hematopoietic stem cell pool expansion in Fanconi anemia

Narasaiah Kovuru et al. Nat Commun. .

Abstract

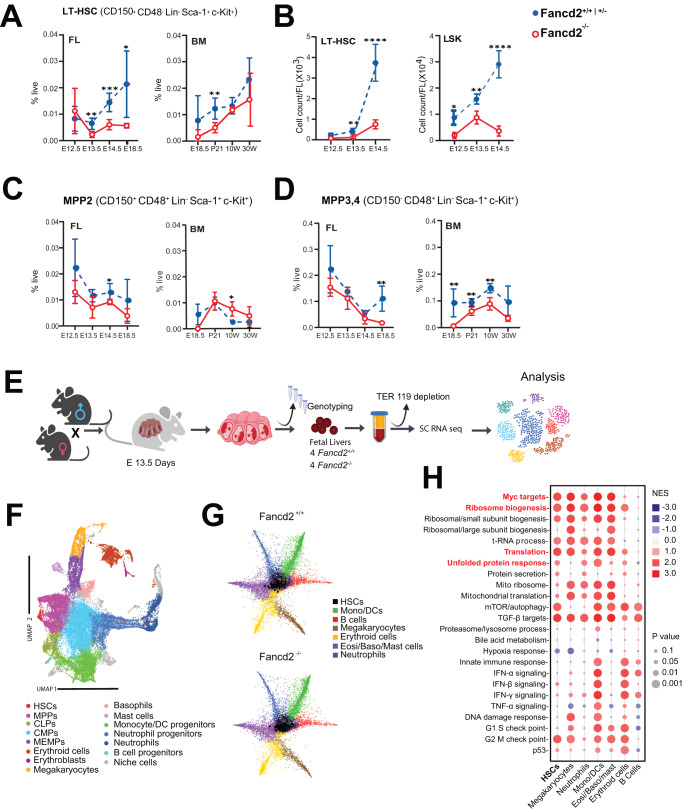
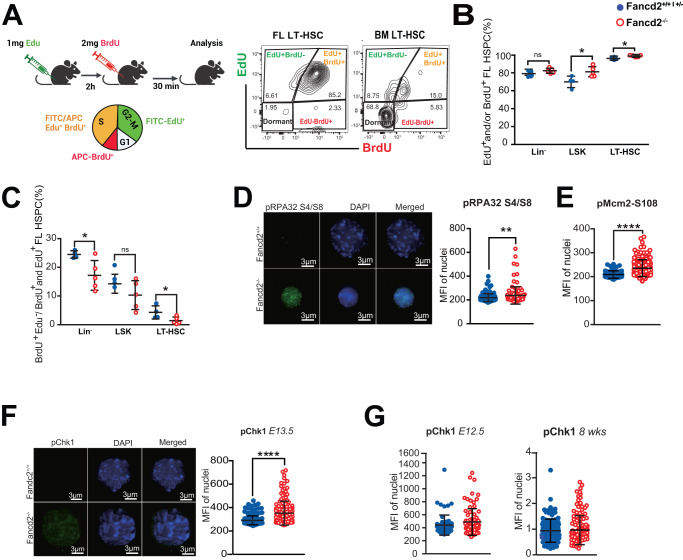
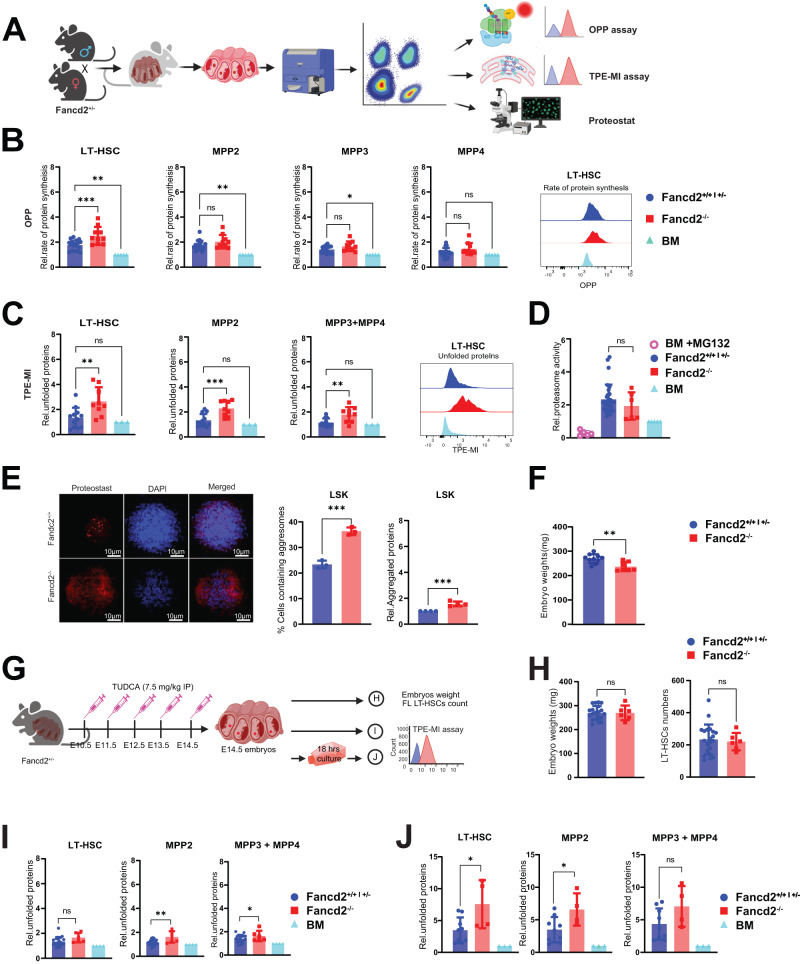
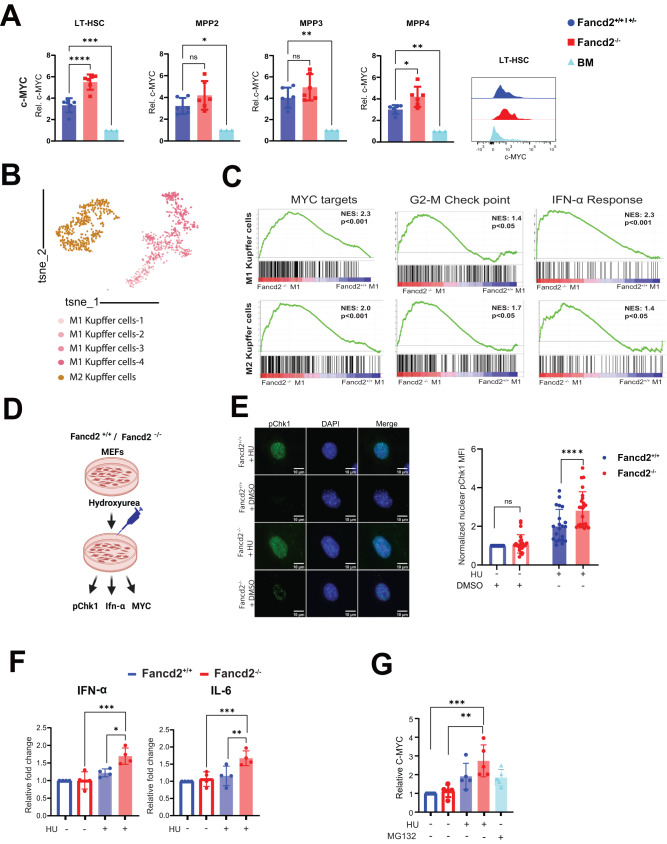
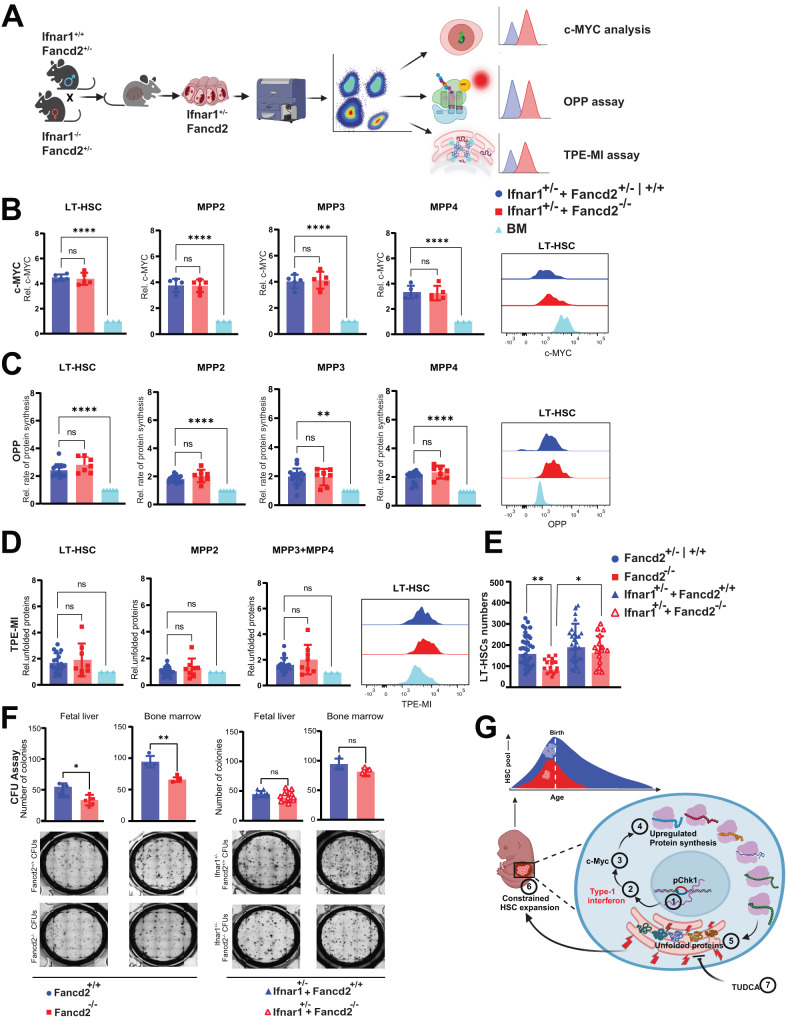
Demand-adjusted and cell type specific rates of protein synthesis represent an important safeguard for fate and function of long-term hematopoietic stem cells. Here, we identify increased protein synthesis rates in the fetal hematopoietic stem cell pool at the onset of hematopoietic failure in Fanconi Anemia, a prototypical DNA repair disorder that manifests with bone marrow failure. Mechanistically, the accumulation of misfolded proteins in Fancd2-/- fetal liver hematopoietic stem cells converges on endoplasmic reticulum stress, which in turn constrains midgestational expansion. Restoration of protein folding by the chemical chaperone tauroursodeoxycholic acid, a hydrophilic bile salt, prevents accumulation of unfolded proteins and rescues Fancd2-/- fetal liver long-term hematopoietic stem cell numbers. We find that proteostasis deregulation itself is driven by excess sterile inflammatory activity in hematopoietic and stromal cells within the fetal liver, and dampened Type I interferon signaling similarly restores fetal Fancd2-/- long-term hematopoietic stem cells to wild type-equivalent numbers. Our study reveals the origin and pathophysiological trigger that gives rise to Fanconi anemia hematopoietic stem cell pool deficits. More broadly, we show that fetal protein homeostasis serves as a physiological rheostat for hematopoietic stem cell fate and function.


Conflict of interest statement

The authors declare no competing interests.

Figures

Fig. 1
Fig. 1. Deficits in expansion and prolonged S-phase transition in Fancd2−/− FL HSC.
A Immunophenotyping was performed to determine the frequency of LT-HSC: CD150+ CD48- Lin- Sca-1+ c-Kit+ (LSK), in WT and Fancd2−/− littermates across indicated time points in ontogeny. B Absolute numbers of LT-HSC (left panel) and LSK (right panel) in E12.5-13.5-14.5 of WT (+/+) compared with Fancd2−/− FL. C Frequency of MPP2 (CD150+ CD48+ Lin- Sca-1+ c-Kit+). D Frequency of MPP3,4 (CD150- CD48- Lin- Sca-1+ c-Kit+). (E12.5: WT n = 4/3, Fancd2−/− n = 7/3; E13.5: WT n = 9/4, Fancd2−/− n = 5/4; E14.5: WT n = 9/4, Fancd2−/− n = 6/4; E18.5: WT n = 7/3, Fancd2−/− n = 3/3; P21 WT n = 5/3, Fancd2−/− n = 6/3, 10 Weeks (10 W): WT n = 4/3, Fancd2−/− n = 4/3; 30 W: WT n = 6/3, Fancd2−/− n = 5/3. Data in (AD) are represented ±SEM. Welch’s t-test was used for statistical analysis (*P < 0.05, **P < 0.01, ***P < 0.001, ****P < 0.0001). The statistical analyses in (AD) are two sided and were performed with GraphPad Prism7.0 software. E Schematic diagram of the procedures for fetal liver (WT and Fancd2−/−) capture, processing, single cell-RNA seq profiling, and analysis. Schematic figure was created with BioRender.com released under a Creative Commons Attribution-Noncommercial-NoDerivs 4.0 International license. F UMAP visualization of the fetal liver cell composition. Schematic (G) Lineage trajectory analysis of HSPCs with progression of immature HSPCs at the center toward fully differentiated cells (neutrophils, megakaryocytes, erythrocyte progenitors, eosinophil/basophil/mast cells, monocytes/dendritic cells and B-cells) at the end of each projection. Left hand panel: WT, right hand panel: Fancd2−/−. H Dot plot representation of the normalized enrichment score- (NES) and P-values of Gene Set Enrichment Analysis (GSEA) in Fancd2−/− versus WT HSPCs, NES and P values of H. GSEA analysis contains statistical outputs from the GSEA software. Source data are provided as a Source Data file.
Fig. 2
Fig. 2. Fancd2−/− fetal liver HSPCs show replication stress and delayed cell cycle progression.
A Schema for sequential EdU/BrdU injection in the dam at E13.5 with cell cycle analysis, Representative flow panels illustrate FL (left) and BM (right) HSPC distribution with predicted differences in dormancy, lower left quadrant. Schematic Figure was created with BioRender.com released under a Creative Commons Attribution-NonCommercial-NoDerivs 4.0 International license. B Frequency of nascent ssDNA (EdU+ and/or BrdU+) in the Lin-, LSK and LT-HSC: (Fancd2++ n = 4, Fancd2−/− n = 5); *P < 0.05. C Percentage of cells newly entering S-phase (BrdU+EdU- per EdU+ and/or BrdU+) in Lin-, LSK and LT-HSC: WT (Fancd2++) n = 4, Fancd2−/− n = 5). D Representative images and Immunofluorescence (IF) analysis of WT (Fancd2++) and Fancd2−/− HSPC pRPA32 S4/S8 (E13.5; WT: n = 5; 116 cells, Fancd2−/−: n = 4; 111 cells). E Immunofluorescence (IF) analysis of Fancd2++ and Fancd2−/− HSPC pMCM2-S108 (E13.5; WT(Fancd2++) n = 4 pups, 64 cells, Fancd2−/−: n = 6 pups, 149 cells). F pChk1-S345 WT(Fancd2++): n = 9; 174 cells, Fancd2−/−: n = 4; 145 cells at E13.5 days). G Representative images and IF analysis pChk1-S345 at E12.5 WT (Fancd2++) n = 2: 63 cells; Fancd2−/−: n = 5: 81 cells) and in 8-week-old adult BM (WT n = 2: 106 cells; Fancd2−/−: n = 2: 113 cells). Welch’s t-test was used for statistical analysis, Data is represented ±SEM, all the statistical analysis are two sided. *P < 0.05, **P < 0.01, ***P < 0.001, ****P < 0.0001. All the statistical analysis are two sided and were performed with GraphPad Prism7.0 software. Source data are provided as a Source Data file.
Fig. 3
Fig. 3. Dysregulated protein homeostasis in Fancd2−/− fetal liver HSPCs.
A Schematic representation of experimental procedures. Schematic Figure was created with BioRender.com released under a Creative Commons Attribution-NonCommercial-NoDerivs 4.0 International license. B Analysis of the rate of translation by in vivo OPP incorporation in Fancd2+/+ and Fancd2+/− (FL Samples/Pregnancies n = 18/5), Fancd2−/− (FL Samples/Pregnancies n = 10/5), normalized to the dam BM (Fancd2+/−: n = 5 pregnant mice) LT-HSCs (P = 0.0007), MPP2 (P = 0.03), MPP3 (P = 0.06) and MPP4 (P = 0.1). Representative histograms from an analysis of LT-HSC. C Analysis of unfolded protein levels by TPE-MI analysis in Fancd2+/+ and Fancd2+/− (FL Samples/Pregnancies n = 12/3) and Fancd2−/− (FL Samples/Pregnancies n = 9/3) FL relative to the Fancd2+/- dam BM (n = 3 pregnant mice) LT- HSCs (P = 0.007), MPP2 (P = 0.0009) and MPP3 + MPP4 (P = 0.007). Representative histograms from a LT-HSC analysis. D Proteasome activity in LSK cells from Fancd2++, Fancd2+/− (n = 17/5) and Fancd2−/− (n = 6/5) (P = 06) FL relative to the Fancd2/+/− dam BM (n = 5). E Representative images of protein aggregates in FL HSPC (Lin-ve, Sca-1+ and c-Kit+ cells) from Fancd2+/+ (n = 3/2), and Fancd2−/− (n = 3/2) littermates (P = 0.0002). Quantification of relative protein aggregates and percent of aggresome positive cells. F Fancd2+/+ (n = 10/4) and Fancd2−/− (n = 8/4) littermate embryo weights, (P = 0.002). G Experimental design of TUDCA injection. Pregnant mice were intraperitoneally injected with 7.5 mg/kg of TUDCA daily from E10.5 to E14.5. Fetal livers were harvested 2 h after the last injection, for analysis. Schematic of experimental design was created with BioRender.com released under a Creative Commons Attribution-NonCommercial-NoDerivs 4.0 International license. H Embryo weights (P = 0.1) and LT-HSC numbers (P = 0.2) from littermates of TUDCA injected Fancd2+/+ and Fancd2+/− (n = 19/4) and Fancd2−/− (n = 6/4). I Analysis of unfolded proteins from TUDCA injected Fancd2+/+ and Fancd2+/− (n = 19/4), and Fancd2−/− (n = 6/4) fetal liver LT-HSCs (P = 0.2), MPP2 (P = 0.003), MPP3 + MPP4 (P = 0.2) normalized to respective Fancd2+/− maternal BM (right-most column) (n = 4). J Unfolded protein analysis in FL cells from a TUDCA-injected pregnant dam followed by sacrifice, BM harvest, and subsequent ex vivo culture for 18 h without TUDCA Fancd2++- and Fancd2+/− (n = 9/3) and Fancd2−/− (n = 4/3). Data are represented as mean ± SEM. In B, C, D, H and J one-way ANOVA was considered for statistical analysis and for panel -E, -F and -I, t-test was used for statistical analysis. All the statistical analysis are two sided and were performed with GraphPad Prism7.0 software. *P < 0.05, **P < 0.01, ***P < 0.001, and ns: non-significant. Source data are provided as a “Source Data” file.
Fig. 4
Fig. 4. Experimental replication stress induces inflammatory cytokines and MYC expression in Fancd2−/− MEFs.
A Relative increase in MYC levels in Fancd2−/− fetal liver LT-HSCs (P = 0.0001), MPP2 (P = 0.2), MPP3 (P = 0.01) and MPP4 (Fancd2+/+: n = 5/3, Fancd2−/−: n = 6/3), normalized to the respective dam BM (n = 3) representative histograms from a LT-HSCs. B t-SNE plot showing the Kupffer cells subtypes (M1, M2) and their differentiation trajectory. C Gene set enrichment analysis demonstrating enrichment of MYC targets, G2-M check point, IFN-α response in Fancd2−/− M1 Kupffer cells (upper panel) and Fancd2−/− M2 Kupffer cells (lower panel), both NES and P values are statistical outputs from the GSEA software analysis. D Experimental plan of replication stress followed by inflammatory cytokines and endogenous c-MYC analysis in MEFs. Schematic of experimental plan was created with BioRender.com released under a Creative Commons Attribution-NonCommercial-NoDerivs 4.0 International license. E Representative immunofluorescence (IF) images and quantification of pChk1-S345 in Fancd2+/+ and Fancd2−/− MEFs at basal conditions and under replication stress using hydroxyurea (HU) at 200 μM final concentration (n = 3 independent experiments, DMSO+Fancd2+/+ vs DMSO+Fancd2−/− MEFs P = 0.3). HU+Fancd2−/− vs HU+Fancd2−/− MEFs P = 0.0008). F Real time PCR analysis of inflammatory cytokines IFN-α (Basel Fancd2−/− vs Fancd2−/− + HU P = 0.0007), Fancd2+/+ + HU vs Fancd2−/− + HU, (P value = 0.01), and IL-6 Basel KO vs KO + HU P = 0.006), Fancd2+/++HU vs Fancd2−/− + HU, (P value = 0.01) (n = 4 independent experiments). G Flow cytometric analysis of MYC levels in Fancd2+/+ and Fancd2−/− MEFs under at both basal conditions and replication stress (HU: 200 μM working concentration) conditions, using proteasome inhibitor MG132 (2 μM final concentration) as a positive control (n = 5 independent experiments, basal Fancd2−/− vs Fancd2−/− + HU, P value = 0.001), basal Fancd2+/+ vs Fancd2−/− + HU, P value = 0.0006). Data are represented as mean ± SEM. In A, E, F, and G. and one-way ANOVA was considered for statistical analysis, *P < 0.05, **P < 0.01, ***P < 0.001, ****P < 0.0001, and ns: non-significant. All statistical analyses are two sided and were performed with GraphPad Prism7.0 software. Source data are provided as a Source Data file.
Fig. 5
Fig. 5. Ifnar1 haploinsufficiency rescues Fancd2−/− FL HSPC deficits.
A Schematic representation of timed mating and experimental overview created with BioRender.com released under a Creative Commons Attribution-NonCommercial-NoDerivs 4.0 International license. B Genetic deletion of one Ifnar1 allele normalizes endogenous MYC levels in Ifnar1+/− Fancd2−/− (n = 5/3) relative to Ifnar1+/− Fancd2+/+, and Ifnar1+/− Fancd2+/− (n = 6/3) FL HSPCs. C Relative rates of protein synthesis by in-vivo OPP analysis in Ifnar1+/− Fancd2+/+, Ifnar1+/− Fancd2+/− (n = 17/5) and Ifnar1+/− Fancd2−/− (n = 7/5) FL HSPCs and representative histogram of LT-HSCs. D Relative levels of TPE-MI MFI measuring unfolded proteins in Ifnar1+/− Fancd2+/+, Ifnar1+/− Fancd2+/− (n = 17/3) and Ifnar1+/− Fancd2−/− (n = 8/3) FL HSPCs and representative histogram of LT-HSCs. E Loss of one Ifnar1 alleles restores Fancd2−/− LT-HSC numbers to Fancd2+/+ levels in fetal livers from E14.5 embryos: Fancd2+/+ Fancd2+/− (n = 37/11), Fancd2−/− (n = 22/11) (P = 0.01), Fancd2−/− (n = 22/11) vs Ifnar1+/− Fancd2−/− (n = 17/10) (P = 0.04), Ifnar1+/− Fancd2+/+, Ifnar1+/− Fancd2+/− (n = 33/10) and Ifnar1+/− Fancd2−/− (n = 17/10). F Colony forming unit (CFU) formation by Fancd2+/+ (n = 7/3) or Fancd2−/− (n = 6/3) whole fetal liver cells (60 K) were plated on complete methylcellulose medium, and colonies were quantified after 7 days (far left panel = 0.045), CFU formation by adult BM lineage negative cells by (5 K) of Fancd2+/+ (n = 3 mice), Fancd2−/− (n = 3 mice) (left panel P = 0.02. CFU formation by Ifnar1+/− Fancd2+/+ (n = 9/3), Ifnar1+/− Fancd2−/− (n = 9/3) whole fetal liver cells (60 K) (right panel P = 0.9),and CFU formation by adult BM lineage negative cells (5 K) of Ifnar1+/−Fancd2+/+ (n = 3 mice)), Ifnar1+/−Fancd2−/− (n = 3 mice) (far right panel, P = 0.71). G Graphical abstract (created with BioRender.com released under a Creative Commons Attribution-NonCommercial-NoDerivs 4.0 International license) of the proposed model with increased sensitivity of Fancd2−/− FL HSPCs sterile inflammation driving proteostasis disruption and limited fetal HSC pool expansion in Fanconi Anemia mice. Data are represented as mean ± SEM. In B, C, D, and E One-way ANOVA was considered for statistical analysis, and in F data are represented as mean ± SD, t-test was used for statistical analysis. *P < 0.05, **P < 0.01, ***P < 0.001, ****P < 0.0001 and ns: non-significant. All statistical analyses are two sided and were performed with GraphPad Prism7.0 software. Source data are provided as a Source Data file.

Similar articles

Cited by

References

    1. Mikkola HK, Orkin SH. The journey of developing hematopoietic stem cells. Development. 2006;133:3733–3744. doi: 10.1242/dev.02568. - DOI - PubMed
    1. Collins, A., Mitchell, C. A. & Passegué, E. Inflammatory signaling regulates hematopoietic stem and progenitor cell development and homeostasis. J. Exp. Med.10.1084/jem.20201545. (2021). - PMC - PubMed
    1. Magee JA, Signer RAJ. Developmental stage-specific changes in protein synthesis differentially sensitize hematopoietic stem cells and erythroid progenitors to impaired ribosome biogenesis. Stem Cell Rep. 2021;16:20–28. doi: 10.1016/j.stemcr.2020.11.017. - DOI - PMC - PubMed
    1. López DA, et al. Prenatal inflammation perturbs murine fetal hematopoietic development and causes persistent changes to postnatal immunity. Cell Rep. 2022;41:111677. doi: 10.1016/j.celrep.2022.111677. - DOI - PMC - PubMed
    1. Beerman I, Seita J, Inlay MA, Weissman IL, Rossi DJ. Quiescent hematopoietic stem cells accumulate DNA damage during aging that is repaired upon entry into cell cycle. Cell Stem Cell. 2014;15:37–50. doi: 10.1016/j.stem.2014.04.016. - DOI - PMC - PubMed

MeSH terms

Substances