. 2024 Mar;56(3):570-582.
doi: 10.1038/s12276-024-01172-8. Epub 2024 Mar 1.

Synergistic toxicity with copper contributes to NAT2-associated isoniazid toxicity

Affiliations

Synergistic toxicity with copper contributes to NAT2-associated isoniazid toxicity

Jihoon G Yoon et al. Exp Mol Med. 2024 Mar.

Abstract

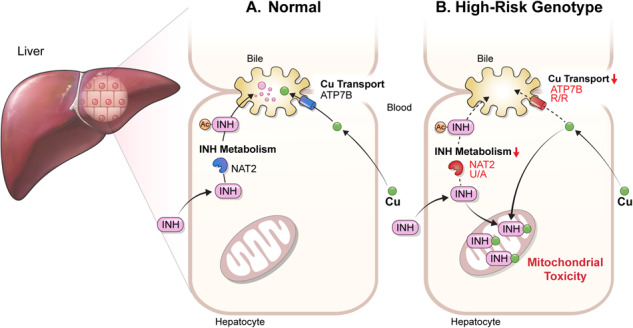
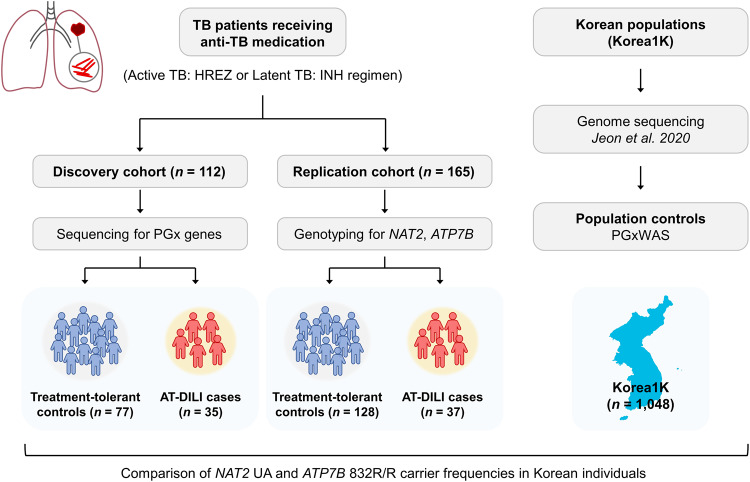
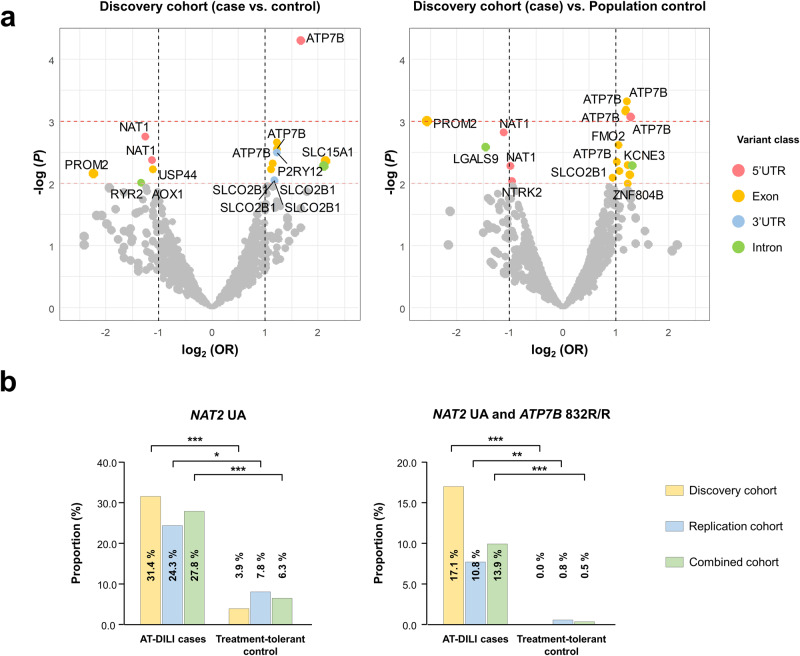
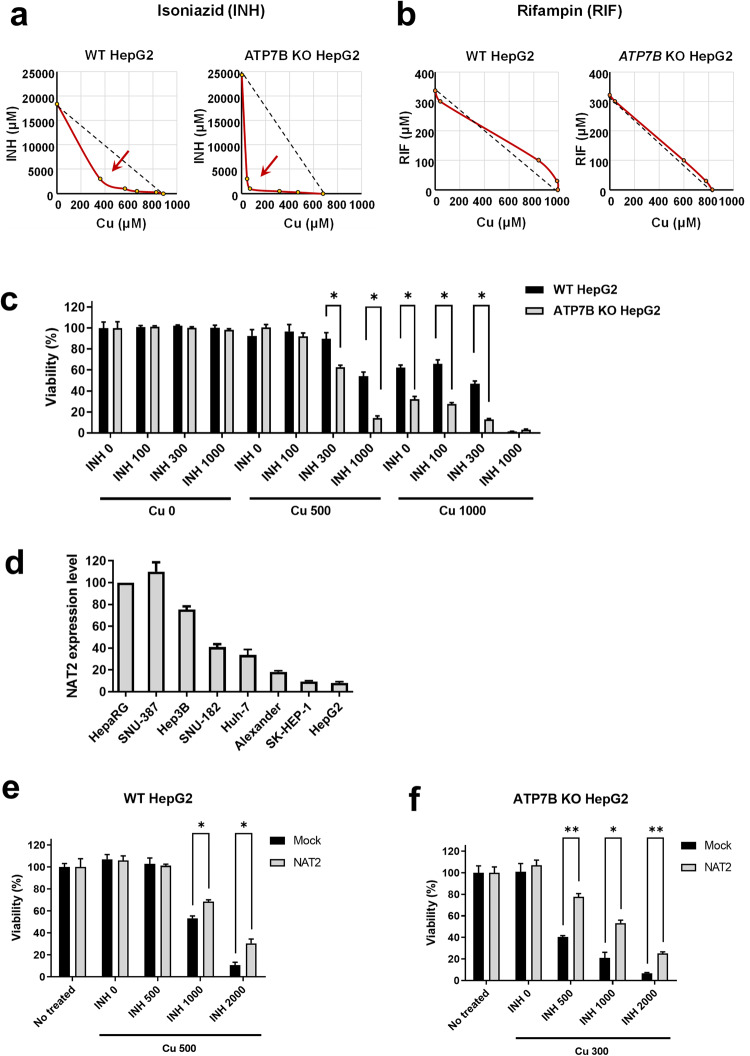
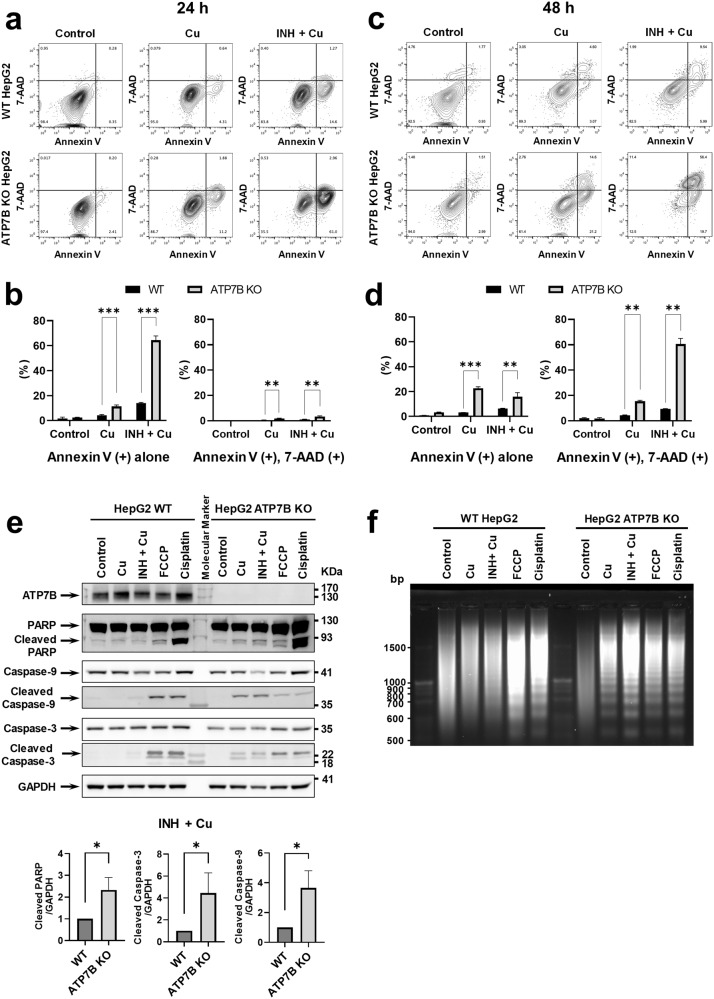
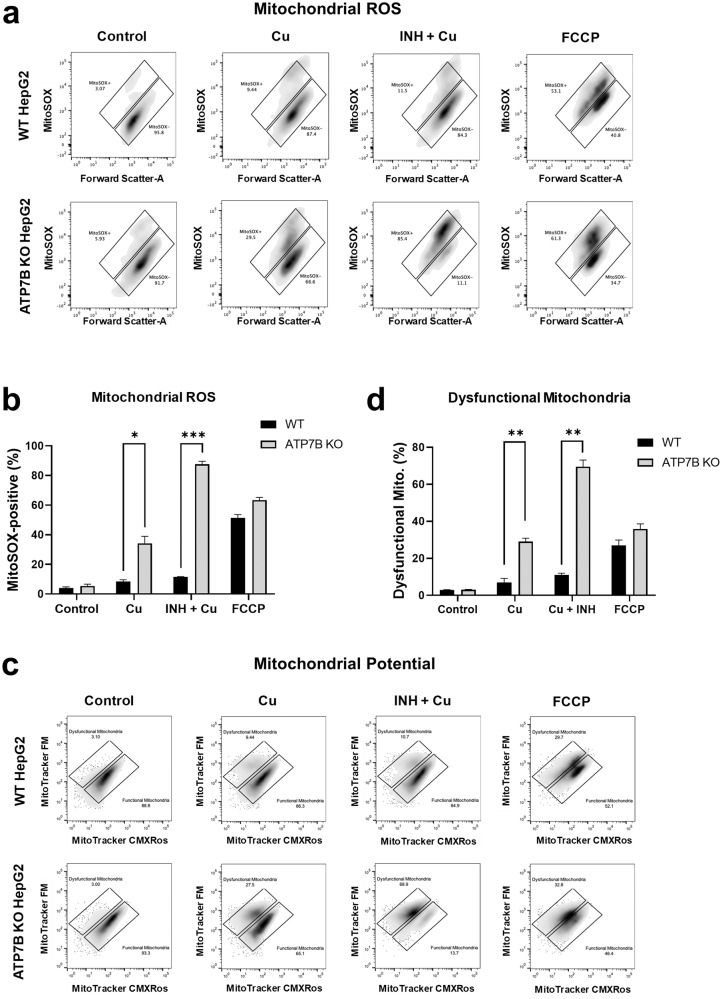
Anti-tuberculosis (AT) medications, including isoniazid (INH), can cause drug-induced liver injury (DILI), but the underlying mechanism remains unclear. In this study, we aimed to identify genetic factors that may increase the susceptibility of individuals to AT-DILI and to examine genetic interactions that may lead to isoniazid (INH)-induced hepatotoxicity. We performed a targeted sequencing analysis of 380 pharmacogenes in a discovery cohort of 112 patients (35 AT-DILI patients and 77 controls) receiving AT treatment for active tuberculosis. Pharmacogenome-wide association analysis was also conducted using 1048 population controls (Korea1K). NAT2 and ATP7B genotypes were analyzed in a replication cohort of 165 patients (37 AT-DILI patients and 128 controls) to validate the effects of both risk genotypes. NAT2 ultraslow acetylators (UAs) were found to have a greater risk of AT-DILI than other genotypes (odds ratio [OR] 5.6 [95% confidence interval; 2.5-13.2], P = 7.2 × 10⁻⁶). The presence of ATP7B gene 832R/R homozygosity (rs1061472) was found to co-occur with NAT2 UA in AT-DILI patients (P = 0.017) and to amplify the risk in NAT2 UA (OR 32.5 [4.5-1423], P = 7.5 × 10⁻⁶). In vitro experiments using human liver-derived cell lines (HepG2 and SNU387 cells) revealed toxic synergism between INH and Cu, which were strongly augmented in cells with defective NAT2 and ATP7B activity, leading to increased mitochondrial reactive oxygen species generation, mitochondrial dysfunction, DNA damage, and apoptosis. These findings link the co-occurrence of ATP7B and NAT2 genotypes to the risk of INH-induced hepatotoxicity, providing novel mechanistic insight into individual AT-DILI susceptibility. Yoon et al. showed that individuals who carry NAT2 UAs and ATP7B 832R/R genotypes are at increased risk of developing isoniazid hepatotoxicity, primarily due to the increased synergistic toxicity between isoniazid and copper, which exacerbates mitochondrial dysfunction-related apoptosis.


Conflict of interest statement

The authors declare no competing interests.

Figures

None
Yoon et al. showed that individuals who carry NAT2 UAs and ATP7B 832R/R genotypes are at increased risk of developing isoniazid hepatotoxicity, primarily due to the increased synergistic toxicity between isoniazid and copper, which exacerbates mitochondrial dysfunction-related apoptosis.
Fig. 1
Fig. 1. Study cohorts and workflow.
A schematic depiction illustrating the study cohorts and workflow. The study comprised two primary cohorts, discovery and replication cohorts, both of which consisted of patients who received anti-TB medications. In the discovery cohort, sequencing was conducted for a comprehensive set of 380 pharmacogenes. Subsequently, the replication cohort was genotyped specifically for the NAT2 and ATP7B genes. Furthermore, we included a Korean population control group, which was sourced from the Korean Genome Project dataset, encompassing genetic data for 1048 healthy individuals who had undergone genome sequencing.
Fig. 2
Fig. 2. Discovery of pharmacogenetic variants associated with AT-DILI.
a Volcano plots showing the log2-transformed odds ratio (OR) on the x-axis and -log P value on the y-axis of the pharmacogenome-wide association study (PGxWAS) conducted in two different controls. The left panel shows the results from the comparison of 35 AT-DILI patients vs. 77 treatment-tolerant controls, and the right panel shows the results from the comparison of 35 AT-DILI patients vs. 1048 population controls. The ATP7B gene consistently showed the strongest signal in these comparisons. The orange and red dashed lines represent significance thresholds of P < 0.01 and P < 0.001, respectively. b Higher frequencies of NAT2 UAs were observed in AT-DILI patients than in treatment-tolerant controls in both the discovery (n = 112) and replication (n = 165) cohorts (OR 5.6 [2.5–13.2], P = 7.2 × 10⁻⁶). Furthermore, the combination of NAT2 UAs with ATP7B 832R/R occurred more frequently in AT-DILI patients (OR 32.5 [4.5–1423], P = 7.5 × 10⁻⁶; *P < 0.05; **P < 0.01; ***P < 0.001).
Fig. 3
Fig. 3. Synergistic toxicity between isoniazid (INH) and copper (Cu) is regulated by ATP7B and NAT2 activities.
Assessment of drug synergism between copper (Cu) and antituberculosis drugs. In HepG2 cells, CC50 (the 50% cytotoxic concentration) values were measured for various combinations of a isoniazid (INH) or b rifampin (RIF) with Cu for 48 h. Isobolograms of CC50 values for INH-Cu and RIF-Cu cotreatments are shown. The dashed lines indicate the additive isobole (no interaction). A toxic synergistic effect between INH and Cu was observed but not between RIF and Cu. The toxic synergistic effect was more pronounced in ATP7B knockout (KO) cells. c Cell viability assay. The INH-induced cell death rate in the presence of Cu (for 24 h) was significantly greater in ATP7B KO cells than in wild-type (WT) cells. d Expression of NAT2 mRNA in eight human liver-derived cell lines was examined via quantitative reverse transcription PCR (n = 3). Among the cell lines tested, SNU387 cells exhibited the highest expression of NAT2, whereas HepG2 cells exhibited the lowest. e, f Exogenous expression of NAT2 attenuates the toxicity caused by treatment with INH and Cu (for 24 h) in HepG2 cells. The effect of exogenous NAT2 expression on cell survival was more pronounced in ATP7B KO cells (c, n = 5) than in WT cells (b, n = 5). Bar graph data are shown as the mean ± SEM. *P < 0.05 according to multiple t tests with FDR correction.
Fig. 4
Fig. 4. Reduced activity of NAT2 and ATP7B augments isoniazid (INH)-copper (Cu) toxicity in SNU387 and HepG2 liver-derived cells.
a, b Toxicity of INH-Cu (for 48 h) was assayed in SNU387 cells with knockdown of NAT2 and ATP7B. Gene knockdown of NAT2 was achieved via stable expression of shRNAs against NAT2, and that of ATP7B was achieved through transient transfection with siRNAs against ATP7B. Western blotting images verifying the effects of NAT2 and ATP7B knockdown (a). Single knockdown of either NAT2 or ATP7B partially reduced cell survival in the presence of INH and Cu (for 48 h), and double knockdown of NAT2 and ATP7B further augmented INH-Cu toxicity (b, n = 4). Bar graph data are shown as the mean ± SEM. *P < 0.05, **P < 0.01 by multiple t tests with FDR correction. Effects of exogenously supplementing ATP7B and NAT2 with the wild-type (WT) or mutant protein in ATP7B KO cells were examined. An example of immunoblotting for native and exogenous ATP7B expression is shown in c, and a summary of the densitometric analysis is shown in Supplementary Fig. 2b. Coexpression of WT and mutant ATP7B and NAT2 proteins in ATP7B KO cells via plasmid transfection was confirmed through immunoblotting (d). A cell viability assay was performed on cells treated with INH and Cu for 48 h e. Exogenous expression of WT ATP7B (K832) or NAT2 (*4) led to alleviation of INH-Cu toxicity. Cell survival effects were greatly diminished in cells expressing the mutant ATP7B-R832 and NAT2-UA (*7B) proteins. A (WT), ATP7B wild-type; A (R832), ATP7B-R832; N (WT), NAT2 wild-type; N (UA), NAT2*7B. Bar graph data are shown as the mean ± SEM (n = 5–8). *P < 0.05 by ANOVA followed by Tukey’s multiple comparison test. Concentrations of INH and Cu are in μM.
Fig. 5
Fig. 5. Isoniazid (INH) and copper (Cu) induce apoptosis in HepG2 cells.
a-d Examples of FACS dot plots constructed for HepG2 cells treated with INH (1000 µM) or Cu (500 µM) for 24 h or 48 h are shown in a and c, respectively. Summarized results of multiple experiments are presented in b and d (n = 3). Treatment with INH-Cu for 24 h strongly increased the percentage of annexin V-positive ATP7B KO cells, and a longer period of INH and Cu incubation (48 h) produced annexin V and 7-AAD double-positive cells. e Western blot analysis of apoptosis markers in HepG2 cells treated with INH or Cu for 24 h. Summarized results of multiple experiments are presented in the lower panels (n = 3). f Results of an apoptotic DNA fragmentation assay. Increased DNA fragmentation was noted in ATP7B KO cells treated with Cu alone or INH-Cu. Identical results were obtained in four independent experiments. Bar graph data are shown as the mean ± SEM. *P < 0.05, **P < 0.01, ***P < 0.001 by multiple t tests with FDR correction. FCCP (25 µM) and cisplatin (40 µM) were used as positive controls.
Fig. 6
Fig. 6. Isoniazid (INH) and copper (Cu) induce mitochondrial dysfunction in HepG2 cells.
Measurements of mitochondrial ROS generation using FACS analyses with MitoSOX. Examples of FACS dot plots are shown (a), and results of multiple experiments are presented in (b, n = 3). The percentage of MitoSOX-positive cells was greatly increased in ATP7B KO cells treated with INH (1000 µM) or Cu (500 µM) for 24 h. Measurement of functional mitochondria (%) using the MitoTracker system. MitoTracker CMXRos stains mitochondria in live cells, and its relative accumulation compared to MitoTracker FM depends on membrane potential. Examples of FACS dot plots are shown (c), and results of multiple experiments are presented in (d, n = 3). The percentage of dysfunctional mitochondria was greatly increased in ATP7B KO cells treated with INH or Cu for 24 h. Bar graph data are shown as the mean ± SEM. *P < 0.05, **P < 0.01, ***P < 0.001 by multiple t tests with FDR correction. FCCP (25 μM) was used as a positive control.

Similar articles

Cited by

References

    1. Furin J, Cox H, Pai M. Tuberculosis. Lancet. 2019;393:1642–1656. doi: 10.1016/S0140-6736(19)30308-3. - DOI - PubMed
    1. Andrade RJ, et al. Drug-induced liver injury. Nat Rev Dis Prim. 2019;5:58. doi: 10.1038/s41572-019-0105-0. - DOI - PubMed
    1. Tweed CD, et al. Liver toxicity associated with tuberculosis chemotherapy in the REMoxTB study. BMC Med. 2018;16:46. doi: 10.1186/s12916-018-1033-7. - DOI - PMC - PubMed
    1. Chalasani N, et al. Features and outcomes of 899 patients with drug-induced liver injury: The DILIN Prospective Study. Gastroenterology. 2015;148:1340–52.e7. doi: 10.1053/j.gastro.2015.03.006. - DOI - PMC - PubMed
    1. Parthasarathy R, et al. Hepatic toxicity in South Indian patients during treatment of tuberculosis with short-course regimens containing isoniazid, rifampicin and pyrazinamide. Tubercle. 1986;67:99–108. doi: 10.1016/0041-3879(86)90003-6. - DOI - PubMed

MeSH terms