. 2024 Mar;25(3):1650-1684.
doi: 10.1038/s44319-023-00041-1. Epub 2024 Feb 29.

mTert induction in p21-positive cells counteracts capillary rarefaction and pulmonary emphysema

Affiliations

mTert induction in p21-positive cells counteracts capillary rarefaction and pulmonary emphysema

Larissa Lipskaia et al. EMBO Rep. 2024 Mar.

Abstract

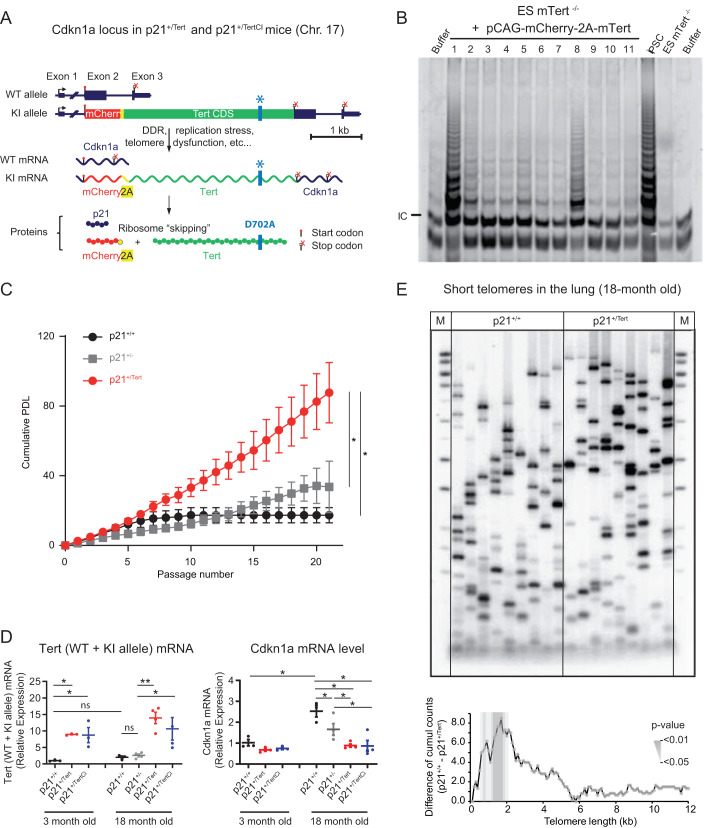
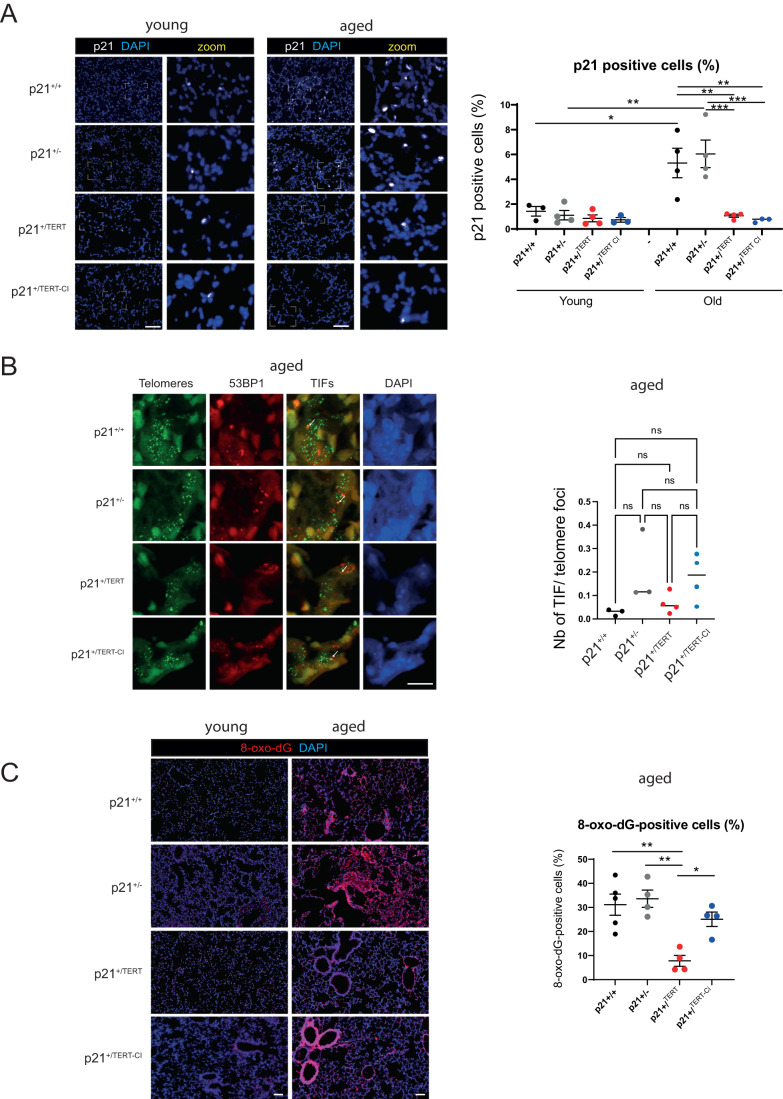
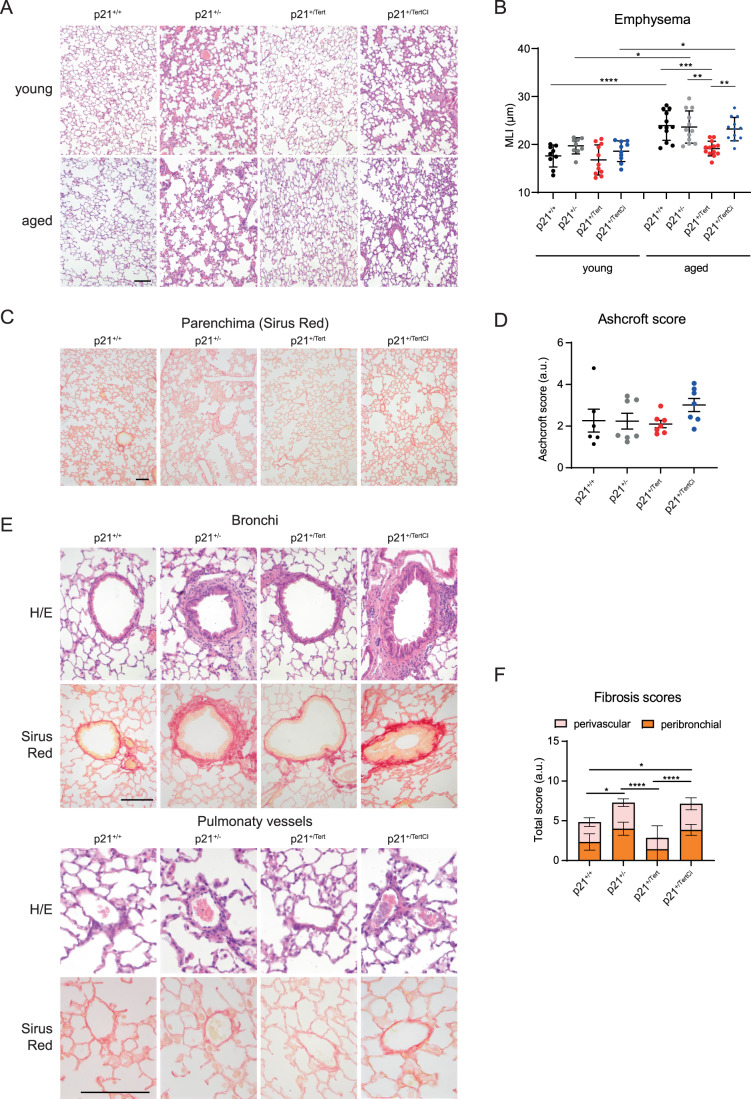
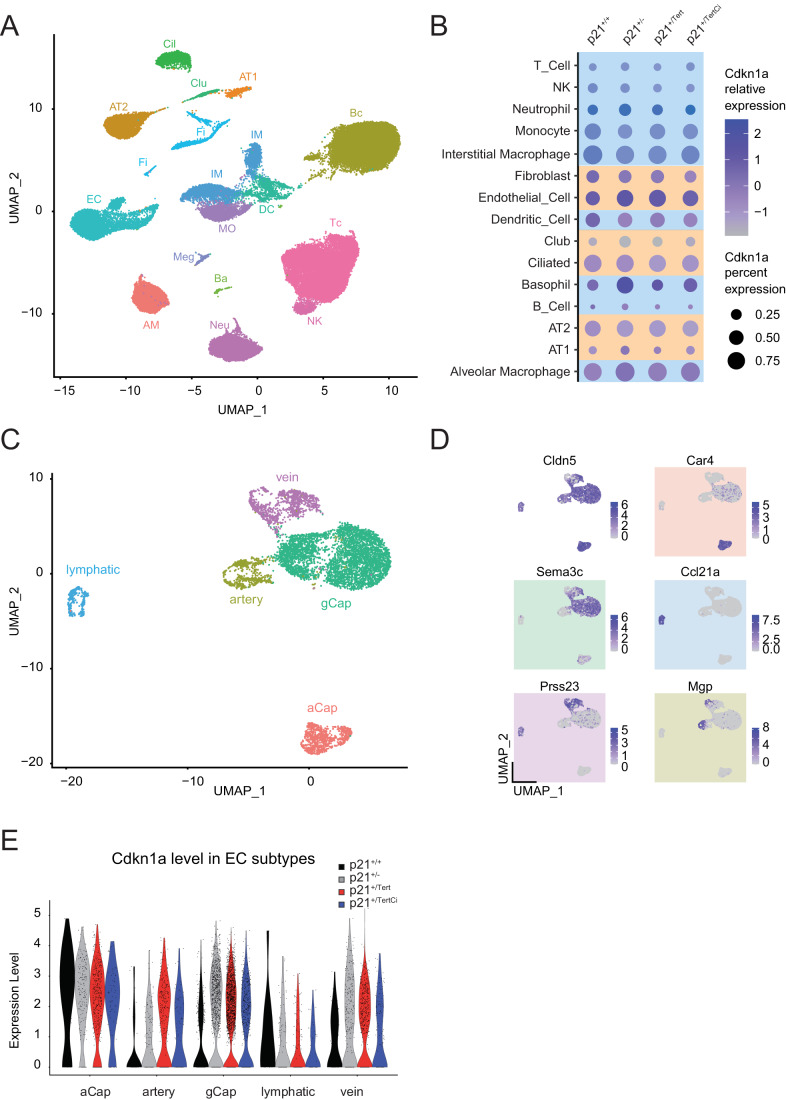
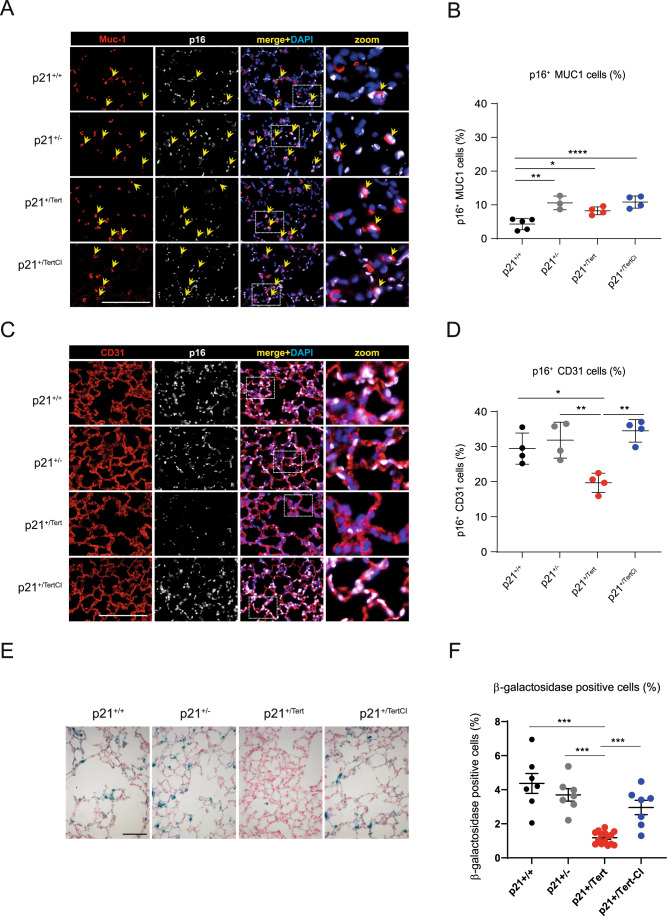
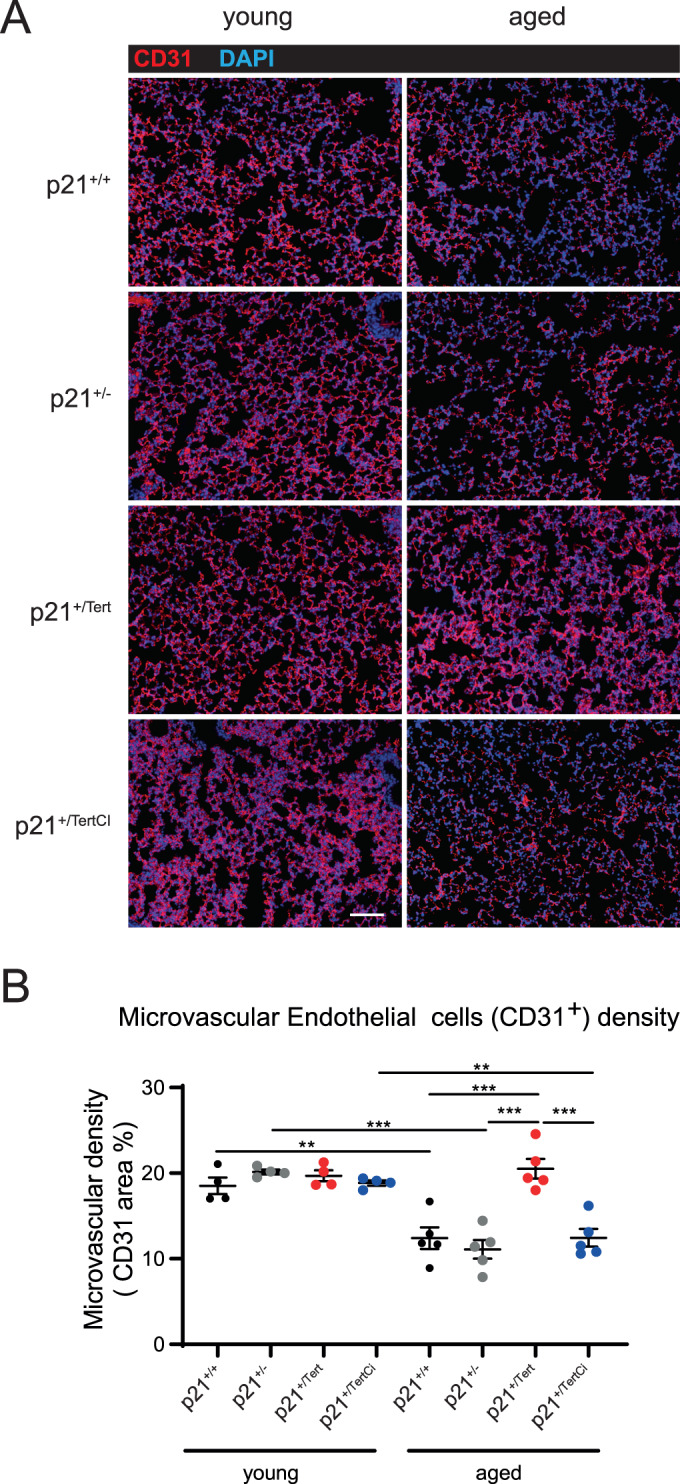
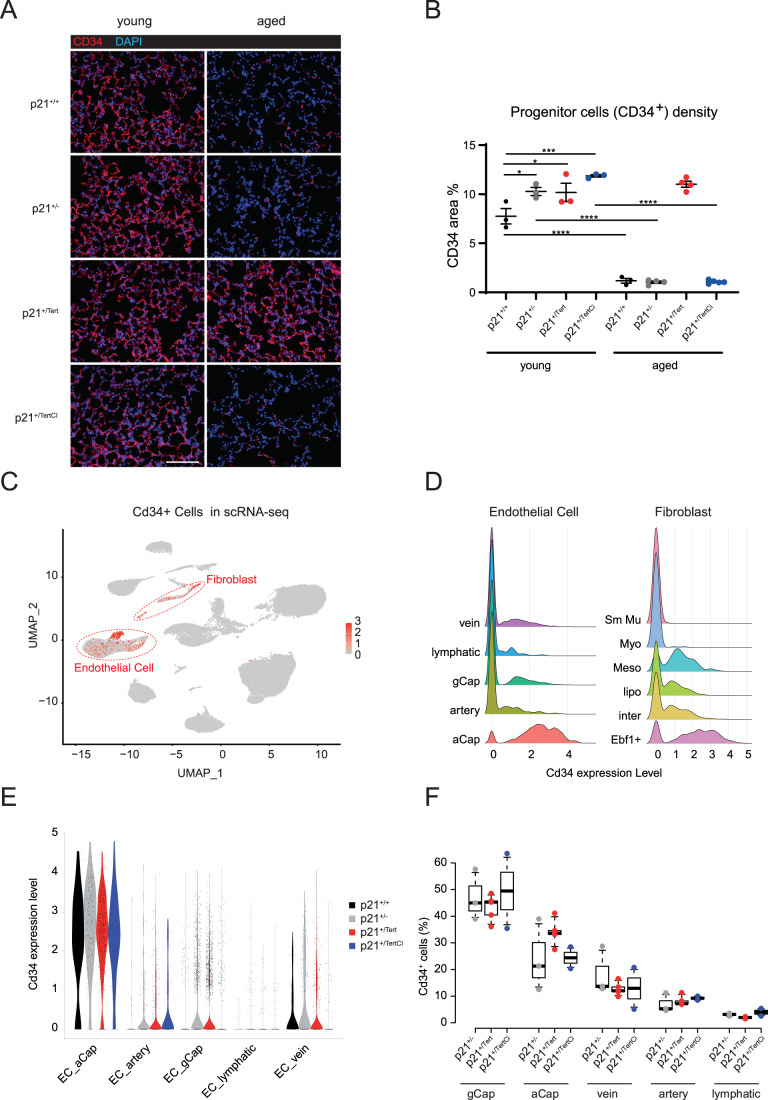
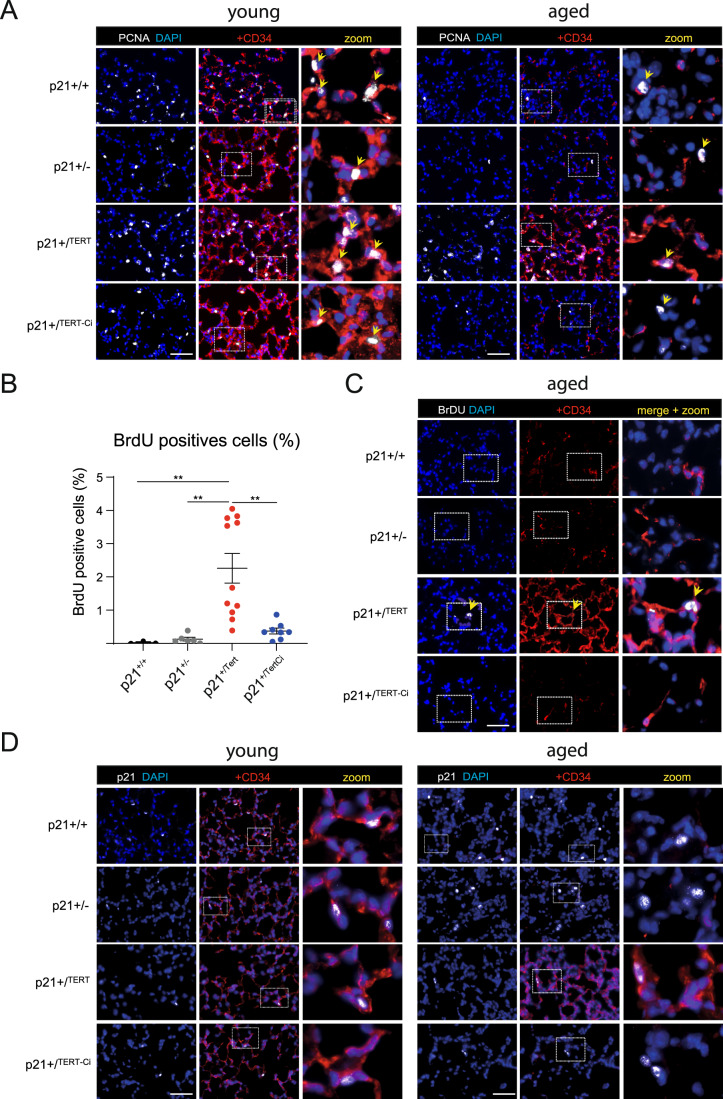
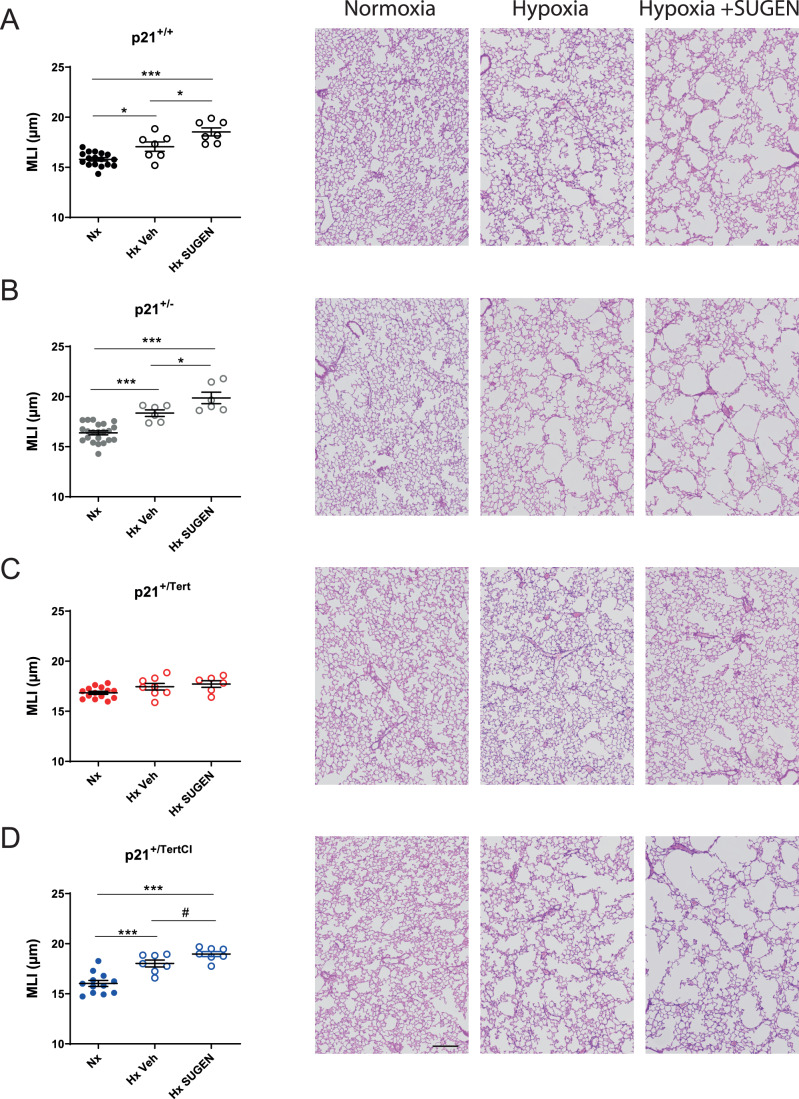
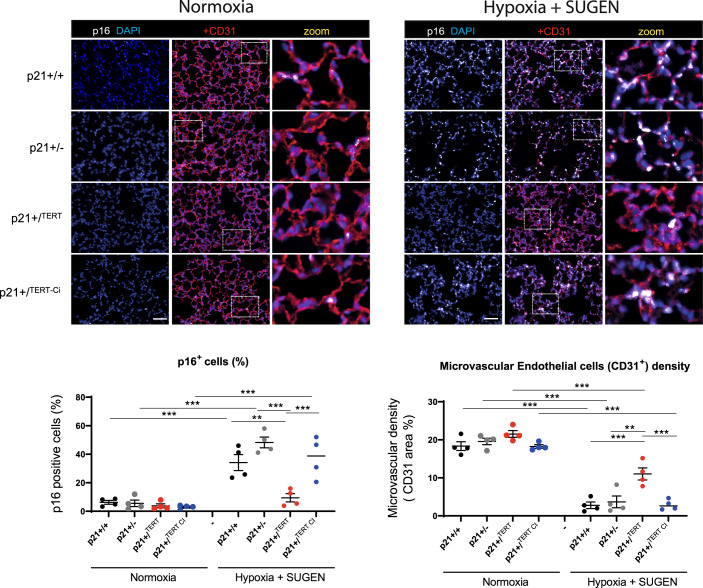
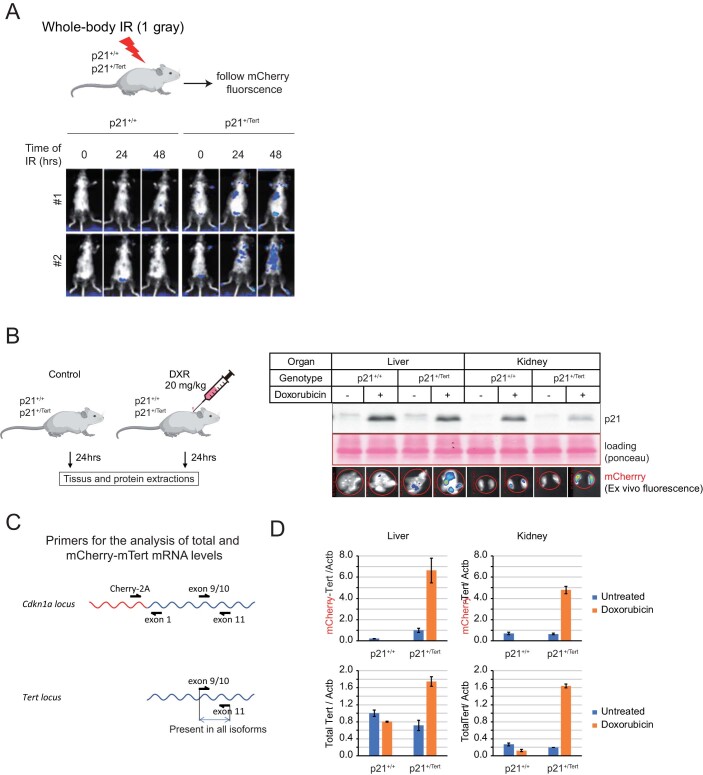
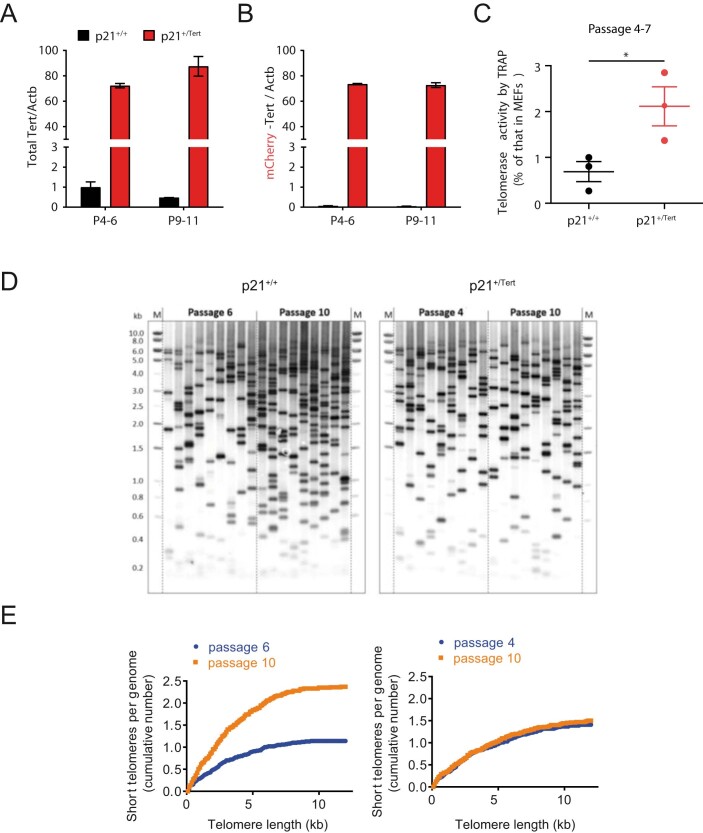
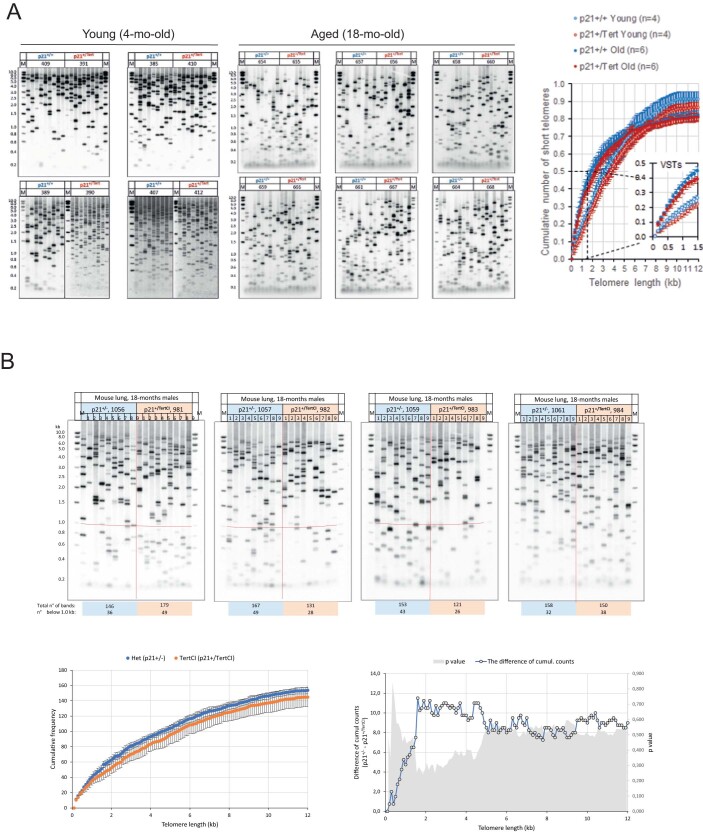
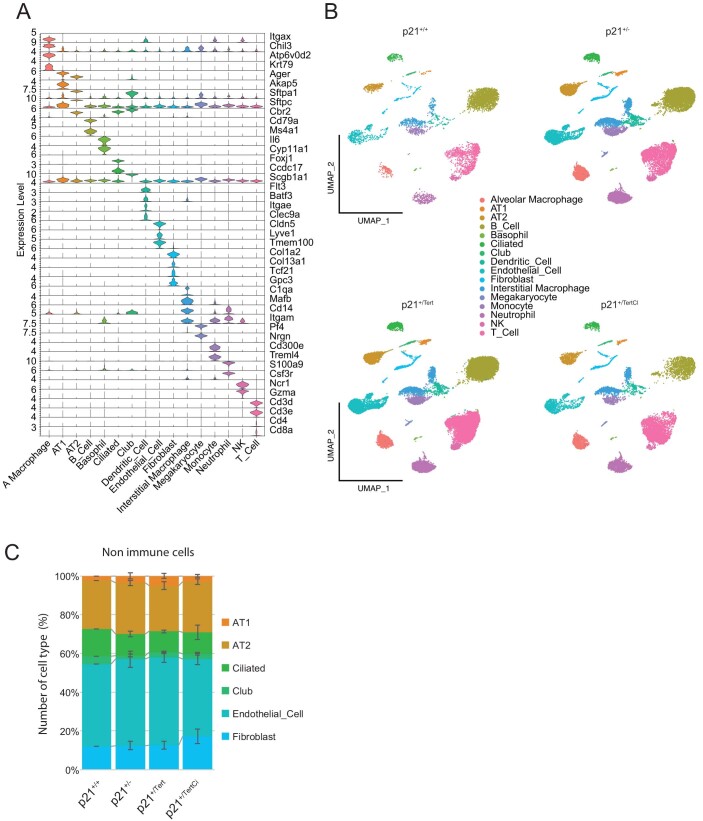
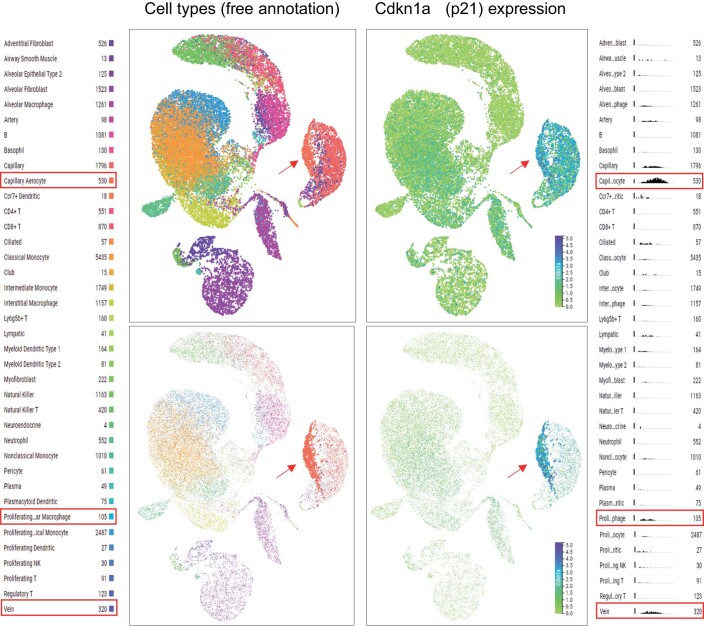
Lung diseases develop when telomeres shorten beyond a critical point. We constructed a mouse model in which the catalytic subunit of telomerase (mTert), or its catalytically inactive form (mTertCI), is expressed from the p21Cdkn1a locus. Expression of either TERT or TERTCI reduces global p21 levels in the lungs of aged mice, highlighting TERT non-canonical function. However, only TERT reduces accumulation of very short telomeres, oxidative damage, endothelial cell (ECs) senescence and senile emphysema in aged mice. Single-cell analysis of the lung reveals that p21 (and hence TERT) is expressed mainly in the capillary ECs. We report that a fraction of capillary ECs marked by CD34 and endowed with proliferative capacity declines drastically with age, and this is counteracted by TERT but not TERTCI. Consistently, only TERT counteracts decline of capillary density. Natural aging effects are confirmed using the experimental model of emphysema induced by VEGFR2 inhibition and chronic hypoxia. We conclude that catalytically active TERT prevents exhaustion of the putative CD34 + EC progenitors with age, thus protecting against capillary vessel loss and pulmonary emphysema.

Keywords: Capillary Density; Emphysema; Senescence; Telomerase; p21.


Conflict of interest statement

The authors declare no competing interests.

Figures

Figure 1
Figure 1. Construction and validation of the p21+/Tert mouse model.
(A) Schematic of the modified Cdkn1a locus, the mRNAs transcribed, and the proteins translated. The mCherry-2A-Tert cassette was inserted in place of the start codon of Cdkn1a (see Source data Fig. 1 for details). The gene locus is drawn to scale with intron 1 contracted. The 2A peptide sequence causes a “ribosomal skipping” that generates two independent polypeptides, mCherry and mTERT, from the same mRNA. In the mCherry-2A-TertCI cassette the codon GAT encoding D702 essential for mTERT catalytic activity has been replaced with GCA encoding A702. (B) To demonstrate that mTert expressed from the mCherry-2A-Tert cassette is functional, we transfected Tert-/- ES cells with a plasmid carrying mCherry-2A-Tert under control of the constitutively active pCAG promoter and checked telomerase activity in vitro. In vitro telomerase activity was assayed using Telomere Repeat Amplification Protocol (TRAP). The 6 bp ladder reflects telomerase activity. The arrow indicates the PCR internal control (IC). iPS and Tert-/- ES cells were used as positive and negative controls, respectively. (C) p21-promoter dependent mTert expression bypasses senescence in PA-SMCs ex vivo. Cumulative population doubling level (PDL) of PA-SMCs isolated from mice from the three mentioned genotypes. The data points are the mean values ± SD of 8 independent cultures established from individual mice. *p < 0,05 comparing p21+/Tert with p21+/+ and p21+/-, Student’s t test. (D) Left panel, relative expression of mTert mRNA (endogenous + transgene) in the whole lung samples measured by RT-qPCR. mTert expression is shown separately for young and old mice. Right panel, relative expression of Cdkn1a (p21) measured by RT-qPCR in the same lung samples. Data are expressed as individual values per mice and a mean value ± SEM per group. *p < 0.05; **< 0.01 (unpaired Student’s t test). (E) Telomere shortest length assay (TeSLA) performed on lung parenchyma from p21+/+ and p21+/Tert mice. The left panel depicts 2 representative Southern blots probed for the TTAGGG repeats while the right panel shows the difference of cumulative number of short telomeres between lungs from p21+/+ and p21+/Tert mice. This difference is significant for telomeres size range between 0.4 and 2.0 kb. Southern blots for all mice are shown in Fig. EV3. Source data are available online for this figure.
Figure 2
Figure 2. p21+/Tert and p21+/TertCI mice have reduced levels of p21 in lung parenchyma but similar levels of damaged telomeres.
(A) Left, Representative micrographs showing immunofluorescence of p21 (white) in lung cells. The zoomed areas are indicated by rectangle. Blue—DAPI nuclear staining. Scale bar—100 μm. Right, quantification of the percentage of DAPI-stained nuclei with a p21 foci. Quantification of a minimum of 10 images per mice are shown. *p < 0.05, **p < 0.01, ***p < 0.0001 according to two-way ANOVA test. (B) Left, Representative images of telomere FISH (green), 53BP1 immunodetection (red) and nucleus stained with DAPI (Blue) in lung section. Images represent the maximum intensity projection of the 5 µm section taken with a ×60 oil objective. White arrows indicate colocalization. Scale bar—10 μm. Right, Quantification in a lung section of the percentage of telomere colocalizing with 53BP1 done in 1 mm2 corresponding to a 4 × 4 tiling image. Lung section form at least 3 mice per conditions were analyzed. Over 10,000 telomeres where quantified per mice using Nikon NIS.ai. ns (not significant), according to two-way ANOVA followed by Tukey’s multiple range test. (C) Left, representative micrographs showing immunofluorescence of 8-hydroxy-2’-deoxyguanosine (8-oxo-dG) (red) in lung cells. Blue—DAPI nuclear staining. Scale bar—100 μm. Right, quantification of the percentage of 8-oxo-dG-stained nuclei. Lung sections from at least 4 mice per group were analyzed and the mean of the quantification of a minimum of 7 images per mice are shown. *p < 0.05, **p < 0.01 (one-way ANOVA test with Bonferroni correction). Source data are available online for this figure.
Figure 3
Figure 3. Telomerase protects against age-related emphysema and perivascular fibrosis.
(A) Representative micrographs showing lung parenchyma of young and old mice from the four mouse models. Hematoxylin/eosin staining. (B) Scatter plot showing mean liner intercept (MLI) in young and old mice. Data are expressed as individual values per image and a mean value ± SD per group. (C) Representative micrographs showing lung parenchyma of the aged mice stained with Sirius Red to visualize collagen deposition (red). (D) Scatter-plot graph showing parenchymal fibrosis quantification according to Aschcroft score. Data are expressed as individual values per image and a mean value ± SD per group. (E) Representative micrographs showing bronchi and pulmonary vessels of aged mice stained with H/E or Sirius Red. (F) Bar-graph showing perivascular and peribronchial fibrosis scoring. Fibrosis scores were attributed on 1–5 scale: 0—absent; 1—isolated mild fibrotic changes, 2—clearly fibrotic changes; 3—substantial fibrotic changes, 4—advanced fibrotic changes, 5—confluent fibrotic masses. Lung sections from 4 to 8 mice per group were analyzed. Data are expressed as mean ± SEM. Data information: For all graphs, *p < 0.05, **p < 0.01, ***p < 0.001, ****p < 0.0001 (One way ANOVA with Bonferroni correction). For (D), no significative differences. For all images, Scale bar—50 μm. Source data are available online for this figure.
Figure 4
Figure 4. p21 is preferentially expressed in lung endothelial cells.
Lung samples from 18 month-old WT (p21+/+), p21+/-, p21+/Tert and p21+/TertCI mice were analyzed. For all panels WT (n = 1), p21+/- (n = 3), p21+/Tert (n = 5), p21+/TertCI (n = 2). (A) Unsupervised Uniform Manifold Approximation and Projection for Dimension Reduction (UMAP) clustering of lung cells. Lung cell populations were identified using Mouse Cell Atlas (MCA) annotation procedure. (B) Dot plots of Cdkn1a expression in the different lung cell-types. The identified cell types are shown on the y-axis. The size of the dots represents the fraction of the cells expressing Cdkn1a. The color intensity represents the average expression level in p21-positive cells. Immune and constitutive lung cells are color-coded in blue and orange, respectively. (C) UMAP clustering of lung endothelial cells. Cell populations were identified based on known markers for these endothelial cell subtypes. (Art) artery EC cells; (Cap_1; also called aCap) capillary 1 EC cells; (Cap_2; also called gCap) capillary 2 EC cells; (Lym) lymphatic EC cells and (Vein) vein EC cells. (D) Representative markers used to annotate lung endothelial cell classes. (E) Violin plots showing p21 expression. ECs are subdivided into groups according to cluster and genotype (WT (black); p21+/- (gray), p21+/Tert (red) and p21+/Tert CI (blue). Source data are available online for this figure.
Figure 5
Figure 5. Endothelial cell senescence is attenuated in aged p21+/Tert mice.
(A) Representative micrographs showing immunofluorescence of p16 (white) in lung cells co-stained either with Muc1 (red, a marker of AT2 cells). Arrows indicate cells co-stained for Muc1 and p16. The zoomed areas are indicated by rectangles. Blue rectangle—DAPI nuclear staining. Scale bar—50 μm. (B) Scatter-plot graphs representing the percentage of p16+ Muc1+ cells in the different groups of mice. Data are expressed as individual values per mice and mean ± SEM for groups of mice. (C) Same as (A) except that p16 lung cells (white) are co-stained with CD31 (red, a marker of endothelial cells, lower panel). Scale bar—50 μm. (D) Same as (B) except that the graph represents the percentage of p16+ CD31+ cells. Data are expressed as individual values per mice and mean ± SEM for groups of mice. Data information: *p < 0.05, **p < 0.01, ****p < 0.001 (one way ANOVA with Bonferroni post hoc test). (E) Representative micrographs of SA-beta-Gal staining (blue) in the lungs of aged mice (18-month-old). Red: fast red nuclear staining. Scale bar: 50 µm. (F) Scatter-plot graph showing the percentage of SA-beta-Gal positive cells in each group. ***p < 0.01 (one way ANOVA followed by Bonferroni post hoc test). Source data are available online for this figure.
Figure 6
Figure 6. mTert expression in p21-positive cells counteracts age-related decline in capillary density.
(A) Representative micrographs showing immunofluorescence of CD31 (red, a marker of endothelial cells). Blue—DAPI nuclear staining. Scale bar—50 μm. (B) Scatter-plot graph showing microvascular density in different groups of young (4 months) and old (18 months) mice. Data are expressed as individual values per mice and mean ± SEM for groups of mice. **p < 0.01, ***p < 0.001 (one way ANOVA with Bonferroni post hoc test). Source data are available online for this figure.
Figure 7
Figure 7. mTert expression maintains a high number of CD34+ cells in the lungs of old mice.
(A) Representative micrographs showing immunofluorescence of CD34 (red). DAPI nuclear staining (blue). Bar—50 μm. (B) Scatter-plot graph showing lung area of CD34 expression in different groups of young (4 months) and old (18 months) mice. Data are expressed as individual values per mice and mean ± SEM for groups of mice. *p < 0.05, ***p < 0.001, ****p < 0.0001 (One way ANOVA with Bonferroni post hoc test). (C) UMAP clustering of lung cells from 1xWT, 3xp21+/-, 5xp21+/Tert and 2xp21+/TertCI mice. Cells expressing Cd34 gene are visualized by red dots (negative cells are in gray). (D) Ridget plot of Cd34 expression level for each subtype of EC and fibroblast cell types. (E) Violin plots representing the expression (log(counts)) of Cd34 in EC subtypes for each genotype. (F) Boxplot of the distribution of Cd34+ cells in each EC subtype relative to the total number of Cd34+ ECs. Individual mice are represented. p21+/- (×3, gray), p21+/Tert (×5, red) and p21+/TertCI (×2, blue). Source data are available online for this figure.
Figure 8
Figure 8. Lung CD34+ cells preserve their capacity to proliferate in aged p21+/Tert mice.
Representative micrographs of mice lung showing expression of CD34 (red) in lung of young and old mice of all genotypes co-stained with (A) anti-PCNA antibody (white, proliferating cells nuclear antigen), (C) anti-BrdU antibody (white), or (D) anti-p21 antibody (white). (A) Arrows indicate proliferating cells identified by nuclear PCNA immunofluorescence. The majority of proliferating cells were also co-stained with CD34. (B) Scatter-plot graph showing percentage of BrdU-positive cells in different types of mice. Data are expressed as individual values per mice and mean ± SEM for group of mice. **p < 0.01, (one way ANOVA with Bonferroni post hoc test). (C) Eighteen-month-old mice were injected with BrdU intra-peritoneally 24 h before organ sampling. Arrows indicate proliferating CD34+ cells incorporating BrdU. (D) In young mice of all genotypes the majority of p21+ cells are also co-stained with CD34. Among old mice, p21+ CD34+ cells can be detected only in p21+/Tert mice. Data information: Blue—DAPI nuclear staining. The zoomed areas are indicated by rectangle. Scale bar—50 μm. Source data are available online for this figure.
Figure 9
Figure 9. p21+/Tert mice exposed to SU5416 plus hypoxia are protected against emphysema.
(AD) Mice of the indicated genotypes were simultaneously treated with SU5416 and exposed to normoxia or chronic hypoxia (21 days). Lung emphysema as assessed by measurement of the mean linear intercept (MLI) in hematoxylin and eosin-stained lung sections. Data are expressed as individual values per mice and mean ± SEM for group of mice. *p < 0.05, ***p < 0.001 for comparison between groups as indicated (one-way ANOVA) followed by Tukey post hoc test). Scale bar—200 μm. Source data are available online for this figure.
Figure 10
Figure 10. p21+/Tert mice exposed to SU5416 plus hypoxia are protected against endothelial cell senescence and microvascular rarefication.
(Upper panel) Representative micrographs showing immunofluorescence of p16 (white, a marker of senescence) and CD31 (red, a marker of endothelial cells) in lung of young mice exposed to normoxia (left) or chronic hypoxia for 21 days (right). Blue—DAPI nuclear staining. Scale bar—50 μm. (Lower panel) Scatter-plot graphs showing cellular senescence (% of p16+ cells, left) and microvascular density (right) in the indicated groups of mice. Data are expressed as individual values per mice and mean ± SEM for group of mice. **p < 0.01, ***p < 0.001 (one-way ANOVA with Bonferroni post hoc test). Source data are available online for this figure.
Figure EV1
Figure EV1. Validation of p21+/Tert model.
(A) p21+/+ and p21+/Tert littermates were subjected to whole-body ionizing radiation (1.5 gray). The fluorescence emitted by the mCherry was followed post-irradiation at the indicated times by in vivo mCherry imaging (Excitation = 545 nm, Background = 495 nm, Emission = 615 nm). (B) Left panel, p21 expression and mCherry fluorescence were analyzed in the liver and kidneys after doxorubicin treatments. Right panel, livers and kidneys of p21+/+ and p21+/Tert mice were harvested 24 h after doxorubicin treatment. The level of p21 protein was evaluated by semi-quantitative immunoblotting and liver and kidney were imaged for mCherry fluorescence. (C) Primers to distinguish transgene expression from total Tert expression are shown. (D) Tert RT-qPCR experiments were performed using RNA extracted from the harvested organs. The mean and the SEM of the three biological PCR replicates are plotted. For both organs, the difference between the doxorubicin-treated and untreated samples is statistically significant (p < 0.001, unpaired Student’s t test) for the p21+/Tert but not p21+/+ mice.
Figure EV2
Figure EV2. p21-promoter dependent mTert expression bypasses senescence in PA-SMCs ex vivo (related to Fig. 1C).
(A, B) Quantification of the mTert mRNA levels in PA-SMCs from the p21+/+ and p21+/Tert 4-month-old mice (littermates) at early (p4-6) and late (p9-11) passage. Left panel represents the level of total Tert mRNA (transcribed from both the native Tert locus and KI allele), while right panel represents the level of Tert mRNA transcribed from KI allele only. Nearly all Tert mRNA is transcribed from the KI allele. The means of three independent measurements are plotted, and the error bars are SEs. The difference in the level of Tert mRNA between the p21+/+ and p21+/Tert cells is highly significant (p < 0.001, unpaired Student’s t test) for both early and late passages. (C) Telomerase activity measured by qTRAP at early passages. The data points correspond to vascular PA-SMC cultures established from individual p21+/+ and p21+/Tert 4-month-old mice. The data are expressed as the mean ± SEM. *p < 0.05 from the two-sided t test. (D, E) Analysis of the short telomere fraction by Telomere Shortest Length Assay (TeSLA) in the cultured PA-SMCs from p21+/+ and p21+/Tert mice. Southern blots probed for the TTAGGG repeats in (A) and quantification of the cumulative number of short telomeres across the telomere length thresholds in (E). Source data are available online for this figure.
Figure EV3
Figure EV3. Analysis of the individual short telomeres by TeSLA in the lungs of the young and old mice.
(A) TeSLA Southern blots depicting short telomeres in the lungs of the p21+/+ and p21+/Tert littermates (4 and 18-month-old mice). Genomic DNA was extracted from whole lungs and the length of individual short telomeres was determined by TeSLA. Note that young mice, regardless of their genotype, have less telomeres shorter than 1 kb compared to the old mice. The graph depicts cumulative number of short telomeres per genome in the range of 0.2–12 kb. The area corresponding to the very short telomeres (VSTs) is magnified in the inset. The mean values ± SEM are plotted. (B) TeSLA Southern blots depicting short telomeres in the lungs of the p21+/- and p21+/TertCI mice (18-month-old). TeSLA Southern blots are shown on top. The graph on the bottom left shows the cumulative frequency of short telomeres in the range of 0.2–12 kb for the mice of two genotypes. The graph on the bottom right depicts the difference of cumulative counts for 0.1 kb bins between the two genotypes (left y axis) and the corresponding p values from the two-tailed t test (right y axis). The difference is not significant for any bin indicating that TertCI is unable to improve the load of the short telomeres in old mice.
Figure EV4
Figure EV4. Lung cell types in the four mouse models.
(A) Representative markers use to annotate lung cell types in the four mouse models. (B) UMAP clustering of lung cells. Lung cell populations were identified in lung samples from WT (p21+/+), p21+/-, p21+/Tert and p21+/TertCI 18-month old mice. (C) Quantification of the cell types in lungs of the mice of the 4 indicated genotypes. At least 3 mice of each genotype were analyzed. The mean values ± SEM are plotted.
Figure EV5
Figure EV5. UMAP plots generated using lung droplet scRNA-seq data in Tabula Muris Senis.
The data for mice of all ages (1–30 months) were included. In the top panels all cell types are shown, while in the bottom panels only the capillary aerocyte population is highlighted. Red arrow points to the capillary aerocytes, and red boxes in the annotation mark cell types with elevated p21 expression level. Histograms (on the right) show scaled number of cells expressing p21 (y axis) versus expression level (x axis).

References

    1. Abbas T, Dutta A. p21 in cancer: intricate networks and multiple activities. Nat Rev Cancer. 2009;6:400–414. doi: 10.1038/nrc2657. - DOI - PMC - PubMed
    1. Afifi MM, Crncec A, Cornwell JA, Cataisson C, Paul D, Ghorab LM, Hernandez MO, Wong M, Kedei N, Cappell SD. Irreversible cell cycle exit associated with senescence is mediated by constitutive MYC degradation. Cell Rep. 2023;42(9):113079. doi: 10.1016/j.celrep.2023.113079. - DOI - PMC - PubMed
    1. Alder JK, Barkauskas CE, Limjunyawong N, Stanley SE, Kembou F, Tuder RM, Hogan BLM, Mitzner W, Armanios M. Telomere dysfunction causes alveolar stem cell failure. Proc Natl Acad Sci USA. 2015;112:5099–5104. doi: 10.1073/pnas.1504780112. - DOI - PMC - PubMed
    1. Alder JK, Guo N, Kembou F, Parry EM, Anderson CJ, Gorgy AI, Walsh MF, Sussan T, Biswal S, et al. Telomere length is a determinant of emphysema susceptibility. Am J Respir Crit Care Med. 2011;184:904–912. doi: 10.1164/rccm.201103-0520OC. - DOI - PMC - PubMed
    1. Alder JK, Armanios M. Telomere-mediated lung disease. Physiol Rev. 2022;02(4):1703–1720. doi: 10.1152/physrev.00046.2021. - DOI - PMC - PubMed