. 2024 Apr;25(4):1909-1935.
doi: 10.1038/s44319-024-00106-9. Epub 2024 Feb 29.

CKAP5 stabilizes CENP-E at kinetochores by regulating microtubule-chromosome attachments

Affiliations

CKAP5 stabilizes CENP-E at kinetochores by regulating microtubule-chromosome attachments

R Bhagya Lakshmi et al. EMBO Rep. 2024 Apr.

Abstract

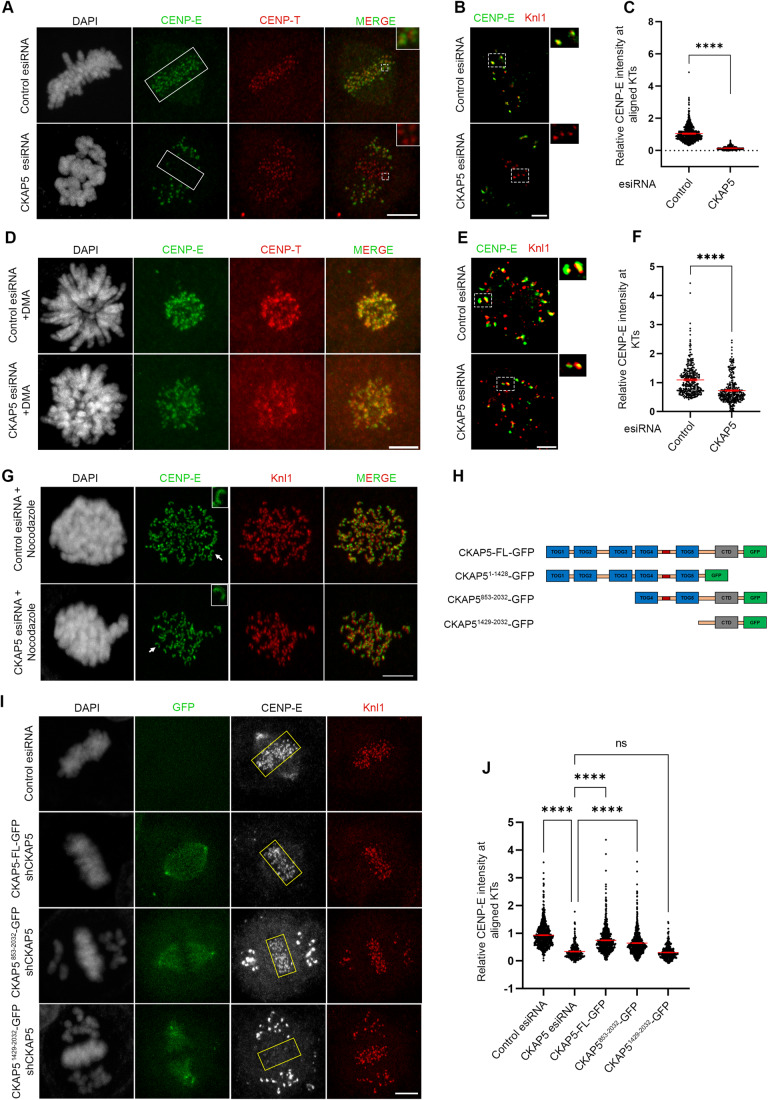
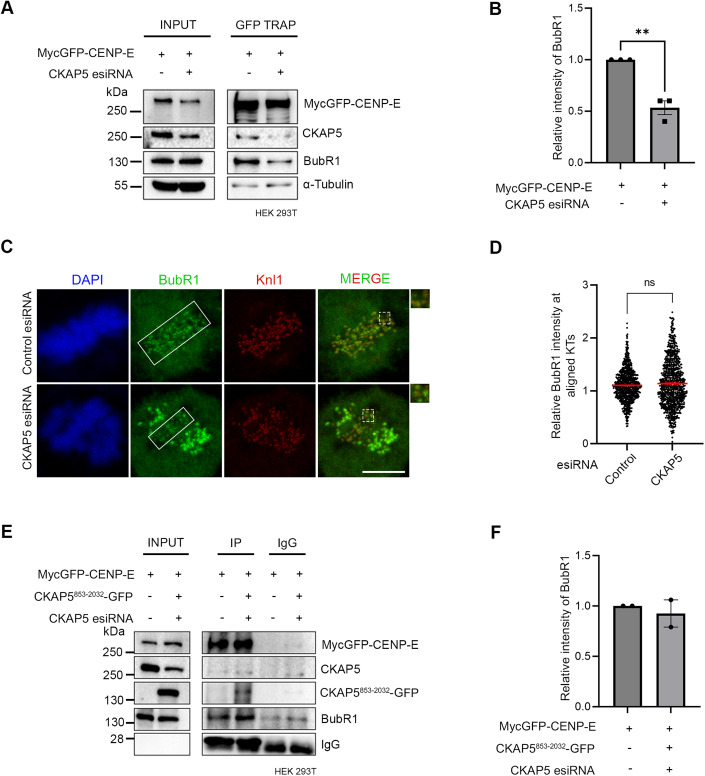
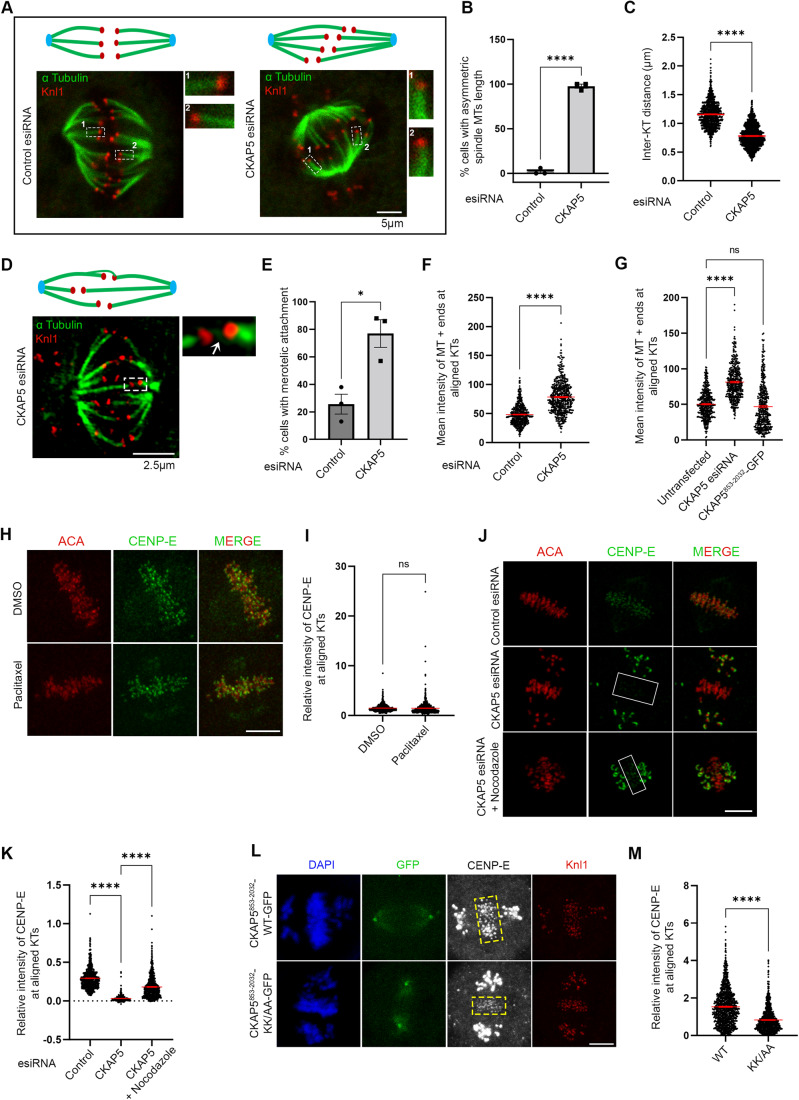
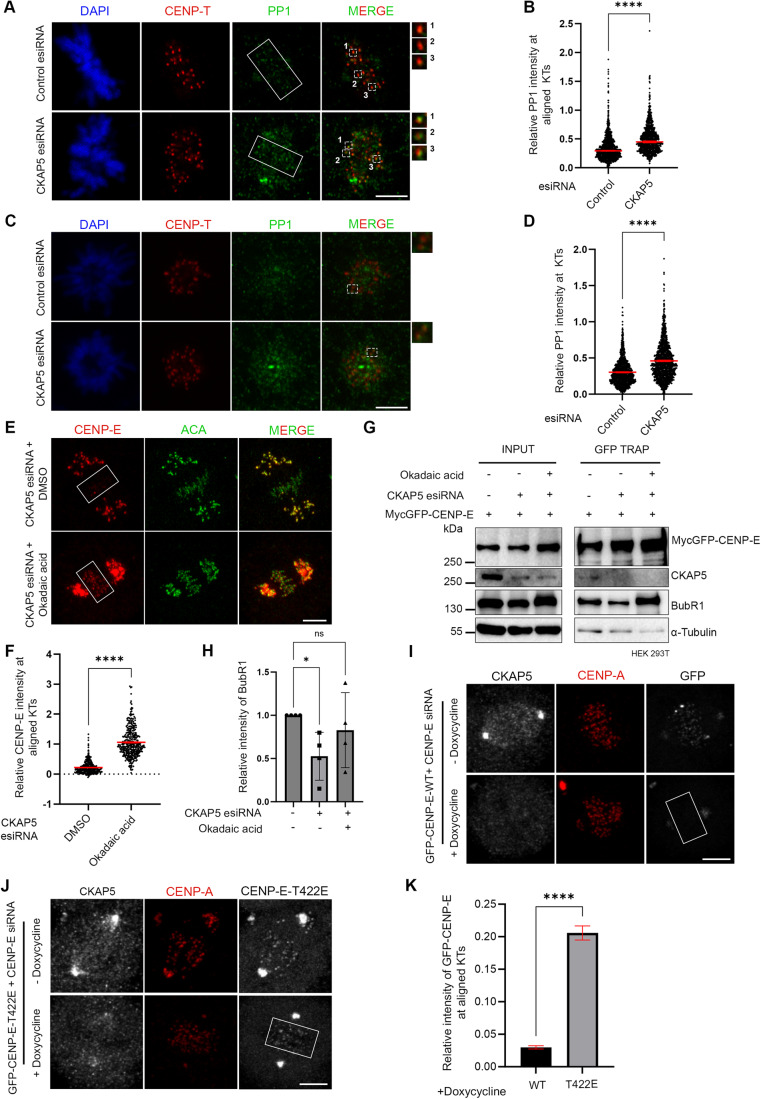
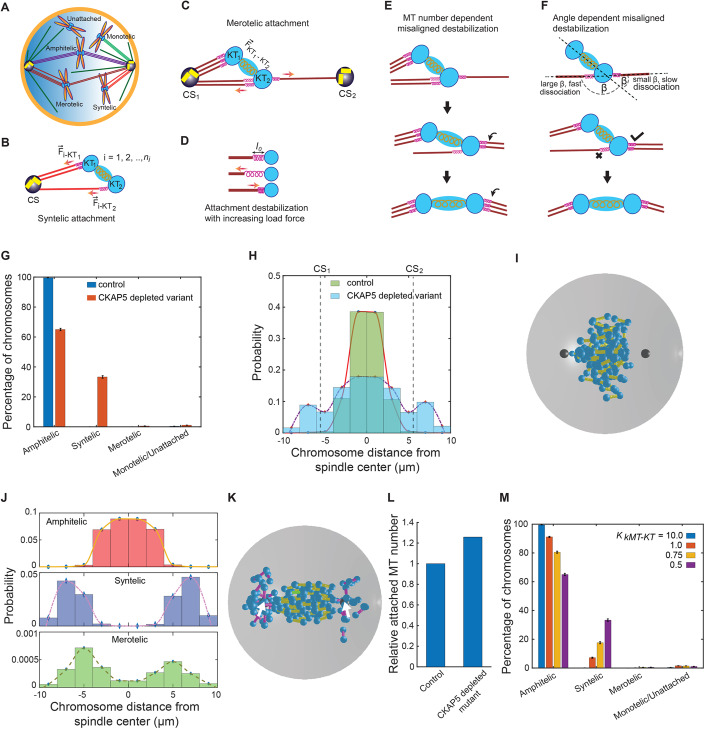
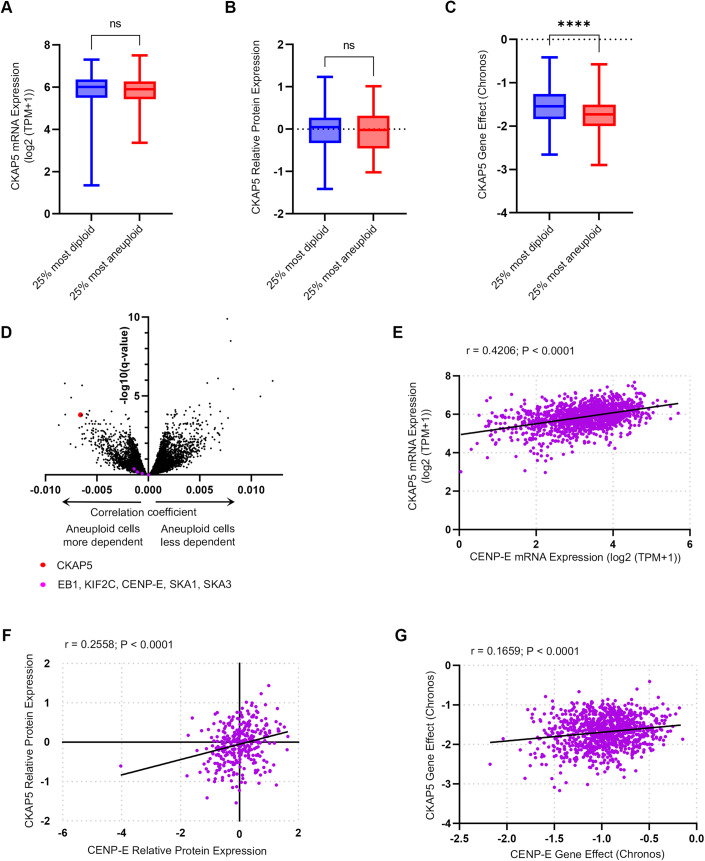
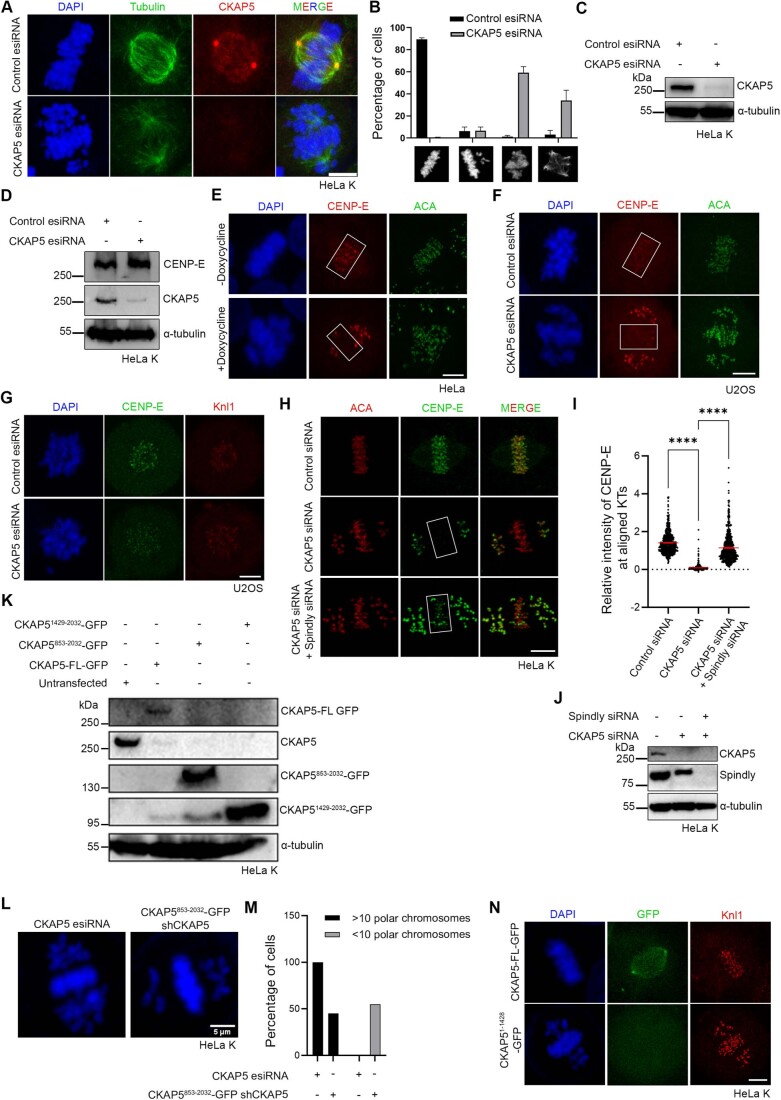
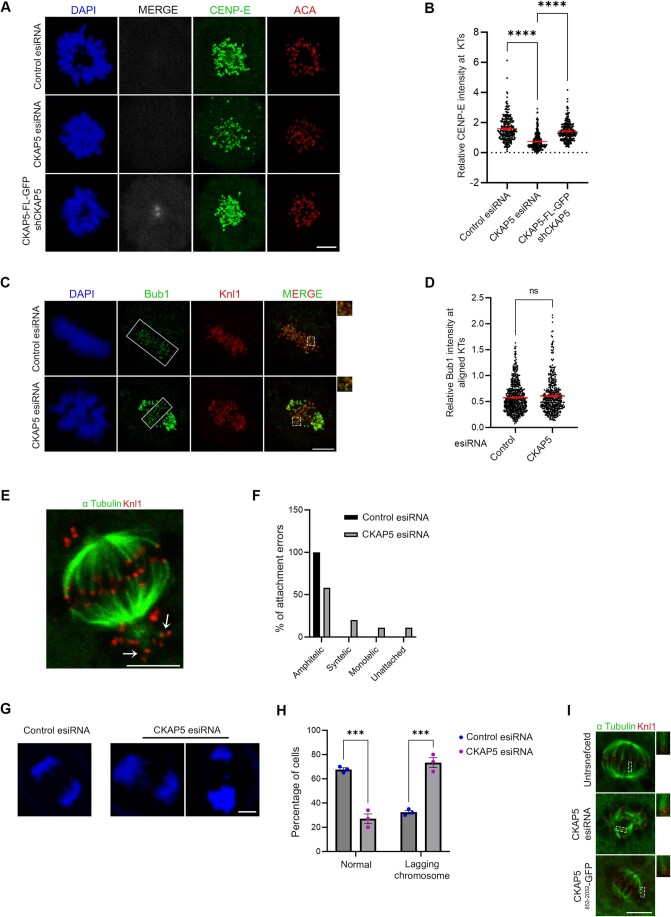
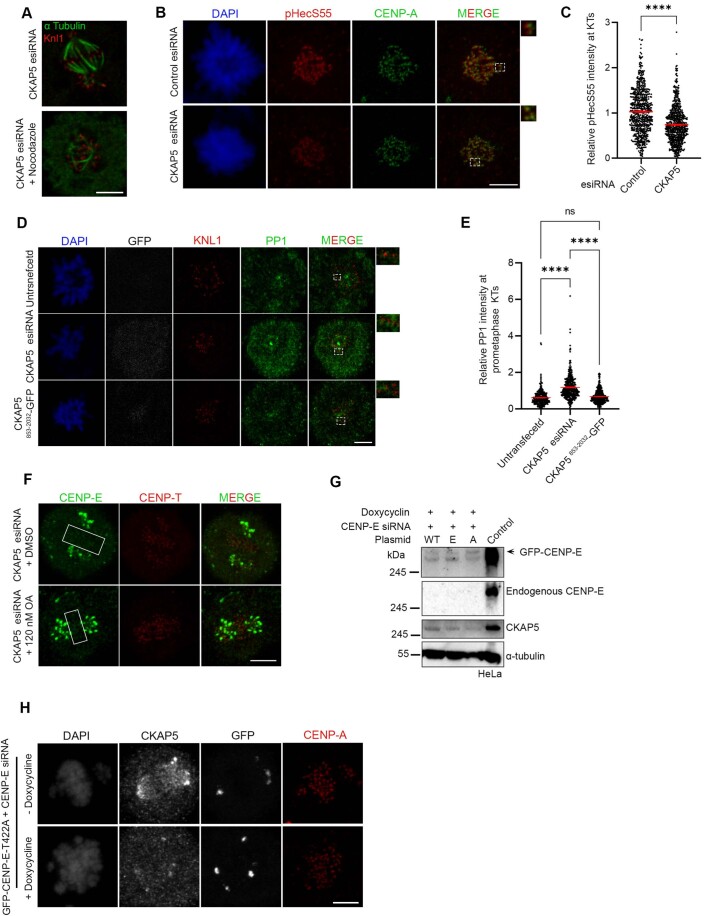
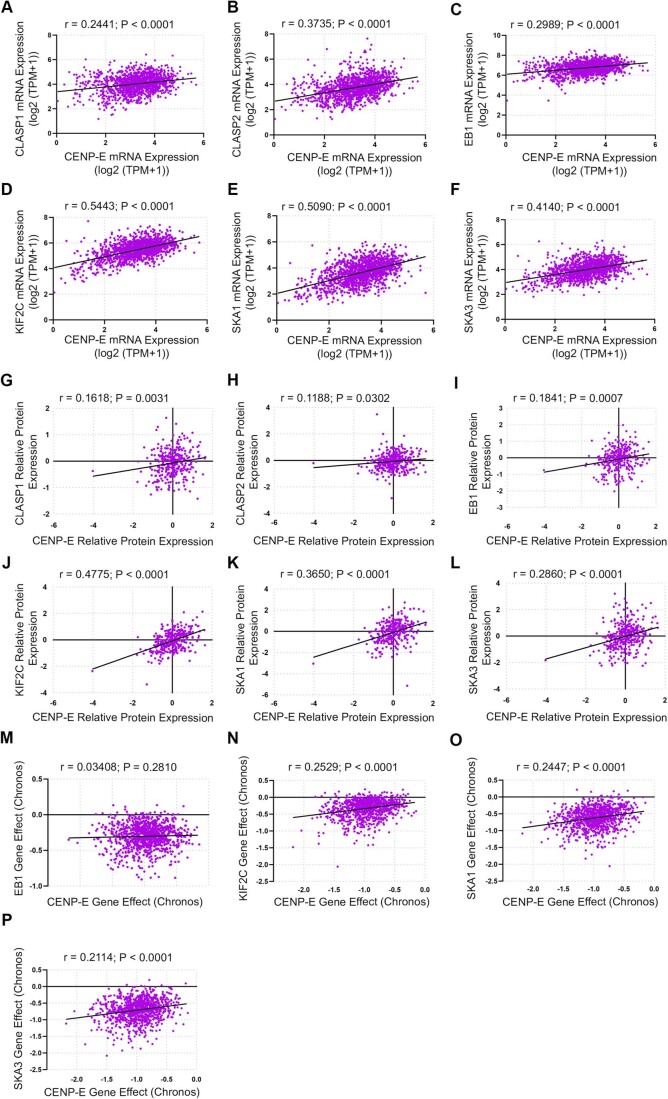
Stabilization of microtubule plus end-directed kinesin CENP-E at the metaphase kinetochores is important for chromosome alignment, but its mechanism remains unclear. Here, we show that CKAP5, a conserved microtubule plus tip protein, regulates CENP-E at kinetochores in human cells. Depletion of CKAP5 impairs CENP-E localization at kinetochores at the metaphase plate and results in increased kinetochore-microtubule stability and attachment errors. Erroneous attachments are also supported by computational modeling. Analysis of CKAP5 knockout cancer cells of multiple tissue origins shows that CKAP5 is preferentially essential in aneuploid, chromosomally unstable cells, and the sensitivity to CKAP5 depletion is correlated to that of CENP-E depletion. CKAP5 depletion leads to reduction in CENP-E-BubR1 interaction and the interaction is rescued by TOG4-TOG5 domain of CKAP5. The same domain can rescue CKAP5 depletion-induced CENP-E removal from the kinetochores. Interestingly, CKAP5 depletion facilitates recruitment of PP1 to the kinetochores and furthermore, a PP1 target site-specific CENP-E phospho-mimicking mutant gets stabilized at kinetochores in the CKAP5-depleted cells. Together, the results support a model in which CKAP5 controls mitotic chromosome attachment errors by stabilizing CENP-E at kinetochores and by regulating stability of the kinetochore-attached microtubules.

Keywords: CENP-E; CKAP5; Kinetochore; Microtubule; PP1.


Conflict of interest statement

The authors declare no competing interests.

Figures

Figure 1
Figure 1. CKAP5 is essential for CENP-E localization at congressed kinetochores.
(A) Representative immunofluorescence images showing partially aligned chromosomes of HeLa Kyoto cells after treatment (48 h) with control esiRNA or CKAP5 esiRNA stained for CENP-E (green), CENP-T (red) and DAPI (gray). Scale bar = 5 µm. Regions marked by dotted boxes in the merge images are enlarged in insets. (B) Structured illumination microscopy (SIM) images showing CENP-E (green) localization with respect to Knl1 (red) at the aligned KTs (single plane). Scale bar = 2 µm. Regions in dotted boxes are enlarged in insets. (C) Dot plots showing ratio of mean intensities of CENP-E/CENP-T (from A) at individual KTs that are aligned (for control)/partially aligned (for CKAP5 depleted) at the metaphase plate (shown in boxes) (n ~750 KTs). The intensity values obtained from three independent experiments are plotted. ****P < 0.0001 by Mann–Whitney test. Data represents mean +/− SEM. (D) Representative immunofluorescence images showing prometaphase chromosomes of HeLa Kyoto cells after treatment (48 h) with control esiRNA or CKAP5 esiRNA stained for CENP-E (green), CENP-T (red) and DAPI (gray). Scale bar = 5 µm. (E) Structured illumination microscopy (SIM) images showing CENP-E (green) localization with respect to Knl1 (red) at the prometaphase KTs (single plane). Scale = 2 µm. Regions in dotted boxes are enlarged in insets. (F) Dot plots showing ratio of mean intensities of CENP-E/CENP-T (from D) at individual KTs of prometaphase arrested cells (n ~300 KTs). The intensity values obtained from three independent experiments are plotted. ****P < 0.0001 by Mann–Whitney test. Data represents mean +/− SEM. (G) Nocodazole-treated control or CKAP5-depleted cells showing KT localization of CENP-E (green). Knl1 (red) was used as KT marker. Scale bar = 5 µm. KTs shown with arrows are enlarged in insets. (H) Schematic representation of various truncated CKAP5 proteins fused with C-terminal GFP tag. (I) Immunofluorescence images showing CENP-E (grey) localization at metaphase plate-aligned KTs of un-transfected HeLa Kyoto cells and cells expressing CKAP5-FL, CKAP5853-2032 and CKAP51429-2032 with simultaneous endogenous CKAP5-depleted condition. Knl1 (red) was used as KT marker. Scale bar = 5 µm. (J) Dot plot showing mean intensity ratio of CENP-E/Knl1 at plate-aligned (shown in yellow boxes (I)) KTs (n ~700 KTs). ****P < 0.0001 by one-way ANOVA. Data represent mean +/− SEM. Source data are available online for this figure.
Figure 2
Figure 2. CKAP5 regulates CENP-E–BubR1 interaction.
(A) GFP Trap pulldown from HEK 293T cells expressing MycGFP-CENP-E in endogenous CKAP5-depleted background showing reduced interaction of CENP-E with BubR1. (B) Mean intensity of BubR1 bands normalized with MycGFP-CENP-E bands from three independent experiments were plotted. **P = 0.0022, by Student’s t test. (C) Representative immunofluorescence image showing no significant change in localization of BubR1 at aligned KTs of control vs. CKAP5-depleted HeLa Kyoto cells (region marked with box in (C)). Insets show enlarged view of region marked by dotted boxes in the merge images. Scale bar = 5 µm. (D) Dot plots showing mean intensities of BubR1/Knl1 (n ~600 KTs) quantified from individual kinetochores of multiple cells from three independent experiments. The difference was shown to be nonsignificant by Student’s t test. (E) Myc pulldown from CKAP5-depleted HEK 293T cells expressing MycGFP-CENP-E and CKAP5853-2032-GFP showing rescue of CENP-E-BubR1 interaction. Same in cells without CKAP5 depletion is shown as control. (F) Mean intensities of BubR1 bands normalized with MycGFP-CENP-E bands (corresponding to (E)) from two independent experiments are plotted. All data represent mean +/− SEM. Data Information: A significant difference (**P = 0.0022) in CENP-E-BubR1 interaction is observed between control and CKAP5-depleted cells (n = 3) by Student’s t test for (B). No difference in CENP-E–BubR1 interaction is observed between control and CKAP5-depleted cells expressing CKAP5853-2032-GFP (n = 2). Source data are available online for this figure.
Figure 3
Figure 3. CKAP5 depletion leads to KT–MT attachment errors.
(A) Representative immunofluorescence images (single plane) showing control siRNA-treated and CKAP5-depleted HeLa Kyoto cells stained for α-Tubulin (green) and Knl1 (red). Cartoons depicting symmetric and asymmetric spindle MT lengths are shown. Dotted boxes highlighting microtubule thickness are enlarged in the inset. (B) Graph showing the percentage of cells having asymmetric MT lengths quantified from 30 cells. Dots represent the mean value of each experiment (N = 3) and bars represent their average. ****P < 0.0001 by Student’s t test. (C) Average inter- KT distance at aligned KTs of nearly 1000 sister KT pairs together from three independent experiments ****P < 0.0001 by Student’s t test. (D) Representative structured illumination microscopy (SIM) image of CKAP5-depleted cell showing merotelic attachment error (shown in the dotted box and inset with arrow showing the merotelic attached MT) at aligned KTs. The same is represented by a cartoon on top. α-Tubulin is stained green and Knl1 is stained red. (E) Graph showing the percentage of metaphase cells (n ~30 cells for each) with at least one merotelic attachment in control vs. CKAP5-depleted condition. Dots represent the mean values for each experiment (N = 3) and the bar represents the average of the three values. *P = 0.0142 by Student’s t test. (F) Dot plot showing individual values for mean intensity of MTs at plus ends attached to aligned KTs in control and CKAP5-depleted cells (n ~500 KTs) from three independent experiments. ****P < 0.0001 by Mann–Whitney test. (G) Dot plot showing individual values of mean MT plus end intensity of aligned KT-attached MTs in HeLa Kyoto un-transfected, cells expressing CKAP5 esiRNA and CKAP5853-2032-GFP expressing cells in CKAP5-depleted background (n ~400 KTs) from three independent experiments. ****P < 0.0001 by one-way ANOVA. (H) Representative immunofluorescence image showing CENP-E (green) localization at aligned KTs of cells treated with 10 µM paclitaxel for 30 min compared to that of DMSO-treated cells. ACA (red) was stained as KT marker. Scale bar = 5 µm. (I) Dot plot showing mean intensity of endogenous CENP-E at aligned KTs normalized with that of ACA where each dot represents individual KT (n ~900) quantified from multiple cells from three independent experiments. The difference was shown to be nonsignificant by the Student’s t test. (J) Representative immunofluorescence image showing CENP-E (green) localization at aligned KTs of CKAP5-depleted cells treated with 3.3 µM nocodazole or DMSO for 10 min compared to that of control metaphase cells (region marked in box). ACA (red) was stained as KT marker. Scale bar = 5 µm. (K) Dot plot showing mean intensity of endogenous CENP-E at aligned KTs (highlighted with boxes) normalized with that of ACA where each dot represents individual KT (n ~650) quantified from multiple cells from three independent experiments. ****P < 0.0001 by one-way ANOVA (L) Representative immunofluorescence image showing CENP-E (gray) localization at aligned KTs (region shown in boxes) of cells expressing CKAP5853-2032-WT-GFP vs CKAP5853-2032-KK/AA-GFP. Knl1 (red) was used as KT marker. Scale bar = 5 µm. (M) Dot plot showing mean intensity of CENP-E at aligned KTs (shown in boxes in (L)) normalized with that of Knl1 where each dot represents individual KT (n ~900) quantified from three independent experiments. ****P < 0.0001 by Mann–Whitney test. All data represent mean +/− SEM. Source data are available online for this figure.
Figure 4
Figure 4. CKAP5 regulates PP1 recruitment to KTs.
(A) Immunofluorescence images (single plane) showing mock-depleted and CKAP5-depleted HeLa Kyoto cells stained for PP1 (green), CENP-T (red), DAPI (blue). Dashed boxes show a few aligned KTs -associated PP1 and enlarged view of the same are shown in insets. (B) Dot plot showing individual KT mean intensity ratio of PP1/CENP-T at aligned kinetochores (region marked in rectangular boxes in (A)). Mean intensity values from three independent experiments are plotted (n ~1000 KTs). ****P < 0.0001 by Mann–Whitney test. (C) Immunofluorescence images (single plane) showing mock-depleted and CKAP5-depleted HeLa Kyoto cells that are arrested in prometaphase stained for PP1 (green), CENP-T (red), DAPI (blue). Dashed boxes show a few prometaphase KTs -associated PP1 and enlarged view of the same are shown in insets. (D) Dot plot showing individual KT mean intensity ratio of PP1/CENP-T at prometaphase KTs (n ~1400 KTs). Mean intensity values from three independent experiments are plotted. ****P < 0.0001 by Mann–Whitney test. (E) Representative immunofluorescence images showing CENP-E (red) localization at KTs in CKAP5-depleted cells treated with DMSO or 0.25 µM Okadaic Acid (OA) for 1 h. Rescue of CENP-E to the partially aligned KTs in the presence of OA is shown in box. ACA (green) was used as KT marker. (F) Plot of CENP-E fluorescence intensity normalized to ACA at aligned KTs in the CKAP5 depletion and CKAP5 depletion plus OA conditions. Data shown are mean values of three independent experiments, where intensities of individual KTs (n ~370 KTs) from the maximum projection images were quantified. ****P < 0.0001 by Mann–Whitney test. (G) GFP Trap pulldown showing CENP-E-BubR1 interaction in the absence and presence of 0.25 µM OA in endogenous CKAP5-depleted cells expressed with MycGFP-CENP-E. (H) Graph showing mean intensity of coprecipitated BubR1 normalized with MycGFP-CENP-E pull-down bands from four independent experiments of G. *P = 0.0332 by one-way ANOVA. (I, J) Representative immunofluorescence images showing KT localization of GFP-CENP-E-WT (I) and GFP-CENP-E-T422E (J) in the presence or absence of doxycycline in doxycycline-inducible CKAP5 KO HeLa cells under endogenous CENP-E depleted background. CENP-A (red) was used as KT marker. (K) Plot showing the significant rescue of CENP-E-T422E when compared to CENP-E-WT at aligned KTs (region marked with box in (I, J)) of CKAP5 KO cells. Mean intensities of GFP-CENP-E-WT and T422E mutant at aligned KTs normalized with that of CENP-A quantified from individual KTs (n~650–900 KTs) of multiple cells from three independent experiments are plotted. ****P < 0.0001 by Mann–Whitney test. Scale bar of all images = 5 µm. All data represent mean +/− SEM. Data Information: Rectangular boxes represent region (aligned KTs) taken for PP1 intensity analysis. Dotted boxes in merged image shows regions (single KTs of aligned chromosomes) that are enlarged in insets which shows increase in KT intensity of PP1 (green) in CKAP5-depleted condition. Each number in insets corresponds to the respective numbered dotted box (A). Dotted box in merged image shows few prometaphase KTs that are shown enlarged in insets. PP1 levels at KTs (green) are increased in CKAP5-depleted prometaphase cells (C). Rectangular boxes show CENP-E levels at the aligned KTs that are considered for intensity analysis. CENP-E levels (red) showed rescue upon treatment with okadaic acid (E). Rectangular boxes show region (aligned KTs) taken for GFP-CENP-E intensity analysis. GFP-CENP-E T422E showed stabilization when compared to GFP-CENP-E-WT (GFP in gray) under doxycycline-induced CKAP5 depletion (I, J). Source data are available online for this figure.
Figure 5
Figure 5. Results of the computational model with error correction mechanism.
(A) Schematic of various types of KT–MT attachments. (BF) Model depicting the mechanism of correction of syntelic and merotelic attachments; (B, D) shows the force-dependent correction of syntelic attachments and (CF) show the mechanism of correction of merotelic attachments through force dependence, attached MT number dependence and MT-KT attachment angle dependence. (G) Shows the percentage of chromosomes with various types of attachments in control and CKAP5-depleted mutant HeLa cells in our in silico model. n = 2000 × 80 KT pairs. (H) Chromosome distribution in control and mutant HeLa cells after 20 min from nuclear envelope breakdown and the onset of “search-and-capture” process; two vertical dashed lines denote the position of the centrosomes along the spindle axis. (I) Snapshot of control cell after 20 min from the onset of nuclear envelope breakdown. Cyan spheres indicate attached and unattached KTs; yellow, pink, and green cylinders indicate amphitelic, syntelic, and merotelic chromosomes, respectively; black spheres indicate centrosomes. (J) Distribution of amphitelic, syntelic and merotelic chromosomes in CKAP5-depleted mutant. n = 2000 × 80 KT pairs (K) Snapshot of a mutant HeLa cell 20 min after nuclear envelope breakdown; color scheme is the same as the sub-figure (I). Centrosomes are placed at ( ± 6.0, 0.0, 0.0) and denoted by two white arrows. (L) The relative number of total MTs connected to the KTs with amphitelic attachments in control and CKAP5-depleted mutant. (M) Variation of capture statistics with kMT–KT force strength. All the simulations were done with systems of 80 chromosomes and averages were taken over 2000 systems for every parameter value. n = 2000 × 80 KT pairs. The error bars in (G, M) represent the standard error of mean measured with respect to the corresponding mean values of the data. Data Information: Simulations were done with systems of 80 chromosomes (80 KT pairs) with 2000 different initial configurations of the chromosomes; n = 2000 × 80 KT pairs. The bar graphs in (G, M) are presented as mean ± SEM. Source data are available online for this figure.
Figure 6
Figure 6. Sensitivity to CKAP5 perturbation is associated with a high degree of aneuploidy and with sensitivity to CENP-E depletion.
Analyses of data from hundreds of cancer cell lines obtained from the cancer-dependency map release 22Q4 (Data ref: Tsherniak et al, 2017). (A, B) Chromosomally stable, near-diploid cell lines and chromosomally unstable, highly aneuploid cell lines express similar levels of CKAP5 on the mRNA (A) and protein (B) levels. n = 381 and 341 for the bottom and top aneuploidy quartiles, respectively, in (A) and n = 91 and 102 for the bottom and top aneuploidy quartiles, respectively, in (B). Two-sided T test (significance threshold: P value < 0.05) (A) P value = 0.8221, (B) P value = 0.3615. (C) Highly aneuploid cells are significantly more sensitive to the CRISPR-mediated knockout of CKAP5. n = 274 and 284 for the bottom and top aneuploidy quartiles, respectively. Two-sided T test, ****P < 0.0001. In all box plots, bar: median; box: 25th and 75th percentile; whiskers: minimal and maximal values. (D) Correlation between aneuploidy and sensitivity to CRISPR gene perturbation. Sensitivity to CKAP5 perturbation is very strongly associated with aneuploidy, while sensitivity to perturbation of other spindle/kinetochore genes is not correlated to aneuploidy at all. (E, F) CKAP5 and CENP-E are co-expressed on the mRNA (E) and protein (F) levels, across cancer cell lines. Pearson correlation; (E) r = 0.4206, P value < 0.0001, (F) r = 0.2558, P value < 0.0001. (G) Sensitivity to CKAP5 perturbation by CRISPR is associated with sensitivity to CENP-E depletion by CRISPR across cancer cell lines. Pearson correlation; r = 0.1659, P value < 0.0001. The data in plots (EG) is normalized to the mRNA expression of the proliferation marker MKI67 as a covariate using a linear model. Source data are available online for this figure.
Figure EV1
Figure EV1. CKAP5 depletion induces chromosome misalignment and removal of CENP-E from kinetochores.
(A) Representative immunofluorescence images showing level of CKAP5 depletion and chromosome misalignment phenotype. (B) Quantification of chromosome misalignment phenotypes (n > 100 cells in each case) in CKAP5-depleted cells compared to mock-treated (control esiRNA) cells from three independent experiments. Data represents mean +/− SEM. (C, D) Western blots showing level of CKAP5 depletion and corresponding cellular levels of CENP-E. (E) Representative immunofluorescence images showing removal of CENP-E from partially aligned KTs of inducible Cas-9 expressing CKAP5 knockout HeLa cells (regions shown in box). (F, G) Immunofluorescence images showing loss of CENP-E localization at the partially aligned metaphase KTs (regions show in box) and prometaphase KTs of U2OS cells depleted of endogenous CKAP5. (H) Representative immunofluorescence images showing rescue of CENP-E localization at aligned KTs in CKAP5-Spindly co-depleted HeLa Kyoto cells compared to control metaphase and CKAP5-depleted cells (regions shown in box). (I) Dot plot showing mean intensity of endogenous CENP-E at aligned KTs (highlighted with boxes) normalized with that of ACA where each dot represents individual KT (n = 400–550) quantified from multiple cells from three independent experiments. ****P < 0.0001 by one-way ANOVA. Data represents mean +/− SEM. (J) Western blot showing levels of CKAP5 and Spindly depletion in HeLa Kyoto cells. (K) Western blot showing endogenous CKAP5 depletion levels in the cells expressing GFP-tagged CKAP5-FL vs. different deletion constructs. (L) Immunofluorescence images showing chromosome phenotype in CKAP5-depleted cells (HeLa Kyoto) and in cells expressing fusion construct consisting of CKAP5853-2032-GFP and CKAP5-shRNA. (M) Plot showing percentage of cells (n = 73 cells) with less than 10 polar chromosomes in CKAP5853-2032-GFP-CKAP5-shRNA cells compared to CKAP5 esiRNA-treated cells (HeLa Kyoto). (N) Representative immunofluorescence image of HeLa Kyoto cell expressing CKAP51-1429-GFP in endogenous CKAP5-depleted background showing no recognizable KT or spindle localization. Scale bar of all images = 5 µm. Data Information: Chromosome congression defect and level of CKAP5 depletion (red) by immunofluorescence imaging (A). Rectangular boxes show aligned KTs with normal CENP-E localization in control vs. reduced CENP-E localization in CKAP5-depleted conditions (E, F). Doxycycline-inducible CKAP5 KO HeLa cells in (E) and U2OS cells in (F). CKAP5-depleted cells shows reduced CENP-E levels (green) at KTs compared to control cells when arrested in prometaphase by Eg5 kinesin inhibition (G). Rectangular boxes show region (aligned KTs) considered for CENP-E intensity analysis. Rescue in CENP-E levels (green) are observed upon co-depletion of spindly and CKAP5 (H). DAPI staining of chromosomes showing reduction in number of polar chromosomes upon expression of CKAP5853-2032-GFP compared to that in CKAP5-depleted condition (L). CKAP51-1429-GFP (green) showing no localization in HeLa Kyoto cells when compared to CKAP5-FL-GFP (green) under endogenous CKAP5-depleted condition (N).
Figure EV2
Figure EV2. CKAP5 depletion results in kinetochore-microtubule attachment errors and lagging chromosomes.
(A) Representative immunofluorescence images showing rescue of CENP-E (green) localization at prometaphase KTs of HeLa Kyoto cells expressing CKAP5-FL-GFP (grey) when compared to CKAP5-depleted cells. ACA (red) was used as KT marker. (B) Dot plot showing mean intensity of endogenous CENP-E at these KTs normalized with that of ACA where each dot represents individual KT (n ~270) quantified from multiple cells from three independent experiments. ****P < 0.0001 by one-way ANOVA. (C) Representative immunofluorescence image showing no significant change in localization of Bub1 at aligned KTs of control vs. CKAP5-depleted HeLa Kyoto cells. Insets show enlarged view of region marked by dotted boxes in the merge images. (D) Dot plots showing mean intensities of Bub1/Knl1 (n ~400 KTs) quantified from individual kinetochores of multiple cells from three independent experiments. (E) Representative immunofluorescence image showing syntelic attachments (marked with arrowheads) of polar chromosomes. (F) Plot showing percentage of amphitelic, syntelic, monotelic and unattached KTs (144 KT pairs from multiple cells) of pole-proximal chromosomes in CKAP5-depleted HeLa Kyoto cells. (G) Anaphase lagging chromosomes shown by CKAP5-depleted HeLa Kyoto cells. (H) Graph showing increased percentage of cells showing anaphase laggards upon depletion of CKAP5. More than 100 cells were analyzed from three independent experiments. ***P = 0.0007 by two-way ANOVA. (I) Representative immunofluorescence images (single plane) showing cold stable microtubule staining (α Tubulin in green; KNL1 in red) in HeLa Kyoto cells expressing CKAP5 esiRNA and CKAP5853-2032-GFP compared to un-transfected HeLa Kyoto cells. Region in dashed boxes is enlarged in inset. Scale bar of all images = 5 µm. All data represents mean +/- SEM. Data Information: Expression of CKAP5-FL-GFP (grey) rescued CENP-E levels (green) at prometaphase KTs under endogenous CKAP5-depleted condition (A). Rectangular boxes show region (aligned KTs) taken for Bub1 intensity analysis. Dotted boxes in merged images showing few KTs enlarged in inset. Bub1 (green) levels showed no difference (C). Arrows show KTs of polar chromosomes with syntelic attachments (E). DAPI staining of anaphase chromosomes of control and CKAP5-depleted cells. CKAP5-depleted cells showed multiple lagging chromosomes (G). Dotted rectangular boxes are enlarged in insets showing increased MT (green) thickness in CKAP5-depleted condition and rescued MT intensity upon expression of CKAP5853-2032-GFP (I).
Figure EV3
Figure EV3. CKAP5 depletion leads to increased PP1 activity at the partially aligned kinetochores.
(A) Representative immunofluorescence image showing partial destabilization of MTs in CKAP5-depleted HeLa Kyoto cells using 3.3 µM nocodazole for 10 min. (α Tubulin in green; KNL1 in red). (B) Immunofluorescence images showing pHecS55 (red) and CENP-A (green) at prometaphase kinetochores of control and CKAP5-depleted HeLa Kyoto cells. Insets show the enlarged view of the dashed boxes. (C) Dot plot showing mean fluorescence intensity of pHecS55 normalized to that of CENP-A quantified from individual kinetochores (n ~700 KTs) of multiple cells from three independent experiments. ****P < 0.0001 by Student’s t test. (D) Immunofluorescence images (single plane) showing PP1 (green) and KNL1 (red) at prometaphase KTs of HeLa Kyoto cells expressing CKAP5 esiRNA and CKAP5853-2032-GFP compared to un-transfected cells. Regions in dashed boxes are enlarged in insets. (E) Dot plot showing mean fluorescence intensity of PP1 from individual kinetochores (n ~400 KTs) normalized with that of KNL1. KTs from individual z planes of multiple cells were analyzed from three independent experiments. ****P < 0.0001 by one-way ANOVA. (F) Representative immunofluorescence image showing localization of CENP-E in CKAP5 esiRNA-treated cells incubated with DMSO or 120 nM okadaic acid. Boxes show region of aligned KTs. (G) Western blot showing endogenous CENP-E depletion and doxycycline-induced depletion of CKAP5 in doxycycline-inducible CKAP5 KO HeLa. (WT-Wildtype; A- T422A; E- T422E). (H) Representative immunofluorescence images showing KT localization of GFP-CENP-E-T422A in the presence or absence of doxycycline in doxycycline-inducible CKAP5 KO HeLa cells under endogenous CENP-E depleted background. All data represent mean +/− SEM. Scale bar of all images = 5 µm. Data Information: MTs (green) show partial destabilization upon treatment with 3.3 µM nocodazole for 10 min (A). Dotted boxes in merged image are enlarged in insets showing increased levels of pHecS55 (red) at prometaphase KTs upon CKAP5 depletion (B). Dotted boxes in merged image show few KTs that are enlarged in insets. PP1 levels (green) at prometaphase KTs were rescued upon expression of CKAP5853-2032-GFP (D). Rectangular boxes show level of CENP-E (green) at aligned KTs. No change in CENP-E levels were observed upon treatment with low concentration of okadaic acid to inhibit PP2A (F). GFP-CENP-E-T422A showed no localization to aligned KTs in the presence or absence of CKAP5 (H).
Figure EV4
Figure EV4. Correlation between CKAP5 and CENP-E with respect to other spindle/kinetochore proteins.
(AF) Correlation of mRNA expression of CENP-E and multiple spindle/kinetochore proteins. (A) CLASP1, (B) CLASP2, (C) EB1, (D) KIF2C, (E) SKA1, (F) SKA3. The correlation is similar across proteins and similar to the correlation between CKAP5 and CENP-E mRNA expression (Fig. 6E). (GL) Correlation of protein expression of CENP-E and multiple spindle/kinetochore proteins—(G) CLASP1, (H) CLASP2, (I) EB1, (J) KIF2C, (K) SKA1, (L) SKA3. The correlation is similar across proteins and similar to the correlation between CKAP5 and CENP-E protein expression (Fig. 6F). (MP) Correlation of sensitivity to CRISPR gene perturbation of CENP-E and multiple spindle/kinetochore proteins. All data is normalized to the mRNA expression of the proliferation marker MKI67 as a covariate using a linear model. (M) EB1, (N) KIF2C, (O) SKA1, (P) SKA3. The correlation is similar across proteins and to the correlation between CKAP5 and CENP-E CRISPR perturbation sensitivity (Fig. 6G). All data is normalized to the mRNA expression of the proliferation marker MKI67 as a covariate using a linear model. Two-sided Pearson’s correlation was used for all the data analysis.

Similar articles

Cited by

References

    1. Al-Bassam J, Chang F. Regulation of microtubule dynamics by TOG-domain proteins XMAP215/Dis1 and CLASP. Trends Cell Biol. 2011;21:604–614. doi: 10.1016/j.tcb.2011.06.007. - DOI - PMC - PubMed
    1. Antonio C, Ferby I, Wilhelm H, Jones M, Karsenti E, Nebreda AR, Vernos I. Xkid, a chromokinesin required for chromosome alignment on the metaphase plate. Cell. 2000;102:425–435. doi: 10.1016/S0092-8674(00)00048-9. - DOI - PubMed
    1. Auckland P, Roscioli E, Coker HLE, McAinsh AD. CENP-F stabilizes kinetochore-microtubule attachments and limits dynein stripping of corona cargoes. J Cell Biol. 2020;219:e201905018. doi: 10.1083/jcb.201905018. - DOI - PMC - PubMed
    1. Barr AR, Bakal C. A sensitised RNAi screen reveals a ch-TOG genetic interaction network required for spindle assembly. Sci Rep. 2015;5:10564. doi: 10.1038/srep10564. - DOI - PMC - PubMed
    1. Barr AR, Gergely F. MCAK-independent functions of ch-Tog/XMAP215 in microtubule plus-end dynamics. Mol Cell Biol. 2008;28:7199–7211. doi: 10.1128/MCB.01040-08. - DOI - PMC - PubMed