. 2024 Mar;26(3):404-420.
doi: 10.1038/s41556-024-01366-2. Epub 2024 Feb 29.

CAMSAPs and nucleation-promoting factors control microtubule release from γ-TuRC

Affiliations

CAMSAPs and nucleation-promoting factors control microtubule release from γ-TuRC

Dipti Rai et al. Nat Cell Biol. 2024 Mar.

Abstract

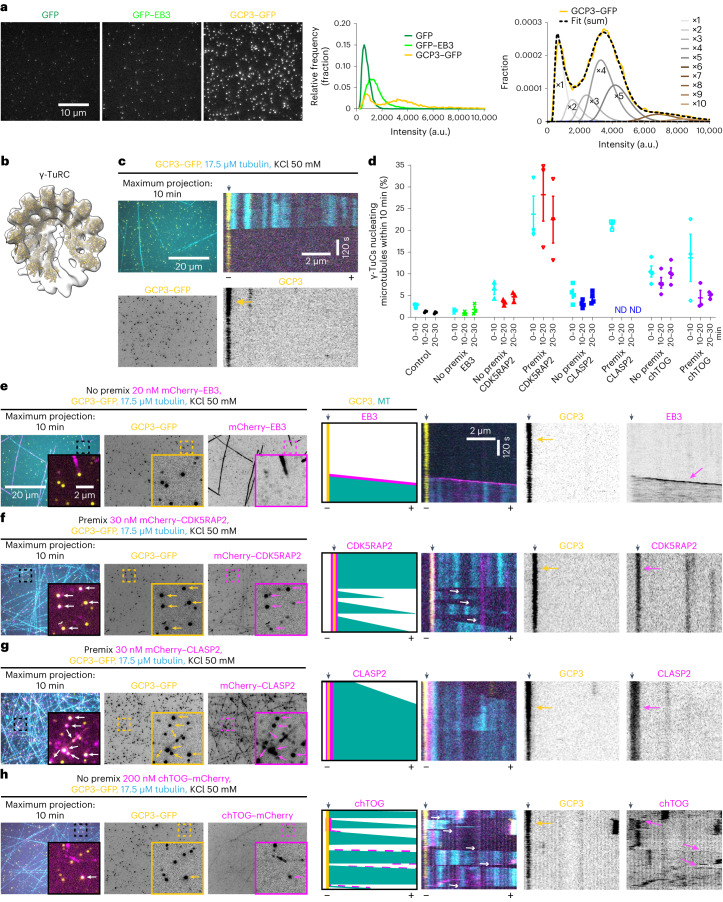
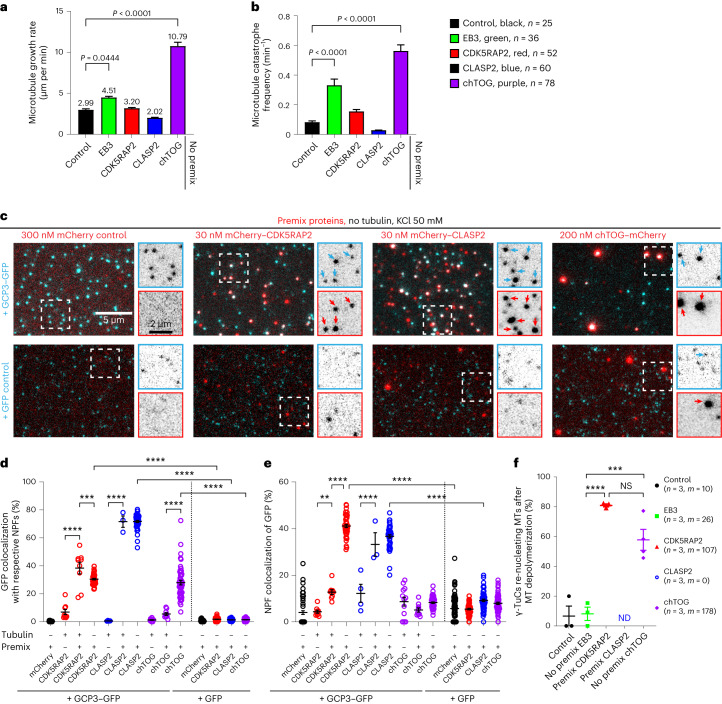
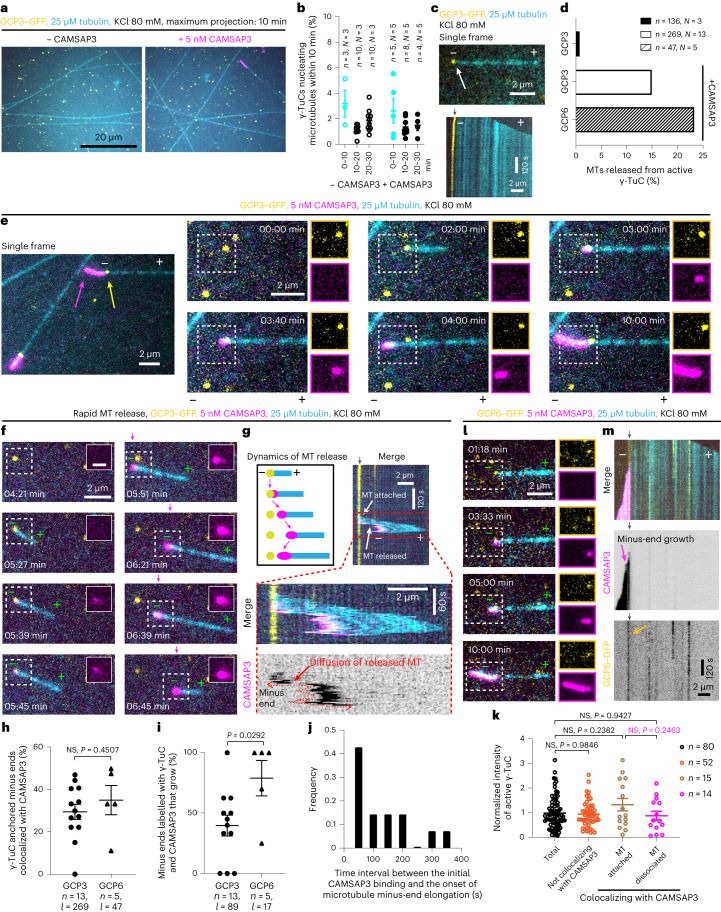
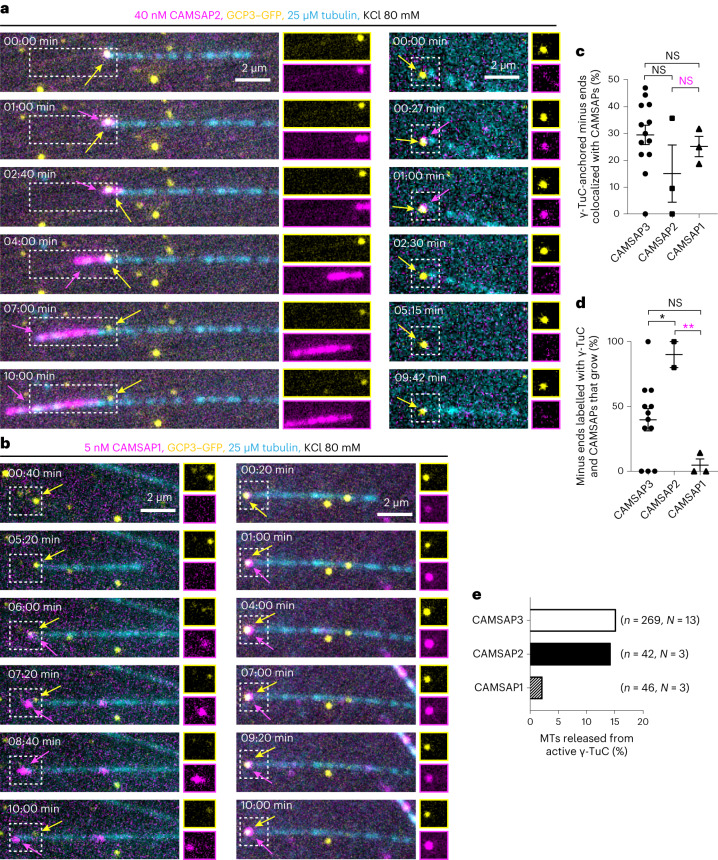
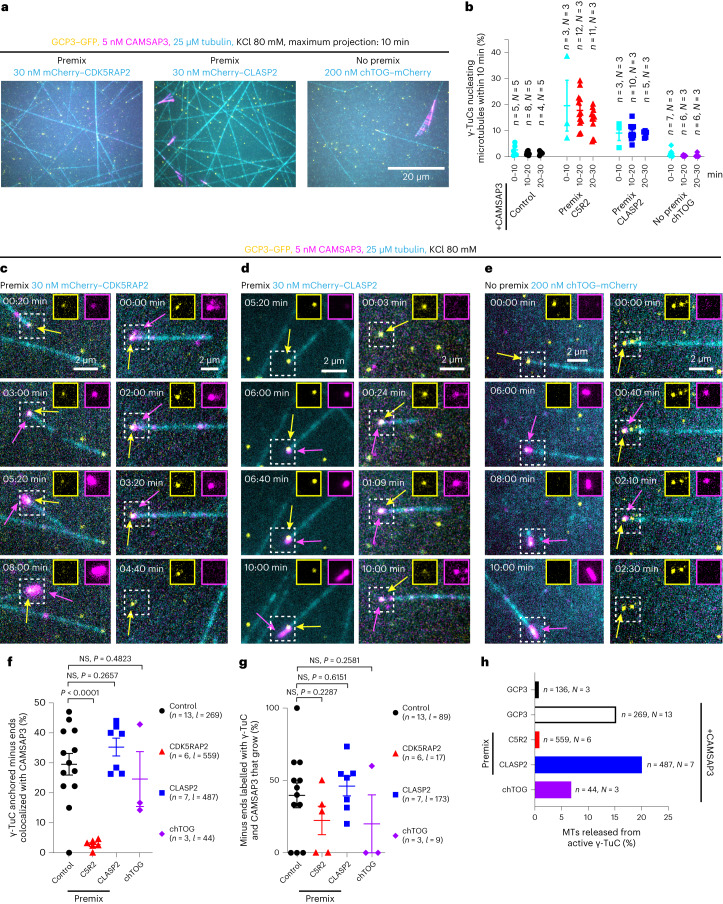
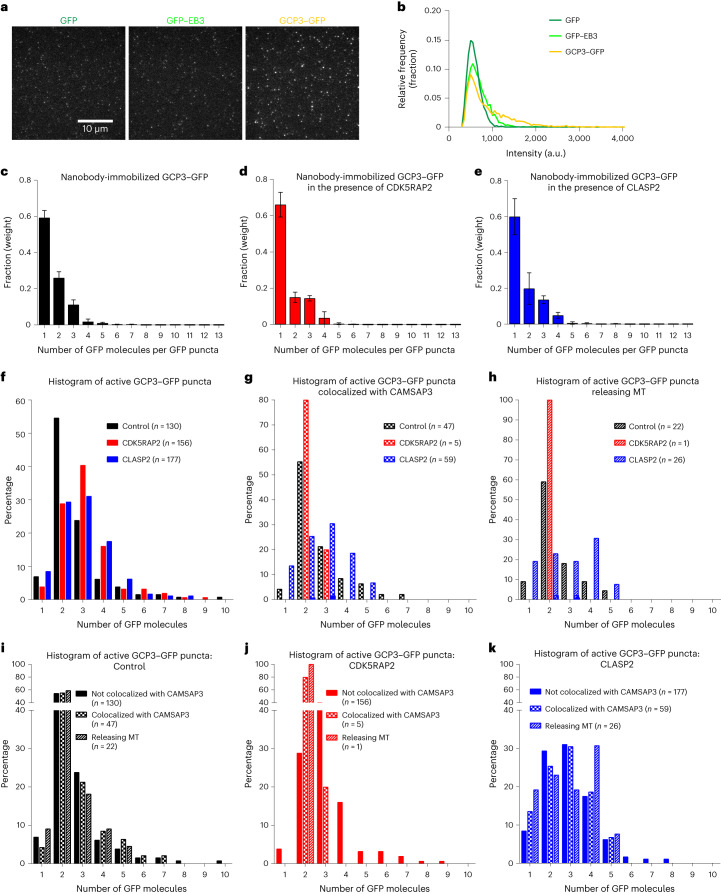
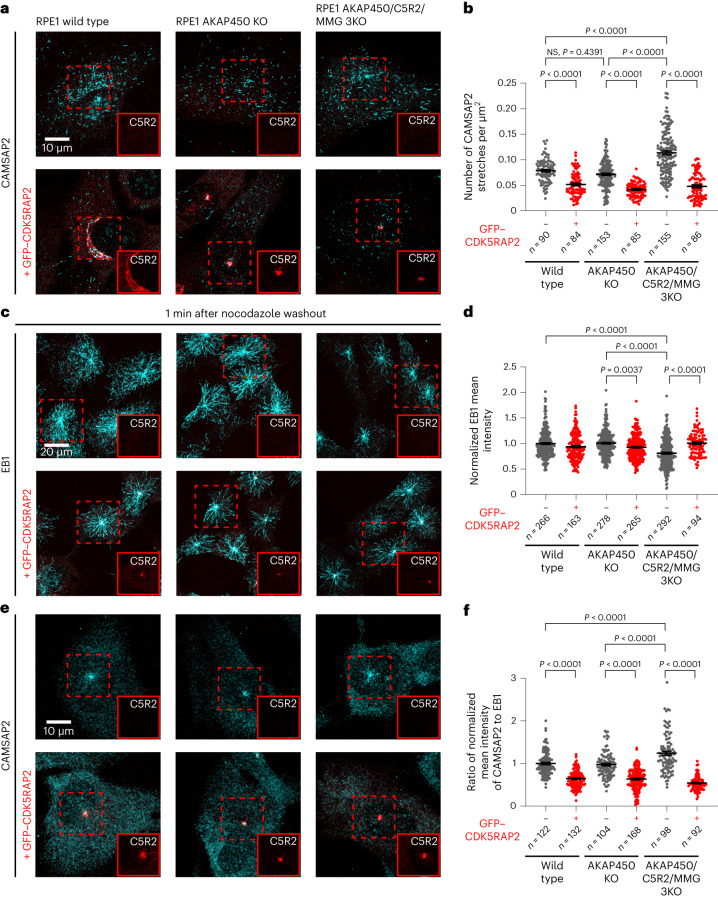
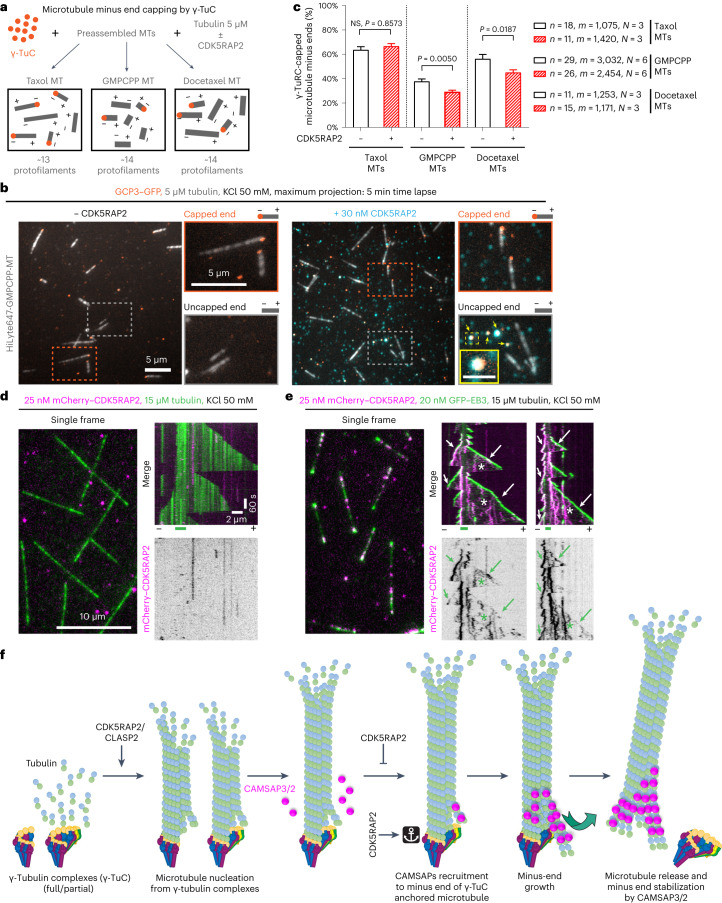
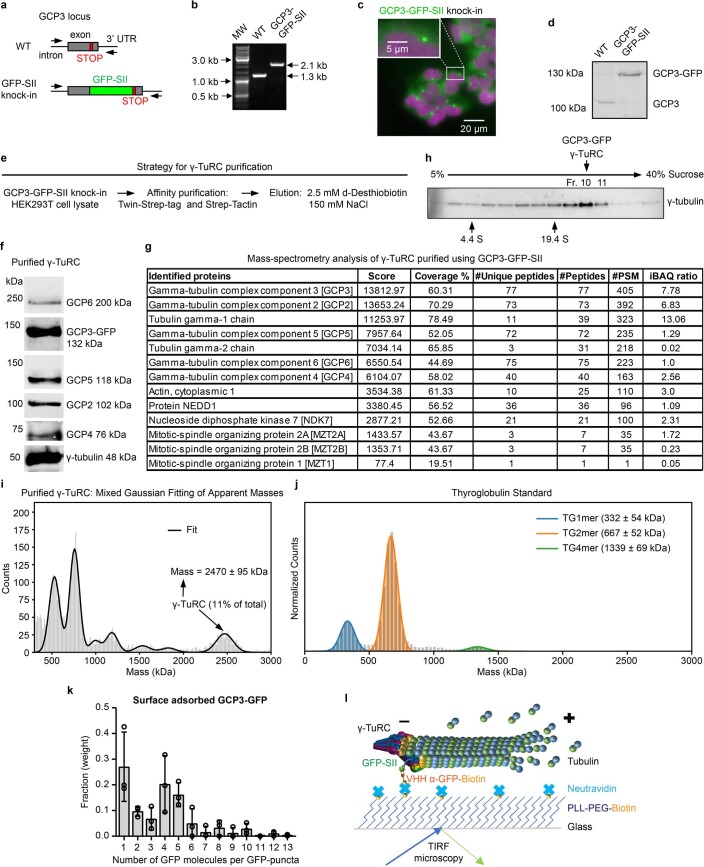
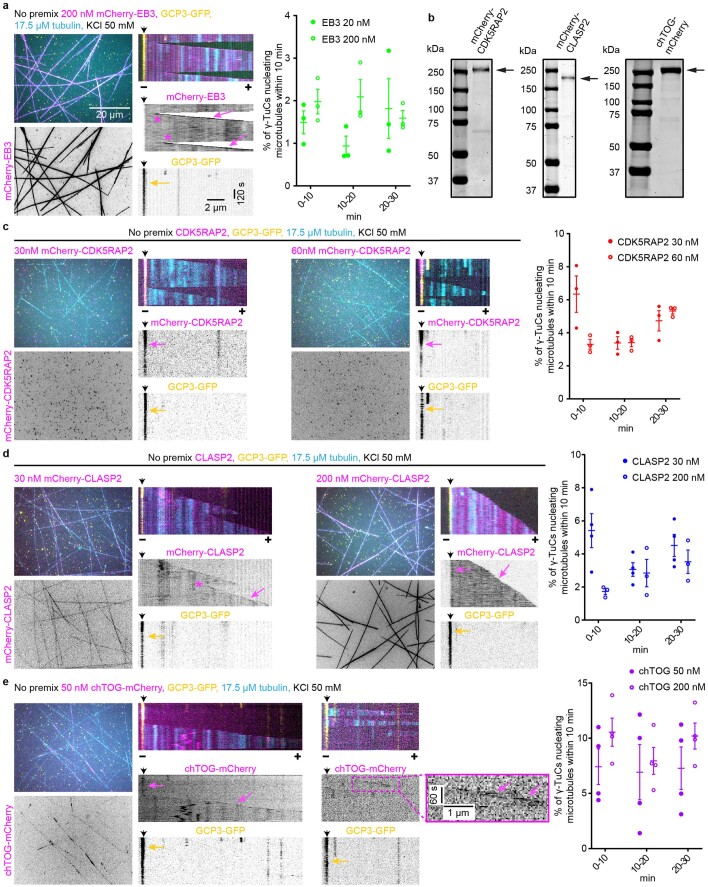
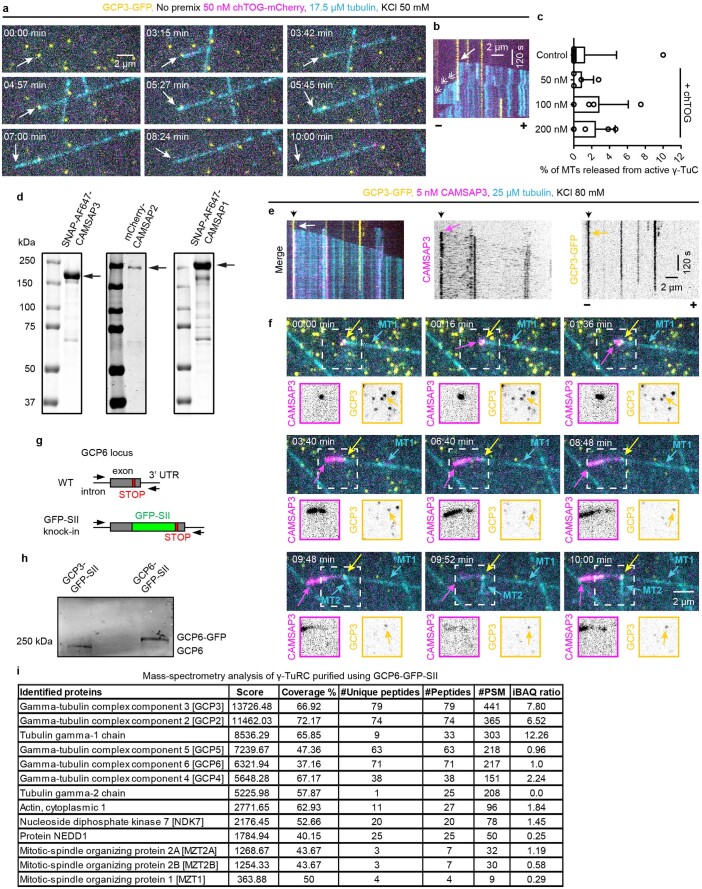
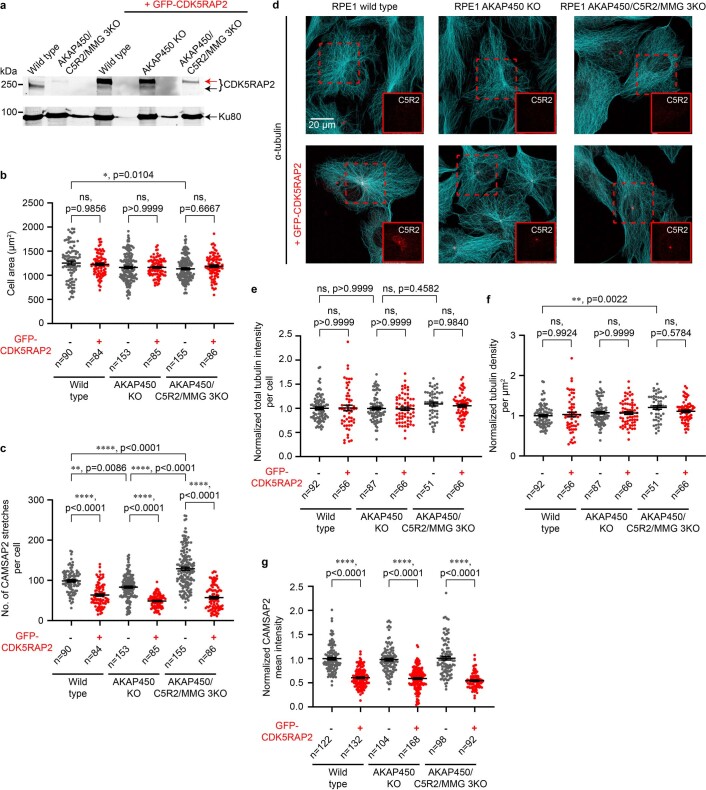
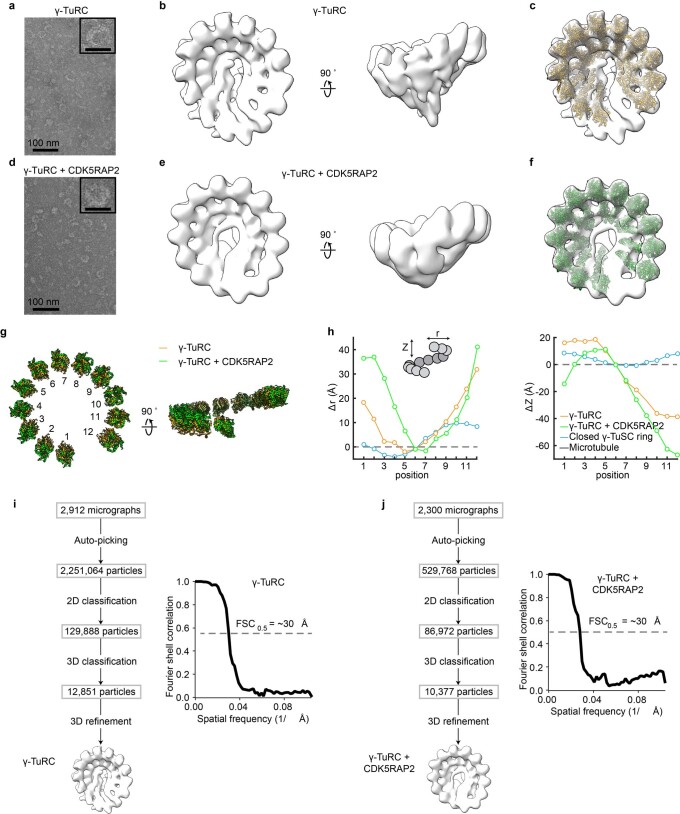
γ-Tubulin ring complex (γ-TuRC) is the major microtubule-nucleating factor. After nucleation, microtubules can be released from γ-TuRC and stabilized by other proteins, such as CAMSAPs, but the biochemical cross-talk between minus-end regulation pathways is poorly understood. Here we reconstituted this process in vitro using purified components. We found that all CAMSAPs could bind to the minus ends of γ-TuRC-attached microtubules. CAMSAP2 and CAMSAP3, which decorate and stabilize growing minus ends but not the minus-end tracking protein CAMSAP1, induced microtubule release from γ-TuRC. CDK5RAP2, a γ-TuRC-interactor, and CLASP2, a regulator of microtubule growth, strongly stimulated γ-TuRC-dependent microtubule nucleation, but only CDK5RAP2 suppressed CAMSAP binding to γ-TuRC-anchored minus ends and their release. CDK5RAP2 also improved selectivity of γ-tubulin-containing complexes for 13- rather than 14-protofilament microtubules in microtubule-capping assays. Knockout and overexpression experiments in cells showed that CDK5RAP2 inhibits the formation of CAMSAP2-bound microtubules detached from the microtubule-organizing centre. We conclude that CAMSAPs can release newly nucleated microtubules from γ-TuRC, whereas nucleation-promoting factors can differentially regulate this process.


Conflict of interest statement

The authors declare no competing financial and non-financial interests.

Figures

Fig. 1
Fig. 1. Human CDK5RAP2, CLASP2 and chTOG promote microtubule nucleation by purified γ-TuCs.
a, Left: representative images of single molecules of indicated purified proteins absorbed on coverslips. Middle: a histogram of single-molecule fluorescence intensities. The numbers of analysed molecules are as follows: n = 21,349 (GFP), n = 28,776 (GFP–EB3) and n = 24,216 (GCP3–GFP), from three independent experiments. Right: the probability density of GCP3–GFP intensities (yellow) fitted to a weighted sum of N-mers of GFP (dashed line) (a representative experiment). Weighted probability densities of individual GFP N-mer intensities (×1, ×2, …) are plotted beneath. See also Extended Data Fig. 1k. b, A 3D reconstruction of γ-TuRC (12,851 particles) from negative-stain EM data and rigid body fit of repeating γ-tubulin/GCP2 subcomplexes (from PDB ID: 6V6S (ref. )) individually docked into the γ-TuRC density map. Fits for two subcomplexes at the γ-TuRC ‘seam’ were not reliable and are therefore omitted (Extended Data Fig. 5i). c,eh, Left: maximum intensity projections of 10 min videos acquired after 20 min of incubation, showing microtubules (cyan) nucleated from γ-TuC (yellow) in the presence of either tubulin alone (c) or together with mCherry–EB3 (e) or mCherry–CDK5RAP2 (f) or mCherry–CLASP2 (g) or chTOG–mCherry (h) in the indicated conditions. In f and g, γ-TuC was also pre-incubated with indicated proteins (‘Premix’); experiments without pre-incubation are labelled as ‘No premix’. The arrowheads in insets indicate colocalizing particles. Right: representative kymographs and schemes illustrating microtubule dynamics and re-nucleation events (thin white arrows). Minus and plus indicate the two microtubule ends. The black arrowheads on top of kymographs indicate γ-TuC position and yellow and magenta arrows indicate γ-TuC and other proteins. The magnification is the same in c and eh. d, Efficiency (mean ± s.e.m.) of microtubule nucleation by γ-TuC in the presence of either tubulin alone (n = 3) or together with mCherry–EB3 (n = 3), mCherry–CDK5RAP2 (n = 3), mCherry–CDK5RAP2 pre-incubated with γ-TuC (n = 3), mCherry–CLASP2 (n = 4), mCherry–CLASP2 pre-incubated with γ-TuC (n= 3), chTOG–mCherry (n = 4) or chTOG–mCherry pre-incubated with γ-TuC (n = 3), where n is the number of independent experiments. ND, could not be determined. Representative images are shown on the left of c and eh and Extended Data Fig. 2c,d. Data points represent single fields of view for the given time point per experiment. Data points in cyan (0–10 min) were acquired from a smaller field of view; data points at 10–20 min and 20–30 min were acquired from a larger field of view shown in c and eh. Source data
Fig. 2
Fig. 2. Colocalization between γ-TuCs and NPFs and their effects on microtubule dynamics.
a,b, Plus-end growth rate (a) and catastrophe frequency (b) of microtubules grown in indicated conditions, shown in Fig. 1c,e,h and Extended Data Fig. 2c,d with representative kymographs on the right. The numbers of the growth events analysed, n, from three independent experiments, are indicated. One-way analysis of variance (ANOVA) tests with Dunnett’s multiple comparisons corrected for multiple testing. c, Representative still images showing colocalization of the indicated premixed proteins. The enlargements show separate channels for γ-TuC/control (top) and NPFs (bottom). The arrows indicate colocalizing particles. d,e, Colocalization (mean ± s.e.m) of γ-TuC with indicated NPFs (d) and vice versa (e) under experimental conditions shown in c and in Fig. 1c,e–h and Extended Data Fig. 2c,d. Data points represent the percentage of γ-TuCs colocalizing with the indicated protein or vice versa in n fields of view, in N independent experiments. The plots show data for γ-TuC premixed with mCherry without tubulin (n = 63, N = 3), γ-TuC with mCherry–CDK5RAP2 and tubulin (n = 9, N = 3), γ-TuC premixed with mCherry–CDK5RAP2 with (n = 9, N = 3) and without tubulin (n = 47, N = 3), γ-TuC with mCherry–CLASP2 and tubulin (n = 4, N = 4), γ-TuC premixed with mCherry–CLASP2 with (n = 3, N = 3) and without tubulin (n = 48, N = 3), γ-TuC with chTOG–mCherry and tubulin (n = 12, N = 4), γ-TuC premixed with chTOG–mCherry with (n = 9, N = 3) and without tubulin (n = 51, N = 3), GFP control premixed with mCherry without tubulin (n = 80, N = 4), GFP control premixed with mCherry–CDK5RAP2 without tubulin (n = 60, N = 3), GFP control premixed with mCherry–CLASP2 without tubulin (n = 60, N = 3) and GFP control premixed with chTOG–mCherry without tubulin (n = 59, N = 3). **P = 0.0068, ***P = 0.0003 and ****P < 0.0001, one-way ANOVA test with Tukey’s multiple comparisons corrected for multiple testing. f, Microtubule (MT) re-nucleation efficiency (mean ± s.e.m) from experiments shown in Fig. 1c,e–h. Data points represent percentage of γ-TuCs re-nucleating microtubules in a single experiment. n, the number of independent experiments analysed and m, the number of γ-TuCs which nucleated microtubules that underwent depolymerization, pooled from all three 10 min videos of all experiments. Not significant (NS) P = 0.0704, ***P = 0.0007 and ****P < 0.0001, one-way ANOVA test with Tukey’s multiple comparisons corrected for multiple testing. ND, could not be determined. Source data
Fig. 3
Fig. 3. CAMSAP3 triggers microtubule release from γ-TuC.
a,c, Maximum intensity projections (a) and single frame (top, arrow indicates γ-TuC-anchored microtubule) and representative kymograph (bottom) (c) of videos acquired after 20 min of incubation in indicated conditions. In all kymographs, the black arrowheads on top indicate the γ-TuC position and minus and plus indicate the two microtubule ends. b, The efficiency (mean ± s.e.m.) of microtubule nucleation by γ-TuC in the absence or presence of SNAP–AF647–CAMSAP3. n, the numbers of fields of view from N independent experiments. Data points in cyan were acquired from a smaller field of view and the data points in black are from a larger field of view shown in a. d, The frequency of microtubule (MT) release from active γ-TuCs in the absence or presence of SNAP–AF647–CAMSAP3. n, the numbers of active γ-TuCs from N independent experiments. Representative images are shown in c, e, f and l. eg,l,m, Microtubule nucleation and release from γ-TuC in 10 min videos obtained in indicated conditions. Single frame and cropped images (e). Still frames and kymographs (f,g,l,m) (schematic representation in g). The insets in f (scale bar, 1 μm) show CAMSAP3 signal over time. In g, the magenta arrowheads and enlarged views of the kymograph demonstrate the diffusion (double-sided wavy red arrow) of the released minus end. In e and l, separate channels for γ-TuC and CAMSAP3 are shown on the right and the magnification is the same as in merged images. In e, f and l, 0:00 min is the starting point of the video. The yellow arrows indicate γ-TuC and magenta arrows indicate CAMSAP3. h, The percentage (mean ± s.e.m) of γ-TuC-anchored minus ends colocalizing with CAMSAP3, from experiments shown in e and l. i, The percentage (mean ± s.e.m) of microtubules released from γ-TuC colocalizing with CAMSAP3, shown in h. n, the number of independent experiments and l, the total number of active γ-TuCs in h and the number of active γ-TuCs colocalizing with CAMSAP3 in i, analysed over 10 min. Two-tailed unpaired t-tests. j, Distribution of time intervals between CAMSAP3 binding and the onset of minus-end elongation. Fourteen γ-TuC dissociation events were pooled from three independent experiments. k, Fluorescence intensities (mean ± s.e.m) of all active GCP3–GFP molecules engaged in the indicated events, from experiments represented in e, pooled from four independent experiments. One-way ANOVA test with Tukey’s multiple comparisons. Source data
Fig. 4
Fig. 4. CAMSAPs cause γ-TuRC detachment by decorating growing microtubule minus ends.
a,b, Still frames (with 0:00 min being the starting point of the video) from a 10 min video showing two different examples of γ-TuC interplay with CAMSAP2 (a) or CAMSAP1 (b) in the indicated conditions. Next to the merged images, individual channels (magnification is the same as merged images) for γ-TuC (top, yellow) and CAMSAPs (bottom, magenta) are shown for the ROIs marked with white rectangles. Left: microtubule (cyan) release and right: occasions when CAMSAP2 (a) or CAMSAP1 (b) do not displace γ-TuC from microtubule minus ends. The yellow arrows indicate γ-TuC, while the magenta arrows indicate CAMSAPs. c, Colocalization frequency (mean ± s.e.m.) of γ-TuC-anchored microtubule minus ends with CAMSAPs, from experiments shown in a and b. The data points represent single experiments from which the percentage of growing microtubule minus ends that were labelled with γ-TuC and CAMSAPs were quantified. n = 3 and l = 42, NS P = 0.1068 for CAMSAP2 and n = 3 and l = 46, NS P = 0.6149 and NS P = 0.3622 (magenta) for CAMSAP1. d, The percentage (mean ± s.e.m.) of microtubules released from γ-TuCs colocalizing with CAMSAPs, as shown in a and b. n = 3 and l = 7, *P = 0.0277 for CAMSAP2 and n = 3 and l = 12, NS P = 0.0629 and **P = 0.0037 (magenta) for CAMSAP1. Control data (CAMSAP3 values) are from Fig. 3h (n = 13, l = 269) for c and from Fig. 3i (n = 13, l = 89) for d (GCP3 values), replotted here for comparison. n, the number of independent experiments and l, the total number of active γ-TuCs in c and the number of active γ-TuCs colocalizing with CAMSAPs in d, analysed over 10 min duration. One-way ANOVA with uncorrected Fisher’s least significant difference (LSD) tests were used to compare the means with each other. e, The frequency of microtubule (MT) release from active γ-TuC in the presence of CAMSAPs under the experimental conditions shown in a and b. Data for CAMSAP3 are from Fig. 3d (GCP3 values with CAMSAP3), replotted here for comparison. The numbers of active γ-TuCs analysed, n, pooled from N independent experiments, are indicated. Source data
Fig. 5
Fig. 5. CDK5RAP2, but not CLASP2 inhibits CAMSAP3 binding to the minus ends of γ-TuRC-anchored microtubules and their release.
a, Maximum intensity projections of 10 min time-lapse videos, acquired after 20 min of incubation, showing microtubules nucleated from γ-TuC in the indicated conditions. b, The average microtubule nucleation efficiency (mean ± s.e.m.) from experiments shown in a. The numbers of fields of view analysed, n, from N independent experiments are indicated. Control data are from Fig. 3b, replotted here for comparison, colours of the data points are the same as in Fig. 3b. ce, Still frames from 10 min videos (0:00 min is the starting point of the video) showing CAMSAP3 binding to the γ-TuC-anchored microtubule minus ends under the indicated experimental conditions. Left: microtubule release from γ-TuC (yellow arrows) colocalizing with CAMSAP3 (magenta arrows). Right: CAMSAP3 binding without microtubule release. The insets show cropped individual channels for γ-TuC (left) and CAMSAP3 (right), magnification is the same as merged images. Left: microtubule release from incomplete γ-TuRC (dim GFP signal) (c). Left: γ-TuC dissociation from minus end and also from glass surface within 6 min, followed by rescue at the microtubule plus end from CAMSAP3-stabilized stretch (e). f, The percentage (mean ± s.e.m) of γ-TuC-anchored microtubule minus ends colocalizing with CAMSAP3, from experiments represented in a and ce. g, The percentage (mean ± s.e.m) of microtubules released from the γ-TuC colocalizing with CAMSAP3, shown in f. n, the number of independent experiments (plotted) and l, the total number of active γ-TuCs in f and the number of active γ-TuCs colocalized with CAMSAP3 in g, analysed over 10 min duration. Control data are from Fig. 3h for f and from Fig. 3i for g (GCP3 values), replotted here for comparison. One-way ANOVA with uncorrected Fisher’s LSD tests were used to compare the means with control. In b and fh, control is black, CDK5RAP2 is red, CLASP2 is blue and chTOG is purple. h, The frequency of microtubule (MT) release from active γ-TuC in the presence of SNAP–AF647–CAMSAP3 under the experimental conditions shown in a and ce. n, the numbers of active γ-TuCs analysed from N independent experiments. Data for GCP3 with or without CAMSAP3 are from Fig. 3d, replotted here for comparison. CDK5RAP2 is abbreviated as C5R2 in the plots. Source data
Fig. 6
Fig. 6. Quantification of the number of GCP3–GFP molecules in the nucleation assays with γ-TuCs in the absence or presence of NPFs.
a, Representative images of single molecules of the indicated purified proteins (GFP in dark green, GFP–EB3 in light green and GCP3–GFP in yellow) immobilized on coverslips with anti-GFP nanobody. b, Histograms of single-molecule fluorescence intensities shown for one experiment represented in a. n = 12,841 for GFP, n = 21,670 for GFP–EB3 and n = 16,420 for GCP3–GFP, where n is the number of molecules analysed. a and b are representative of six independent experiments that yielded similar results. ce, Averaged histogram of weights of N-mers of GFP determined from the fitting to the intensities of GCP3–GFP puncta (fitting similar to shown in Fig. 1a, right), showing the numbers of GFP molecules per GCP3–GFP puncta in control (black) (c) or in the presence of either mCherry–CDK5RAP2 (red) pre-incubated with γ-TuC (d) or mCherry–CLASP2 (blue) pre-incubated with γ-TuC (e). Tubulin and SNAP–AF647–CAMSAP3 in the experimental conditions identical to Fig. 5a. For control, N = 6, n = 12,841 for GFP and n = 16,420 for GCP3–GFP; for premix CDK5RAP2, N = 3, n = 6,286 for GFP and n = 14,768 for GCP3–GFP; for premix CLASP2, N = 4, n = 8,530 for GFP and n = 17,023 for GCP3–GFP, where N is the number of independent experiments and n is the number of molecules analysed. The plots present mean ± s.d. fh, Histograms of the number of GFP molecules per GCP3–GFP puncta that were active (nucleating microtubules (MTs)) (f), active and colocalizing with CAMSAP3 (g) or active and releasing microtubules upon CAMSAP3 binding to the minus end (h), determined from the plots and experiments shown in ce. ik, Histograms of the number of GFP molecules per GCP3–GFP puncta that were active (nucleating microtubules), colocalizing with CAMSAP3 and releasing microtubules in control (i), premix CDK5RAP2 (j) and premix CLASP2 (k). Values are replotted here from fh. The colour code in plots ck: control, black; CDK5RAP2, red and CLASP2, blue. Source data
Fig. 7
Fig. 7. CDK5RAP2 regulates the abundance of CAMSAP2-bound microtubules in cells.
a,c,e, Representative immunofluorescence images of the indicated RPE1 cell lines with or without stable overexpression of GFP–CDK5RAP2 and stained for CAMSAP2 or EB1, as indicated in untreated cells (a) and 1 min after nocodazole washout (c and e). The insets show cropped GFP–CDK5RAP2 channel in red, magnification is the same as merged images. Cells with clearly visible GFP signal at the centrosome (or the centrosome and the Golgi in the wild-type cells) were selected for the analysis in all three cell lines. b, The number of CAMSAP2 stretches per square micron area (mean ± s.e.m.) quantified from experiments represented in a and using values from Extended Data Fig. 4b,c. d, EB1 mean intensity (mean ± s.e.m.) normalized to wild-type average quantified from experiments represented in c. f, The intensity ratio (mean ± s.e.m.) of CAMSAP2 over EB1 normalized to wild-type average quantified from experiments represented in e and using values from panel d and Extended Data Fig. 4g. In all plots, the numbers of cells analysed per genotype, n, from three independent experiments are indicated, and one-way ANOVA test with Tukey’s multiple comparisons corrected for multiple testing was used. C5R2, CDK5RAP2; KO, knockout. Source data
Fig. 8
Fig. 8. Effects of CDK5RAP2 on microtubule capping and dynamics and a model of CAMSAP-driven γ-TuRC detachment.
a, A scheme of the γ-TuRC capping assays. b, Maximum intensity projections of 5 min videos showing γ-TuC capping of GMPCPP-stabilized microtubules (MTs), in the presence of tubulin with (right) or without (left) mCherry–CDK5RAP2. The enlarged views show capped (top) and uncapped minus ends (bottom), distinguished from the plus ends by the absence of growth or slow growth dynamics. The yellow arrowheads and inset (scale bar, 1 μm) at the right bottom shows colocalization of γ-TuC with CDK5RAP2. c, Minus-end capping efficiency (mean ± s.e.m.) of γ-TuC for stabilized microtubules with different protofilament numbers in absence or presence of mCherry–CDK5RAP2 from experiments represented in a and b. n, number of fields of view analysed (plotted) and m, number of microtubule minus ends analysed from N independent experiments, as indicated. NS, one-way ANOVA test with Šídák’s multiple comparisons corrected for multiple testing. d,e, Single frames and representative kymographs from 10 min videos, showing microtubules growing from GMPCPP-stabilized microtubule seeds (short green lines below kymographs) in the presence of either mCherry–CDK5RAP2 and tubulin only (d) or together with GFP–EB3 (e) in the indicated conditions. Fluorescent tubulin was substituted with unlabelled tubulin in the assays with GFP–EB3. The arrowheads show CDK5RAP2 binding to microtubule minus ends, arrows show binding to plus ends and asterisks show binding to microtubule lattice. Minus and plus represent the two microtubule ends. The magnification is the same in d and e. f, A model of microtubule NPFs, CDK5RAP2 and CLASP2, which can activate full and partial γ-TuRCs to nucleate a microtubule. The minus end of such microtubules may or may not be fully anchored to γ-TuC allowing some protofilaments that are not attached to the γ-tubulin subunits to attain a flared conformation permissive for CAMSAP binding. CAMSAP2 or 3 bind to the minus end of the γ-TuRC-capped microtubule at an intradimer site between two protofilaments, where they can promote minus-end polymerization, stabilize the growing minus end or alter lattice conformation. Elongating protofilaments at the minus end can generate a pushing force or can alter the conformation of the microtubule lattice,, causing detachment of neighbouring protofilaments from γ-TuRC and microtubule release. CDK5RAP2 inhibits microtubule release by suppressing CAMSAP binding, probably by modifying the γ-TuRC conformation and/or γ-TuRC–microtubule interface. Source data
Extended Data Fig. 1
Extended Data Fig. 1. Characterization of HEK293T GCP3-GFP-SII homozygous knock-in cell line and γ-TuRC purified using GCP3-GFP-SII.
a, Scheme showing GCP3 gene locus and knock-in strategy. b, 1% Agarose gel showing genomic DNA PCR products for wild-type HEK293T cells and GCP3-GFP-SII knock-in cells. MW, molecular weight DNA ladder; WT, wild-type. c, Wide-field fluorescent image of fixed HEK293T GCP3-GFP-SII homozygous knock-in cells showing GFP fluorescence (green). Nuclei (magenta) were stained with DAPI. d, Western blot for wild-type and GCP3-GFP-SII knock-in HEK293T cell lysate, blotted using mouse anti-GCP3 antibody. e, Strategy for γ-TuRC purification. f, Western blot results showing the presence of all core components in the γ-TuRC sample purified using GCP3-GFP-SII using antibodies against GCP6, GFP, GCP5, GCP2, GCP4 and γ-tubulin. g, Mass spectrometry results showing the presence of all core components and their relative stoichiometry (iBAQ ratio) in γ-TuRC sample purified using GCP3-GFP-SII. iBAQ intensity ratio is relative to the iBAQ intensity of GCP6. h, Immunoblotting analysis of the γ-TuRC purified using GCP3-GFP-SII after sucrose density gradient centrifugation. Fractions were resolved by SDS–PAGE and blotted using γ-tubulin antibody. The preparation shows the presence of both complete and incomplete γ-TuRCs. i, j, Histogram and mixed Gaussian fitting of masses of all the molecular species detected in mass photometry of γ-TuC purified using GCP3-GFP-SII (i) and Thyroglobulin standard (j) showing the abundance of full γ-TuRC (11% of detected species; mass = 2470±95 kDa) and incomplete γ-TuRCs and other contaminants of lower molecular mass. The plots are representative of five measurements for γ-TuC (i) and a single measurement for Thyroglobulin standard (j). k, Quantification of GCP3-GFP stoichiometry of purified γ-TuCs adsorbed on coverslip. Averaged histogram of weights of N-mers of GFP determined from the fitting to the GCP3-GFP puncta intensities (as shown in Fig. 1a, right) showing the number of GFP molecules per immobilized GCP3-GFP puncta. The plot presents mean±s.d. for three independent experiments represented in Fig. 1a. l, Scheme showing experimental TIRF microscopy setup for in vitro reconstitution of microtubule nucleation from γ-TuRC. Source data
Extended Data Fig. 2
Extended Data Fig. 2. Characterization of effective concentrations of nucleation-promoting factors.
a,c,d,e, Left: maximum intensity projections and representative kymographs illustrating microtubule dynamics in 10 min time-lapse videos, acquired after 20 min of incubation, showing microtubules (cyan) nucleated from γ-TuC (GCP3-GFP, yellow) in the presence of 17.5 μM tubulin (17 μM unlabeled porcine tubulin and 0.5 μM HiLyte647-tubulin), 50 mM KCl and together with indicated concentrations of indicated proteins (magenta) and without any preincubation: 200 nM mCherry-EB3 (a); or 30 nM and 60 nM mCherry-CDK5RAP2 (c); or 30 nM and 200 nM mCherry-CLASP2 (d); or 50 nM chTOG-mCherry (e). Minus and plus represent the two microtubule ends. Black arrowheads on top of kymographs indicate γ-TuC position. Magenta arrows point to the signal of proteins, while yellow arrows point towards γ-TuC. Asterisks show rescues. Magnification for c-e is same as in a. Right: Quantification of average microtubule nucleation efficiency of γ-TuC as indicated: 200 nM mCherry-EB3 (n = 3); 30 nM (n = 3) or 60 nM (n = 3) mCherry-CDK5RAP2; 30 nM (n = 4) or 200 nM mCherry-CLASP2 (n = 3); 50 nM (n = 4) or 200 nM chTOG-mCherry (n = 4); where n is the number of independent experiments analyzed, also see Fig. 1c–h. The plots present mean±s.e.m., and each data point represents a single field of view for the given time points per experiment. Data points at 0–10 min were acquired from a smaller field of view, whereas the data points at 10–20 min and 20–30 min acquired from a larger field of view (shown in the panels on the left). Data points for concentrations already shown in Fig. 1e, h are from Fig. 1d, replotted here for comparison. b, Purified mCherry-CDK5RAP2, mCherry-CLASP2 or chTOG-mCherry analyzed by Coomassie-stained SDS-PAGE. Source data
Extended Data Fig. 3
Extended Data Fig. 3. Characterization of purified CAMSAPs and GCP6-tagged γ-TuC and microtubule release from γ-TuC.
a,b, Still frames (at indicated time points in min, with 0:00 min being the starting point of the video) (a) and representative kymograph (b) from a 10 min time-lapse video showing microtubule (cyan) nucleation and subsequent microtubule release from γ-TuC (GCP3-GFP, yellow) in the indicated conditions. Thin arrows indicate microtubule minus end. Barbed arrowheads in the kymograph indicate the growth of minus end. c, Frequency of microtubule release from active γ-TuC over 10 min duration in the presence of either 17.5 μM tubulin alone (control, n = 52, N = 8); or together with 50 nM (n = 280, N = 4); 100 nM (n = 183, N = 4); or 200 nM mCherry-chTOG (n = 301, N = 4); where n is the number of active γ-TuCs analyzed from N independent experiments. Representative images are shown in a. d, Purified SNAP-AF647-CAMSAP3, mCherry-CAMSAP2 or SNAP-AF647-CAMSAP1 analyzed by Coomassie-stained SDS-PAGE. e,f, Two different examples of γ-TuC-CAMSAP3 interplay at the γ-TuC-anchored microtubule minus-ends under indicated experimental conditions, also shown in Fig. 3e, from a 10 min time-lapse video. Example 1 (kymographs, e) illustrates occasions when CAMSAP3 fails to displace γ-TuC from microtubule minus-end. Black arrowheads on top of the kymographs indicate γ-TuC position. Example 2 (still frames at indicated time points, with 0:00 min being the starting point of the video, f) illustrates microtubule re-nucleation (cyan arrows, MT2) from the same γ-TuC that released previously nucleated microtubule (cyan arrows, MT1) upon CAMSAP3 binding and minus-end growth. At the bottom, individual channels for γ-TuC (right) and CAMSAP3 (left) are shown. Yellow arrows indicate γ-TuC, while magenta arrows indicate CAMSAP3. In f, magnification in individual channels is the same as merged images. g, Scheme showing GCP6 gene locus and knock-in strategy. h, Western blot for GCP3-GFP-SII and GCP6-GFP-SII knock-in HEK293T cell lysate, blotted using mouse anti-GCP6 antibody. i, Mass spectrometry results showing the presence of all the core components and their relative stoichiometry (iBAQ ratio) in γ-TuC purified using GCP6-GFP-SII. iBAQ intensity ratio is relative to the iBAQ intensity of GCP6. Minus and plus represent the two microtubule ends. Source data
Extended Data Fig. 4
Extended Data Fig. 4. Effects of CDK5RAP2 overexpression on the abundance of microtubules and CAMSAP2-bound microtubule minus ends in cells.
a, Western blot of cell lysates from wild type, AKAP450/CDK5RAP2/MMG knockouts, and wild type, AKAP450 knockouts and AKAP450/CDK5RAP2/MMG knockouts stably expressing GFP-CDK5RAP2, blotted using rabbit anti-CDK5RAP2 antibody (top) and mouse anti-Ku80 antibody (bottom). Top: red arrow indicates overexpressed GFP-CDK5RAP2 and black arrow indicates endogenous CDK5RAP2. GFP-CDK5RAP2 cell lines in the wild-type and AKAP450 background were clonal, whereas GFP-CDK5RAP2 triple CDK5RAP2/Myomegalin/AKAP450 knockout cells were a mixed cell population with respect to the GFP-CDK5RAP2 transgene. In the clonal lines, GFP-CDK5RAP2 overexpression was estimated to be 6–8-fold to the respective endogenous levels. See also the Methods section. b, c, Area of cells in square microns (mean±s.e.m.) (b) and number of CAMSAP2 stretches per cell (mean±s.e.m.) (c) quantified from experiments represented in Fig. 7a. Number of cells analyzed, n, from three independent experiments in all conditions, are indicated. d, Representative immunofluorescence images of indicated cell lines with or without stable expression of GFP-CDK5RAP2 (red), stained for α-tubulin (cyan). Insets show cropped CDK5RAP2 channel in red, magnification is same as merged images. e,f, Total tubulin intensity per cell (mean±s.e.m.) normalized to wild-type average (e) and tubulin density per square micron area (mean±s.e.m.) normalized to wild-type average (f) quantified from experiments represented in d and Fig. 7a and using values in panels b and e. Number of cells analyzed, n, from three independent experiments in all conditions, are indicated. g, CAMSAP2 mean intensity per cell (mean±s.e.m.) normalized to wild-type average quantified from experiments represented in Fig. 7e. Number of cells analyzed, n, from three independent experiments in all conditions, are indicated. One-way ANOVA test with Tukey’s multiple comparisons corrected for multiple testing in b,c,e-g. ns, not significant. CDK5RAP2 is abbreviated as C5R2 in figure panels. Source data
Extended Data Fig. 5
Extended Data Fig. 5. Characterization of γ-TuRC by EM in the absence or presence of CDK5RAP2.
a, Transmission EM (TEM) micrograph of negatively stained γ-TuRC. Inset shows 4X magnified view of a single γ-TuRC, scale bar-25nm. b, Two views of a 3D reconstruction of the γ-TuRC from negative-stain EM data. c, Rigid body fit of repeating γ-tubulin/GCP2 subcomplexes (from PDB ID: 6V6S ref. ) individually docked into the γ-TuRC density map. Fits for two subcomplexes at the γ-TuRC ‘seam’ were not reliable; and are therefore, omitted for clarity. d, Transmission EM (TEM) micrograph of negatively stained γ-TuRC prepared in complex with 120 nM CDK5RAP2. Inset shows 4X magnified view of a single γ-TuRC, scale bar-25nm. e, Two views of a 3D reconstruction of the γ-TuRC + CDK5RAP2 preparation from negative-stain EM data. f, Rigid body fit of repeating γ-tubulin/GCP2 subcomplexes (from PDB ID: 6V6S ref. ) individually docked into the γ-TuRC + CDK5RAP2 density map. As in c, fits for two subcomplexes at the γ-TuRC ‘seam’ were not reliable; and are therefore, omitted for clarity. g, Two views of the γ-tubulin rings from rigid body fitted models in c (γ-TuRC) and f (γ-TuRC + CDK5RAP2). h, Plots of the change in helical radius (r) and helical pitch (Z) relative to β-tubulin in the 13-protofilament microtubule lattice (grey dashed line; PDB ID: 2HXF ref. and EMD-5193 ref. ) calculated for γ-tubulin rings from γ-TuRC alone (orange), γ-TuRC + 120 nM CDK5RAP2 (green), and the γ-TuSC oligomer in the ‘closed’ state (blue; PDB ID: 5FLZ ref. ). See Methods for analysis details. i, Left: Processing workflow for generating a negative-stain EM 3D reconstruction of γ-TuRC. Right: Unmasked FSC curve for the γ-TuRC reconstruction. FSC = 0.5 is indicated by a dashed gray line, and an estimate of the corresponding resolution is indicated. j, Left: Processing workflow for generating a negative-stain EM 3D reconstruction of γ-TuRC in the presence of 120 nM CDK5RAP2. Right: Unmasked FSC curve for the γ-TuRC + CDK5RAP2 reconstruction. FSC = 0.5 is indicated by a dashed gray line, and an estimate of the corresponding resolution is indicated. Source data

References

    1. Akhmanova A, Kapitein LC. Mechanisms of microtubule organization in differentiated animal cells. Nat. Rev. Mol. Cell Biol. 2022;23:541–558. doi: 10.1038/s41580-022-00473-y. - DOI - PubMed
    1. Sanchez AD, Feldman JL. Microtubule-organizing centers: from the centrosome to non-centrosomal sites. Curr. Opin. Cell Biol. 2017;44:93–101. doi: 10.1016/j.ceb.2016.09.003. - DOI - PMC - PubMed
    1. Muroyama A, Lechler T. Microtubule organization, dynamics and functions in differentiated cells. Development. 2017;144:3012–3021. doi: 10.1242/dev.153171. - DOI - PMC - PubMed
    1. Martin M, Akhmanova A. Coming. Trends Cell Biol. 2018;28:574–588. doi: 10.1016/j.tcb.2018.02.011. - DOI - PubMed
    1. Roostalu J, Surrey T. Microtubule nucleation: beyond the template. Nat. Rev. Mol. Cell Biol. 2017;18:702–710. doi: 10.1038/nrm.2017.75. - DOI - PubMed

Publication types

MeSH terms