. 2024 Apr;27(4):643-655.
doi: 10.1038/s41593-024-01589-4. Epub 2024 Feb 29.

PolyGR and polyPR knock-in mice reveal a conserved neuroprotective extracellular matrix signature in C9orf72 ALS/FTD neurons

Affiliations

PolyGR and polyPR knock-in mice reveal a conserved neuroprotective extracellular matrix signature in C9orf72 ALS/FTD neurons

Carmelo Milioto et al. Nat Neurosci. 2024 Apr.

Abstract

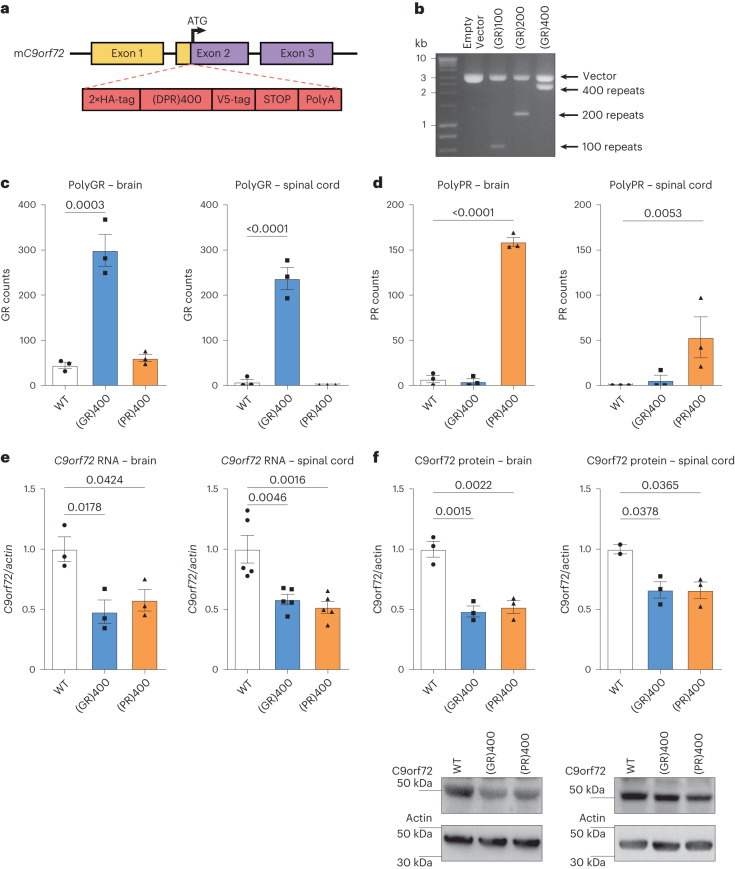
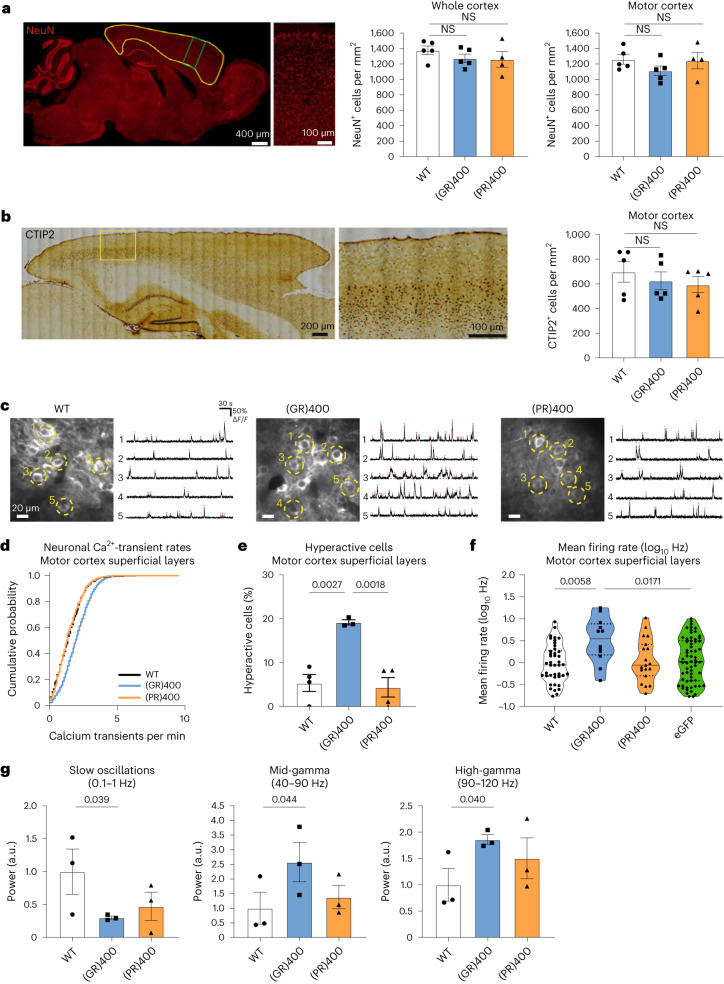
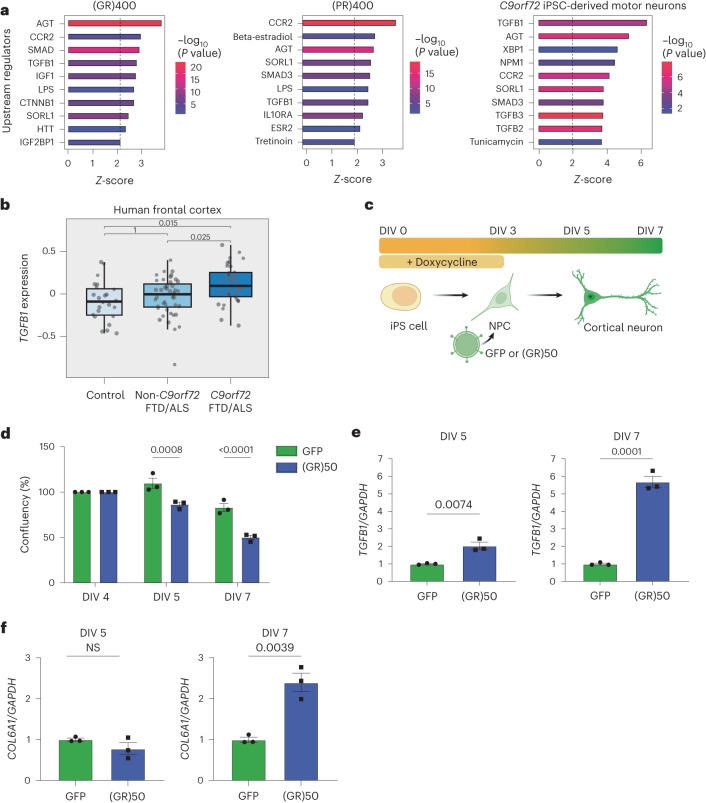
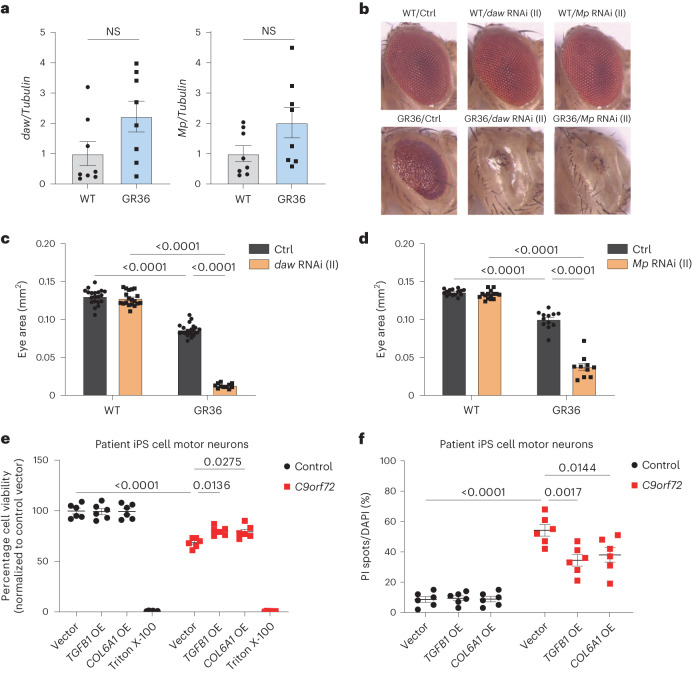
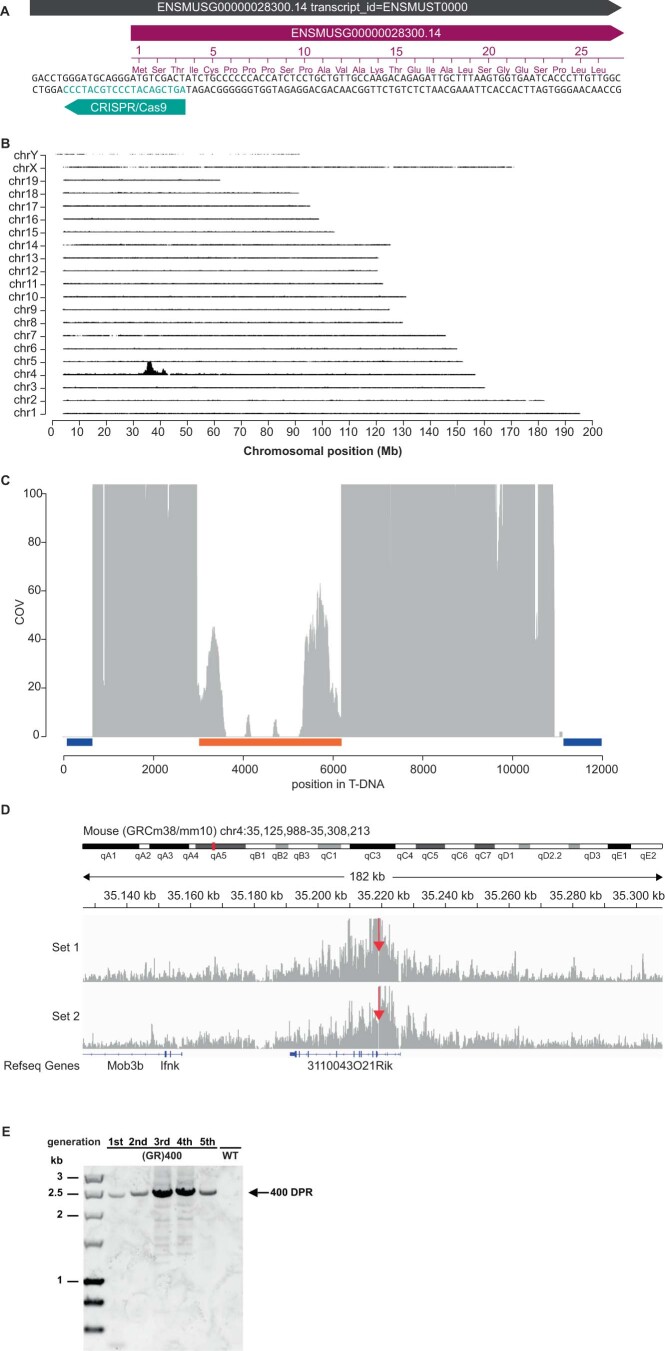
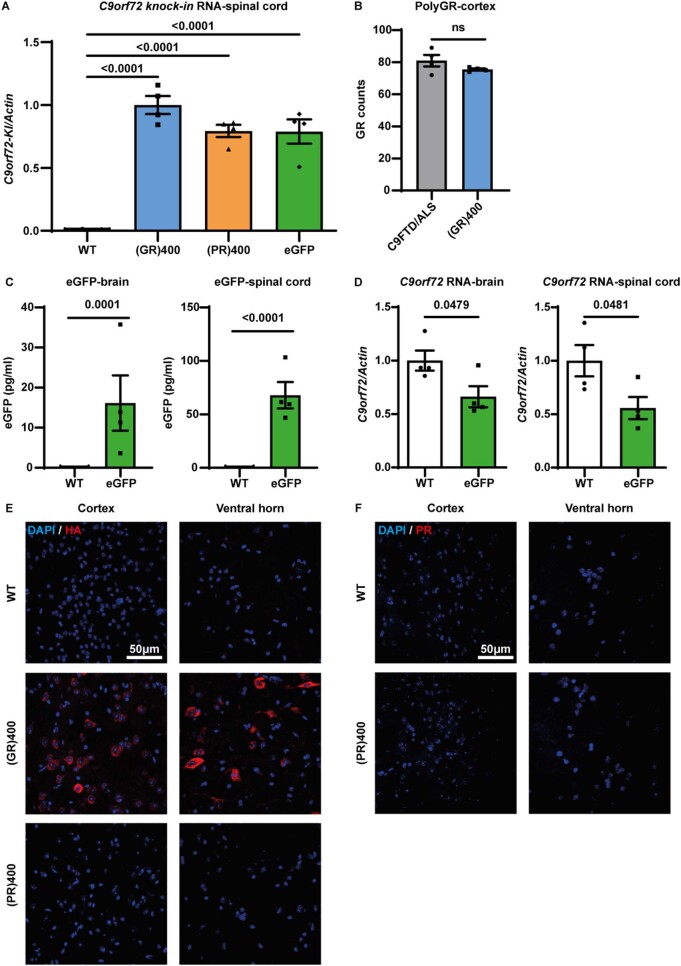
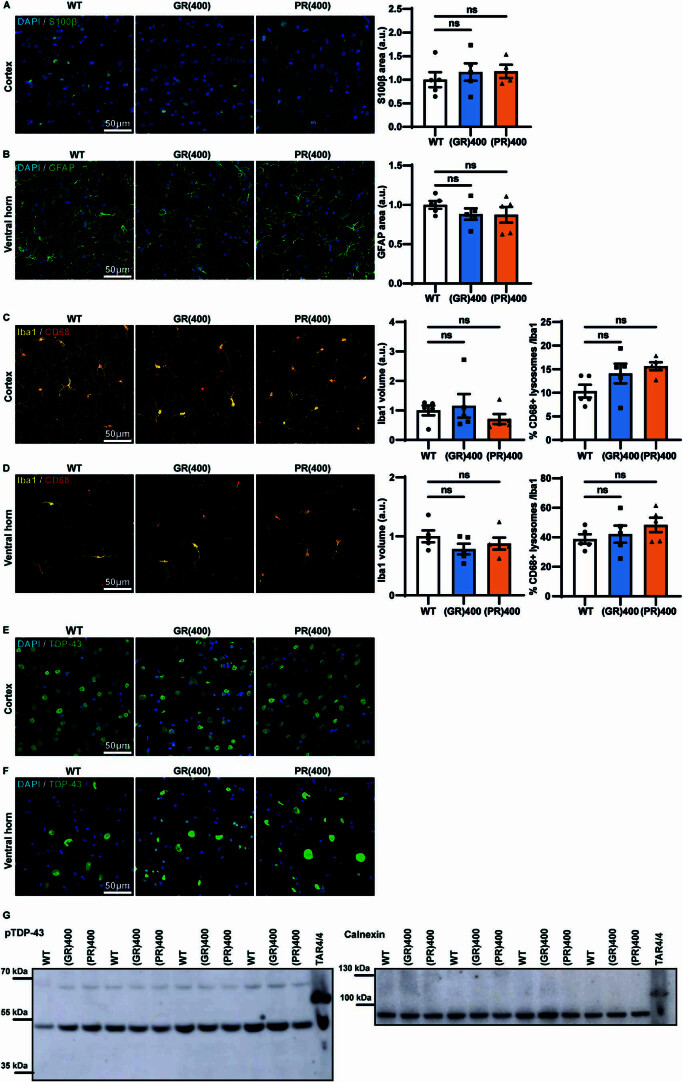
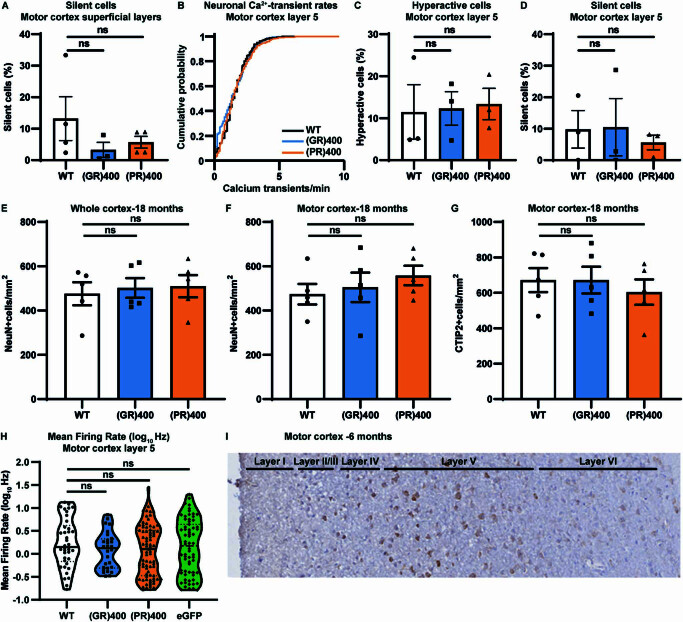
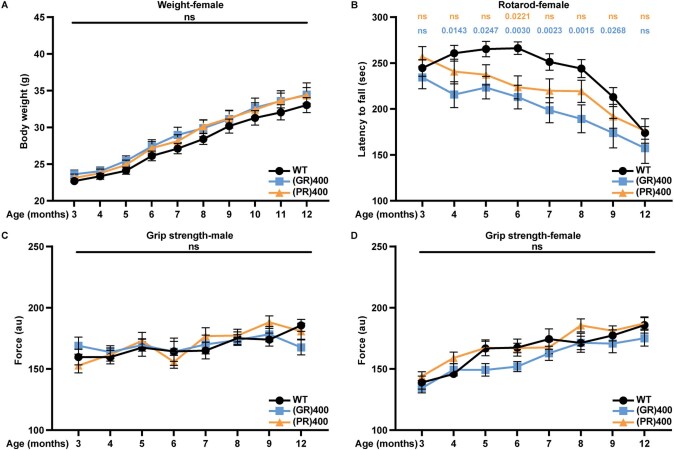
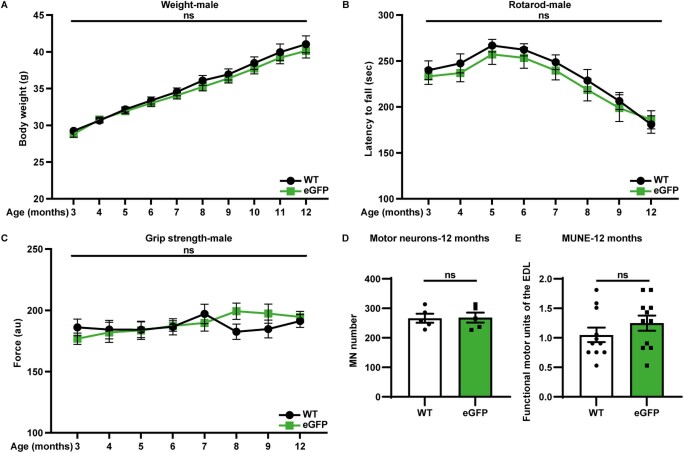
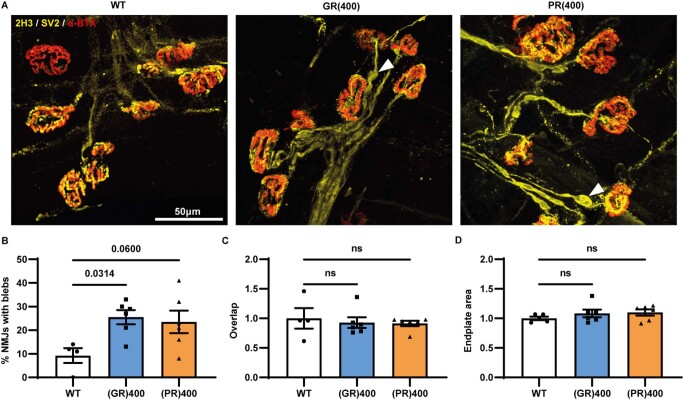
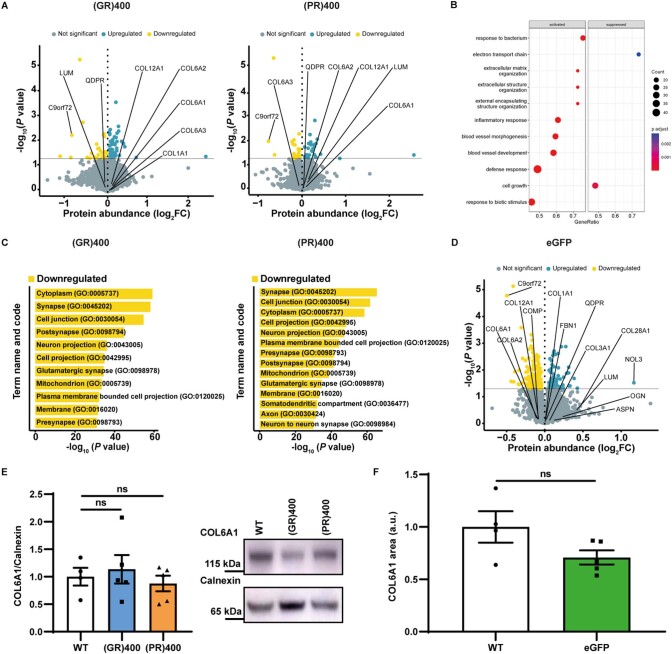
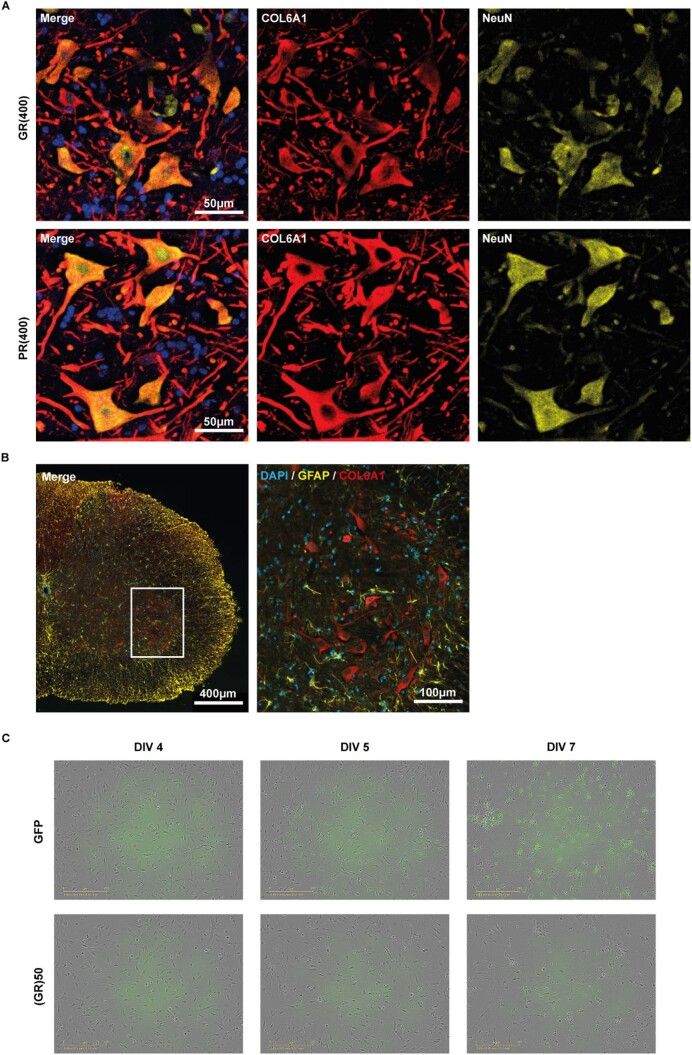
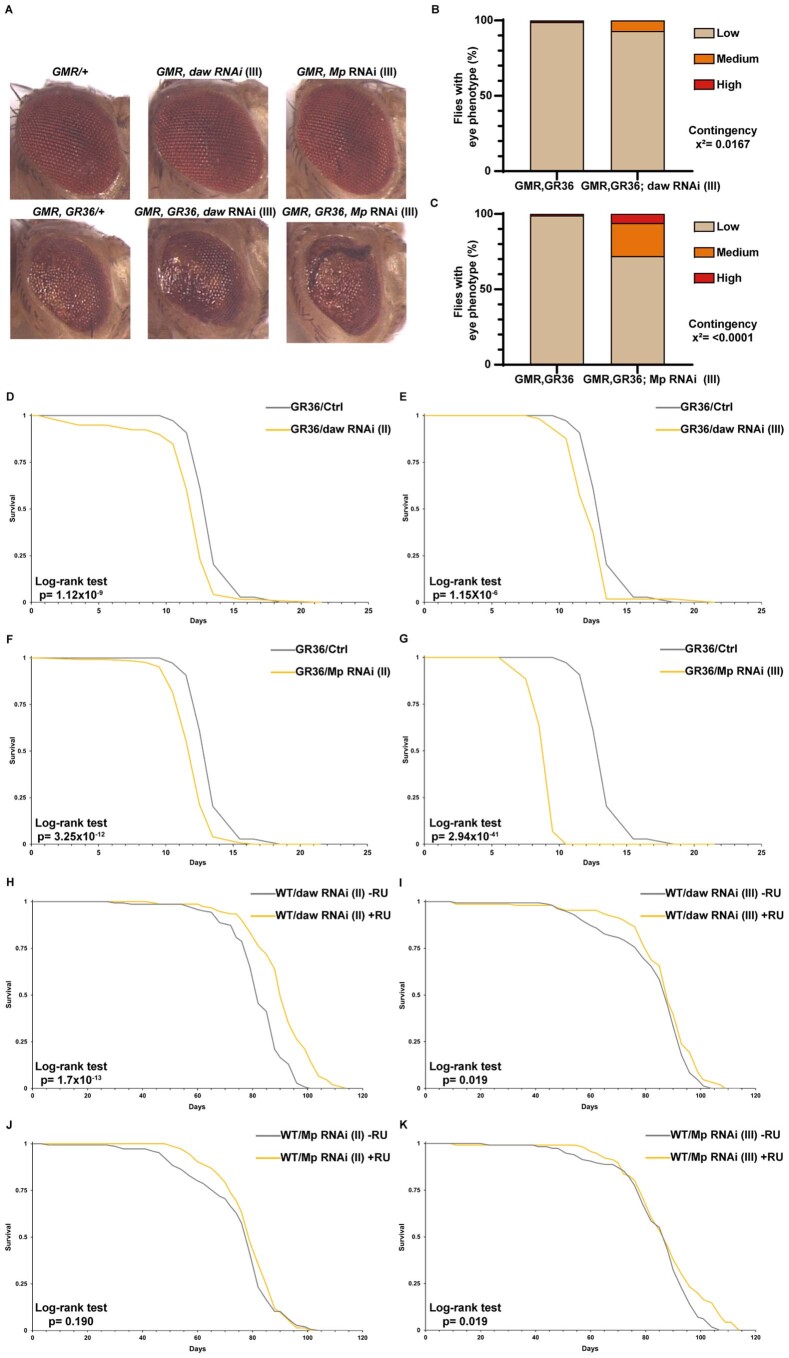
Dipeptide repeat proteins are a major pathogenic feature of C9orf72 amyotrophic lateral sclerosis (C9ALS)/frontotemporal dementia (FTD) pathology, but their physiological impact has yet to be fully determined. Here we generated C9orf72 dipeptide repeat knock-in mouse models characterized by expression of 400 codon-optimized polyGR or polyPR repeats, and heterozygous C9orf72 reduction. (GR)400 and (PR)400 knock-in mice recapitulate key features of C9ALS/FTD, including cortical neuronal hyperexcitability, age-dependent spinal motor neuron loss and progressive motor dysfunction. Quantitative proteomics revealed an increase in extracellular matrix (ECM) proteins in (GR)400 and (PR)400 spinal cord, with the collagen COL6A1 the most increased protein. TGF-β1 was one of the top predicted regulators of this ECM signature and polyGR expression in human induced pluripotent stem cell neurons was sufficient to induce TGF-β1 followed by COL6A1. Knockdown of TGF-β1 or COL6A1 orthologues in polyGR model Drosophila exacerbated neurodegeneration, while expression of TGF-β1 or COL6A1 in induced pluripotent stem cell-derived motor neurons of patients with C9ALS/FTD protected against glutamate-induced cell death. Altogether, our findings reveal a neuroprotective and conserved ECM signature in C9ALS/FTD.


Conflict of interest statement

The authors declare no competing interests.

Figures

Fig. 1
Fig. 1. Generation of C9orf72 polyGR and polyPR knock-in mice.
a, Targeting strategy to generate (GR)400 and (PR)400 mice with the knock-in sequence inserted in exon 2 of mouse C9orf72 immediately after, and in frame with, the endogenous ATG. Schematic shows the genomic region and the knock-in targeting construct. Exons are shown boxed; untranslated regions of exons are colored yellow with translated regions in purple. The targeting construct (in red) contains the knock-in sequence composed of a double HA-tag, 400 codon-optimized DPRs, a V5-tag, a stop codon and a 120-bp polyA tail. b, Agarose gel shows generation of patient-length polyGR, using recursive directional ligation to sequentially double the repeat length up to 400 repeats. Representative of at least n = 3 clones for each round of cloning. c, Quantification of polyGR proteins in brain (left panel) and spinal cord (right panel) of WT, (GR)400 and (PR)400 mice at 3 months of age by MSD immunoassay. Graph, mean ± s.e.m., n = 3 mice per genotype, one-way ANOVA, Bonferroni’s multiple comparison. d, Quantification of polyPR proteins in brain (left panel) and spinal cord (right panel) of WT, (GR)400 and (PR)400 mice at 3 months of age by MSD immunoassay. Graph, mean ± s.e.m., n = 3 mice per genotype, one-way ANOVA, Bonferroni’s multiple comparison. e, qPCR analysis of C9orf72 transcript levels normalized to β-actin in brain (left panel) and spinal cord (right panel) of WT, (GR)400 and (PR)400 mice at 3 months of age. Graph, mean ± s.e.m.; n = 3 (brain), 5 (spinal cord) mice per genotype; one-way ANOVA, Bonferroni’s multiple comparison. f, Western blotting analysis of C9orf72 protein levels in brain (left panel) and spinal cord (right panel) of WT, (GR)400 and (PR)400 mice at 3 months of age. β-actin is shown as loading control. Graph, mean ± s.e.m.; n = 3 mice per genotype (left panel), n = 2 WT, 3 (GR)400 and 3 (PR)400 (right panel); one-way ANOVA, Bonferroni’s multiple comparison. Source data
Fig. 2
Fig. 2. PolyGR is predominantly expressed in neurons.
a,b, Representative confocal images of immunofluorescence staining showing colocalization between neuronal marker NeuN (yellow) and HA-tag (red) in (GR)400 mouse brain cortex (a) and lumbar spinal cord ventral horn (b) at 6 months of age, n = 5 mice per genotype. c,d, Representative confocal images of immunofluorescence staining showing absence of colocalization between the astrocytic markers S100β (c) or GFAP (d) (yellow) and HA-tag (red) in (GR)400 mouse brain cortex (c) and lumbar spinal cord ventral horn (d) at 6 months of age, n = 5 mice per genotype. e,f, Representative confocal images of immunofluorescence staining showing absence of colocalization between the microglial marker Iba1 (yellow) and HA-tag (red) in (GR)400 mouse brain cortex (e) and lumbar spinal cord ventral horn (f) at 6 months of age. DAPI (blue) stains nuclei, n = 5 mice per genotype.
Fig. 3
Fig. 3. (GR)400 knock-in mice exhibit cortical hyperexcitability without neuronal loss.
a, Representative image of the cortex (area delineated in yellow), enhanced magnification of the motor cortex (area delineated in green), and quantification of NeuN-positive (red) cell density in the whole cortex and in motor cortex in WT, (GR)400 and (PR)400 mice at 12 months of age. Graph, mean ± s.e.m., n = 4–5 mice per genotype, one-way ANOVA, Bonferroni’s multiple comparison. NS denotes P > 0.05. b, Representative image of the cortex, enhanced magnification of the motor cortex (area delineated in yellow) and quantification of CTIP2-positive upper motor neuron density in layer V of the motor cortex in WT, (GR)400 and (PR)400 mice at 12 months of age. Graph, mean ± s.e.m., n = 5 mice per genotype, one-way ANOVA, Bonferroni’s multiple comparison. NS denotes P > 0.05. c, Example of in vivo two-photon fluorescence images of jRCamP1b-expressing superficial layer neurons in motor cortex and spontaneous Ca2+ activity from five example neurons in WT (left panel), GR(400) (center panel) and PR(400) (right panel) mice at 15–19 months of age. d, Cumulative distribution plot displaying neuronal Ca2+-transient rates across animals in motor cortex superficial layers of WT (732 cells, 4 mice), (GR)400 (1,405 cells, 3 mice) and (PR)400 (946 cells, 4 mice) mice at 15–19 months of age. e, Percentage of hyperactive (>3 Ca2+-transients per minute) neurons in motor cortex superficial layers of WT (n = 4 mice), (GR)400 (n = 3 mice) and (PR)400 (n = 4 mice) mice at 15–19 months of age. Graph, mean ± s.e.m., one-way ANOVA, Tukey’s multiple comparison. f, Mean firing rate (log10Hz) of neurons in motor cortex superficial layers of WT, (GR)400, (PR)400 and eGFP mice at 15–19 months of age; black lines indicate medians and dashed lines indicate quartiles. Graph, n = 3 mice per genotype, one-way ANOVA, Tukey’s multiple comparison. g, LFP power in the slow-wave frequency band (left panel), mid gamma-frequency band (center panel) and high gamma-frequency band (right panel) in WT, (GR)400 and (PR)400 mice at 15–19 months of age. Graph, mean ± s.e.m., n = 3 mice per genotype, one-tailed one-way ANOVA, Fisher’s least significant difference procedure following Levene test for equal variances and test for normality. Source data
Fig. 4
Fig. 4. (GR)400 and (PR)400 knock-in mice develop age-dependent lower motor neuron loss and progressive rotarod impairment.
a, Body weights of WT, (GR)400 and (PR)400 male mice up to 12 months of age. Graph, mean ± s.e.m., n = 14 mice per genotype, two-way ANOVA, Bonferroni’s multiple comparison. NS denotes P > 0.05. b, Accelerated rotarod analysis of motor coordination in WT, (GR)400 and (PR)400 male mice up to 12 months of age. Graph, mean ± s.e.m., n = 14 mice per genotype, two-way ANOVA, Bonferroni’s multiple comparison. NS denotes P > 0.05. c, Panel shows representative image of Nissl staining of lumbar spinal cord in WT mice; the dashed red line delineates the sciatic motor pool in which motor neurons were counted. n = 5 mice per genotype. d, Quantification of Nissl-stained motor neurons in lumbar spinal cord region L3–L5 in WT, (GR)400 and (PR)400 mice at 6 months of age. Graph, mean ± s.e.m., n = 5 mice per genotype, one-way ANOVA, Bonferroni’s multiple comparison. NS denotes P > 0.05. e, Quantification of Nissl-stained motor neurons in lumbar spinal cord region L3–L5 in WT, (GR)400 and (PR)400 mice at 12 months of age. Graph, mean ± s.e.m., n = 5 mice per genotype, one-way ANOVA, Bonferroni’s multiple comparison. f, Representative EDL MUNE traces from 12-month-old WT (left panel), (GR)400 (center panel) and (PR)400 (right panel) mice. Peaks correspond to physiological recruitment of motor units following electrical stimulation; n mice = 5 WT, 6 (GR)400 and 6 (PR)400; n muscles = 8 WT, 12 (GR)400 and 9 (PR)400. g, Quantification of MUNE determined in EDL muscle in WT, (GR)400 and (PR)400 mice at 12 months of age. Graph, mean ± s.e.m.; n mice = 5 WT, 6 (GR)400 and 6 (PR)400; n muscles = 8 WT, 12 (GR)400 and 9 (PR)400; one-way ANOVA, Bonferroni’s multiple comparison. MN, motor neuron. Source data
Fig. 5
Fig. 5. (GR)400 and (PR)400 knock-in mouse spinal cord has increased ECM protein levels.
a, GO term enrichment analysis from significantly upregulated (blue) proteins in the lumbar spinal cord of 12-month-old (GR)400 (left panel) or (PR)400 (center panel) mice and C9orf72 patient iPS cell-derived motor neurons (right panel). Proteomics performed on WT (n = 4 mice), (GR)400 (n = 5 mice), (PR)400 (n = 6 mice); two-sided Welch’s t-test with 5% FDR multiple-correction. b, Protein expression volcano plots from the lumbar spinal cord of 12-month-old (GR)400 (left panel) or (PR)400 (center panel) mice, and C9orf72 patient iPS cell-derived motor neurons (right panel). WT (n = 4 mice), (GR)400 (n = 5 mice), (PR)400 (n = 6 mice); two-sided Welch’s t-test with 5% FDR multiple-correction. c, Western blot of COL6A1 in lumbar spinal cord of WT, (GR)400 and (PR)400 mice at 12 months of age. Calnexin is shown as loading control. Graph, mean ± s.e.m.; WT (n = 4 mice), (GR)400 (n = 5 mice), (PR)400 (n = 5 mice); one-way ANOVA, Bonferroni’s multiple comparison. NS denotes P > 0.05. d, Representative confocal images and quantification of immunofluorescence staining of COL6A1 (red) and NeuN (yellow) in lumbar spinal cord in WT mice at 12 months of age. DAPI (blue) stains nuclei. Graph, mean ± s.e.m., n = 5 mice per genotype, one-way ANOVA, Bonferroni’s multiple comparison. FC, fold change. Source data
Fig. 6
Fig. 6. PolyGR induces TGFB1 followed by its target gene COL6A1 in i3Neurons.
a, The top ten IPA-predicted upstream regulators in (GR)400 spinal cord (left panel), (PR)400 spinal cord (center panel) and C9orf72 iPS cell-derived motor neurons (right panel). WT (n = 4 mice), (GR)400 (n = 5 mice), (PR)400 (n = 6 mice); two-sided Welch’s t-test with 5% FDR multiple-correction. b, Boxplot of residual gene expression for TGFB1. The boxplot midline represents the median, the box represents the interquartile range (25th and 75th percentiles) and the whiskers extend to the highest (upper whisker) or lowest (lower whisker) value, but no more than the interquartile range multiplied by 1.5. To determine differentially expressed genes, a linear regression model (two-sided) was used and P values were adjusted for multiple comparisons using the Benjamini–Hochberg FDR procedure. C9orf72 FTLD/MND n = 34, non-C9orf72 FTLD/MND n = 44, controls n = 24. c, Schematic workflow of i3Neuron doxycycline-induced differentiation at DIV 0 and transduction with lentiviruses expressing (GR)50, or GFP at DIV 3. d, Live-cell Incucyte confluency quantification in (GR)50, or GFP-treated i3Neurons. Graph, mean ± s.e.m., n = 3 independent biological replicates, two-way ANOVA, Bonferroni’s multiple comparison. e, qPCR analysis of TGFB1 transcript levels normalized to GAPDH at DIV 5 (left panel) and DIV 7 (right panel) in (GR)50, or GFP-treated i3Neurons. Graph, mean ± s.e.m., n = 3 independent biological replicates, one-way ANOVA, Bonferroni’s multiple comparison. f, qPCR analysis of COL6A1 transcript levels normalized to GAPDH at DIV 5 (left panel) and DIV 7 (right panel) in (GR)50, or GFP-treated i3Neurons. Graph, mean ± s.e.m., n = 3 independent biological replicates, one-way ANOVA, Bonferroni’s multiple comparison. NS denotes P > 0.05. FTLD, frontotemporal lobar degeneration. Source data
Fig. 7
Fig. 7. TGFB1 and COL6A1 are neuroprotective in C9ALS/FTD models.
a, qPCR analysis of daw (left panel) and Mp (right panel) transcript levels normalized to Tubulin in WT and GR36 flies. Graph, mean ± s.e.m., n = 8 independent biological replicates, unpaired two-sample Student’s t-test. Genotypes: w; GMR-Gal4/+, w; GMR-Gal4, UAS-GR36/+. NS denotes P > 0.05. b, Stereomicroscopy images of representative 2-day-old adult WT (top panel) or GR36 (bottom panel) Drosophila eyes in absence of or co-expressing daw or Mp RNAi constructs inserted into the second chromosome (II). Genotypes: w; GMR-Gal4/+, w; GMR-Gal4/UAS-daw RNAi, w; GMR-Gal4/UAS-Mp RNAi, w; GMR-Gal4, UAS-GR36/+, w; GMR-Gal4, UAS-GR36/UAS-daw RNAi, w; GMR-Gal4, UAS-GR36/UAS-Mp RNAi. c, Eye size of flies normalized to the mean of the control eye size. Graph, mean ± s.e.m.; n (independent biological replicates, one eye counted per fly) = 20 WT/+, 19 WT/daw RNAi, 23 GR36/+, 11 GR36/daw RNAi; two-way ANOVA, Bonferroni’s multiple comparison. Genotypes: w; GMR-Gal4/+, w; GMR-Gal4/UAS-daw RNAi, w; GMR-Gal4, UAS-GR36/+, w; GMR-Gal4, UAS-GR36/UAS-daw RNAi. d, Eye size of flies normalized to the mean of the control eye size. Graph, mean ± s.e.m.; n (independent biological replicates, one eye counted per fly) = 15 WT/+, 15 WT/Mp RNAi, 12 GR36/+, 10 GR36/Mp RNAi; two-way ANOVA, Bonferroni’s multiple comparison. Genotypes: w; GMR-Gal4/+, w; GMR-Gal4/UAS-Mp RNAi, w; GMR-Gal4, UAS-GR36/+, w; GMR-Gal4, UAS-GR36/UAS-Mp RNAi. e, Percentage cell viability as measured by Alamar Blue following 4-h exposure to 10 µM glutamate. n = 6 control and 6 C9orf72 iPS cell lines. Data points represent average percentage viability from three replicate wells for each condition. Two-way ANOVA with Tukey’s multiple comparison test was used to calculate statistical significance. f, Quantification of the ratio of PI-positive spots to DAPI-positive nuclei (quantification of cell death) following 4-h exposure to 10 µM glutamate. n = 6 control and 6 C9orf72 iPS cell lines. Data points represent average percentage cell death across ten images per well. Two-way ANOVA with Tukey’s multiple comparison test was used to calculate statistical significance. Source data
Extended Data Fig. 1
Extended Data Fig. 1. C9orf72 knock-in strategy and confirmation.
(a) Design for CRISPR assisted C9orf72 gene targeting. The sgRNA for CRISPR/Cas9 is indicated by the teal bar. (b) Mapping of targeted locus amplification reads across the mouse genome. The chromosomes are indicated on the y-axis, the chromosomal position on the x-axis. (c) Targeted locus amplification sequence coverage across the knock-in sequence. The whole knock-in sequence has good coverage except for the blue underlined backbone sequences as expected from a correct targeting event as the backbone is not included. A coverage gap is present at the location of the 400 DPRs, and is underlined by the orange bar. Y-axis is limited to 100x. (d) Targeted locus amplification sequence coverage across the knock-in integration locus. The red arrow points toward the knock-in integration site. Y-axis is limited to 250x. (e) Repeat-length PCR of (GR)400 genomic DNA to establish repeat length and stability over five generations. All (GR)400 and (PR)400 mice in the study generated were genotyped for repeat length and showed the correct size.
Extended Data Fig. 2
Extended Data Fig. 2. Patient and knock-in cortex polyGR comparison, generation of control C9orf72-eGFP knock-in mice, and C9orf72 knock-in transgene transcript levels in spinal cord.
(a) qPCR analysis of C9orf72 knock-in transgene transcript levels normalised to β-actin in spinal cord of WT, (GR)400, (PR)400, and eGFP mice at 12 months of age. Common primers in the HA-tag and upstream endogenous mouse sequence were used to enable direct comparison between all lines. Graph, mean ± SEM, n = 4 mice per genotype, one-way ANOVA, Bonferroni’s multiple comparison. (b) Quantification of polyGR proteins in C9ALS/FTD patient and 12-month old (GR)400 mouse cortex by MSD immunoassay. Graph, mean ± SEM, n = 4 independent samples per experimental group, two-sided unpaired two-sample Student’s t-test, ns denotes p > 0.05. (c) Quantification of eGFP proteins in brain (left panel) and spinal cord (right panel) of WT and eGFP mice at 3 months of age by ELISA. Graph, mean ± SEM, n = 4 mice per genotype, two-sided unpaired two-sample Student’s t-test. (d) qPCR analysis of C9orf72 transcript levels normalised to β-actin in brain (left panel) and spinal cord (right panel) of WT and eGFP mice at 3 months of age. Graph, mean ± SEM, n = 4 mice per genotype, two-sided unpaired two-sample Student’s t-test. (e) Representative confocal images of immunofluorescence staining labelled for HA-tag (red) in brain cortex and lumbar spinal cord ventral horn in WT (top panels), (GR)400 (centre panels), and (PR)400 (bottom panels) mice at 6 months of age. DAPI (blue) stains nuclei. n = 5 mice per genotype. (f) Representative confocal images of immunofluorescence staining labelled for PR (red) cellular localisation in brain cortex and spinal cord in WT (top panels) and (PR)400 (bottom panels) mice at 6 months of age. DAPI (blue) stains nuclei. n = 3 mice per genotype. Source data
Extended Data Fig. 3
Extended Data Fig. 3. (GR)400 and (PR)400 knock-in mice do not exhibit gliosis in brain and spinal cord up to 12 months of age.
(a) Representative confocal images and quantification of immunofluorescence staining of astrocytic marker S100β (green) and DAPI (blue) in brain cortex in WT, (GR)400, and (PR)400 mice at 12 months of age. Graph, mean ± SEM, n = 4-5 mice per genotype, one-way ANOVA, Bonferroni’s multiple comparison, ns for p > 0.05. (b) Representative confocal images and quantification of immunofluorescence staining of astrocytic marker GFAP (green) in lumbar spinal cord ventral horn in WT, (GR)400, and (PR)400 mice at 12 months of age. DAPI (blue) stains nuclei. Graph, mean ± SEM, n = 5 mice per genotype, one-way ANOVA, Bonferroni’s multiple comparison, ns denotes p > 0.05. (c) Representative confocal images and quantification of immunofluorescence staining showing microglial density and colocalization between microglial markers Iba1 (yellow) and microglial lysosomal marker CD68 (red) in brain cortex in WT, (GR)400, and (PR)400 mice at 12 months of age. Graph, mean ± SEM, n = 5 mice per genotype, one-way ANOVA, Bonferroni’s multiple comparison, ns denotes p > 0.05. (d) Representative confocal images and quantification of immunofluorescence staining showing microglial density and colocalization between microglial markers Iba1 (yellow) and microglial lysosomal marker CD68 (red) in lumbar spinal cord ventral horn in WT, (GR)400, and (PR)400 mice at 12 months of age. Graph, mean ± SEM, n = 5 mice per genotype, one-way ANOVA, Bonferroni’s multiple comparison, ns denotes p > 0.05. (e) Representative confocal images of immunofluorescence staining showing TDP-43 (green) cellular localisation in brain cortex in WT, (GR)400, and (PR)400 mice at 12 months of age. DAPI (blue) stains nuclei. n = 5 mice per genotype. (f) Representative confocal images of immunofluorescence staining showing TDP-43 (green) cellular localisation in lumbar spinal cord ventral horn in WT, (GR)400, and (PR)400 mice at 12 months of age. DAPI (blue) stains nuclei. n = 5 mice per genotype. (g) Western blotting analysis of phosphorylated TDP-43 protein levels in spinal cord of WT, (GR)400, and (PR)400 mice at 12 months of age shows no abnormal p-TDP-43 bands in the knock-in mice. Cortex of P24 homozygous TAR4/4 mice, which develop disease-associated pTDP-43 is used as positive control. Calnexin is shown as loading control. n = 4 mice per genotype. Source data
Extended Data Fig. 4
Extended Data Fig. 4. (GR)400 and (PR)400 knock-in mice do not exhibit cortical hyperexcitability in motor cortex layer 5.
(a) Percentage of silent (0 Ca2+-transients per min) neurons in motor cortex superficial layers of WT (n = 4 mice), (GR)400 (n = 3 mice), and (PR)400 (n = 4 mice) mice at 15-19 months of age. Graph, mean ± SEM, one-way ANOVA, Tukey’s multiple comparison, ns denotes p > 0.05. (b) Cumulative distribution plot displaying neuronal Ca2+-transient rates across animals in layer 5 of WT (187 cells, 4 mice), (GR)400 (616 cells, 3 mice) and (PR)400 (305 cells, 4 mice) mice at 15-19 months of age. (c) Percentage of hyperactive (>3 Ca2+-transients per minute) neurons in motor cortex layer 5 of WT, (GR)400, and (PR)400 mice at 15-19 months of age. Graph, mean ± SEM, n = 3 mice per genotype, one-way ANOVA, Tukey’s multiple comparisons, ns denotes p > 0.05. (d) Percentage of silent (0 Ca2+-transients per min) neurons in motor cortex layer 5 of WT, (GR)400, and (PR)400 mice at 15-19 months of age. Graph, mean ± SEM, n = 3 mice per genotype, one-way ANOVA, Tukey’s multiple comparisons, ns denotes p > 0.05. (e) Quantification of NeuN-positive cell density in the whole cortex in WT, (GR)400, and (PR)400 mice at 18 months of age. Graph, mean ± SEM, n = 5 mice per genotype, one-way ANOVA, Bonferroni’s multiple comparison, ns denotes p > 0.05. (f) Quantification of NeuN-positive cell density in motor cortex in WT, (GR)400, and (PR)400 mice at 18 months of age. Graph, mean ± SEM, n = 5 mice per genotype, one-way ANOVA, Bonferroni’s multiple comparison, ns denotes p > 0.05. (g) Quantification of CTIP2-positive upper motor neuron density in layer V of the motor cortex in WT, (GR)400, and (PR)400 mice at 18 months of age. Graph, mean ± SEM, n = 5 mice per genotype, one-way ANOVA, Bonferroni’s multiple comparison, ns denotes p > 0.05. (h) Mean firing rate (log10Hz) of neurons in motor cortex layer 5 in WT, (GR)400, (PR)400, and eGFP mice at 15-19 months of age; black lines indicate medians, dashed lines indicate quartiles. Graph, n = 3 mice per genotype, one-way ANOVA, Tukey’s multiple comparison, ns denotes p > 0.05. (i) Representative image of the motor cortex showing HA-tag localisation form upper to lower cortical layers in (GR)400 mice at 6 months of age. n = 3 mice per genotype. Source data
Extended Data Fig. 5
Extended Data Fig. 5. Female poly(GR) and poly(PR) knock-in mice develop rotarod impairment.
(a) Body weights of WT, (GR)400, and (PR)400 female mice up to 12 months of age. Graph, mean ± SEM, n = 14 mice per genotype, two-way ANOVA, Bonferroni’s multiple comparison, ns denotes p > 0.05. (b) Accelerated rotarod analysis of motor coordination in WT, (GR)400, and (PR)400 female mice up to 12 months of age. Graph, mean ± SEM, n = 14 mice per genotype, two-way ANOVA, Bonferroni’s multiple comparison, ns denotes p > 0.05. (c) Grip strength analysis of muscle force in WT, (GR)400, and (PR)400 male mice over lifespan. Graph, mean ± SEM, n = 14 mice per genotype, two-way ANOVA, Bonferroni’s multiple comparison, ns denotes p > 0.05. (d) Grip strength analysis of muscle force in WT, (GR)400, and (PR)400 female mice over lifespan. Graph, mean ± SEM, n = 14 mice per genotype, two-way ANOVA, Bonferroni’s multiple comparison, ns denotes p > 0.05. Source data
Extended Data Fig. 6
Extended Data Fig. 6. eGFP knock-in mice do not develop motor unit reduction or rotarod impairment.
(a) Body weight analysis of WT and eGFP male mice over lifespan. Graph, mean ± SEM, n = 14 mice per genotype, two-way ANOVA, Bonferroni’s multiple comparison, ns denotes p > 0.05. (b) Accelerated rotarod analysis of motor coordination in WT and eGFP male mice from 3 to 12 months of age. Graph, mean ± SEM, n = 14 mice per genotype, two-way ANOVA, Bonferroni’s multiple comparison, ns denotes p > 0.05. (c) Grip strength analysis of muscle force in WT and eGFP male mice over lifespan. Graph, mean ± SEM, n = 14 mice per genotype, two-way ANOVA, Bonferroni’s multiple comparison, ns denotes p > 0.05. (d) Quantification of Nissl-stained motor neurons in lumbar spinal cord region L3-L5 in WT and eGFP mice at 12 months of age. Graph, mean ± SEM, n = 5 mice per genotype, two-sided unpaired two-sample Student’s t-test, ns denotes p > 0.05. (e) Quantification of MUNE determined in EDL muscle in WT and eGFP mice at 12 months of age. Graph, mean ± SEM, n mice = 6 WT and 6 eGFP, n muscles = 11 WT and 11 eGFP, two-sided unpaired two-sample Student’s t-test, ns denotes p > 0.05. Source data
Extended Data Fig. 7
Extended Data Fig. 7. Neuromuscular junction analysis in hindlimb lumbrical muscles of WT, (GR)400, and (PR)400 mice.
(a) Representative confocal images of hindlimb lumbrical muscles stained to visualize pre- (SV2A/2H3, yellow) and post-synaptic (α-Bungarotoxin, red) NMJ morphology in WT, (GR)400, and (PR)400 mice at 12 months of age. n = 4-6 mice per genotype. Arrowheads indicate blebbing events. (b–d) Quantification of blebbing events (b), pre- and post-synaptic overlap (c) and endplate area (d) in WT, (GR)400, and (PR)400 mice at 12 months of age. Graph, mean ± SEM, n = 4-6 mice per genotype, one-way ANOVA, Bonferroni’s multiple comparison, ns denotes p > 0.05. Source data
Extended Data Fig. 8
Extended Data Fig. 8. (GR)400 and (PR)400 knock-in mouse spinal cord extracellular matrix signature is conserved in C9orf72 patient motor neurons and (GR)400 and (PR)400 knock-in mouse spinal cord have decreased synapse protein levels.
(a) Protein expression volcano plots from the cortex of 12-month old (GR)400 (left panel) and (PR)400 (right panel) mice. WT (n = 4 mice), (GR)400 (n = 5 mice), (PR)400 (n = 5 mice), two-sided Welch’s t-Test with 5% FDR multiple-correction. (b) Significantly enriched activated (left) and suppressed (right) Gene Ontology (GO) pathways in C9orf72 patient laser capture microdissected spinal cord motor neuron microarray data. The names of GO terms are shown on the y axis, and the gene ratio is shown on the x axis. The depth of the colour illustrates the adjusted p-value, adjusted p values were calculated by Kolmogorov–Smirnov test with Benjamini-Hochberg correction. The size of the circle in the graph corresponds to the size of the gene set. (c) GO analysis displaying GO term name and code from significantly downregulated (yellow) proteins in the lumbar spinal cord of (GR)400 (left panel), or (PR)400 (right panel) mice at 12 months of age. Proteomics performed on WT (n = 4 mice), (GR)400 (n = 5 mice), (PR)400 (n = 6 mice), two-sided Welch’s t-Test with 5% FDR multiple-correction. (d) Protein expression volcano plot from the lumbar spinal cord of 12-month old eGFP mice. n = 5 mice per genotype, two-sided Welch’s t-Test with 5% FDR multiple-correction. (e) Western blot of COL6A1 in cortex of WT, (GR)400, and (PR)400 mice at 12 months of age. Calnexin is shown as loading control. Graph, mean ± SEM, n = 4-5 mice per genotype, one-way ANOVA, Bonferroni’s multiple comparison, ns denotes p > 0.05. (f) Quantification of immunofluorescence staining of COL6A1 in lumbar spinal cord in WT and eGFP mice at 12 months of age. Graph, mean ± SEM, n = 4 WT and 5 eGFP mice, two-sided unpaired two-sample Student’s t-test, ns denotes p > 0.05. Source data
Extended Data Fig. 9
Extended Data Fig. 9. COL6A1 is predominantly expressed in neurons.
(a) Representative confocal images of immunofluorescence staining of COL6A1 (red) and NeuN (yellow) in lumbar spinal cord in (GR)400, and (PR)400 mice at 12 months of age. DAPI (blue) stains nuclei. n = 5 mice per genotype. (b) Representative images of immunofluorescence staining of COL6A1 (red) and GFAP (yellow) in lumbar spinal cord in WT, (GR)400, and (PR)400 mice at 12 months of age. DAPI (blue) stains nuclei. n = 3 mice per genotype. (c) Representative Incucyte images of i3Neurons expressing (GR)50, or GFP at DIV 4, 5 and 7. n = 3 independent biological replicates.
Extended Data Fig. 10
Extended Data Fig. 10. TGF-β1 and COL6A1 reduction specifically exacerbates polyGR toxicity in vivo.
Two distinct RNAi lines per gene (Mp and daw) were tested, with the RNAi cassette inserted into either the attp40 or attp2 sites on the second (II) or third (III) chromosome respectively. (a) Stereomicroscopy images of representative 2-day old adult GMR (top panel) or GMR, GR36 (bottom panel) Drosophila eyes in absence or co-expressing daw or Mp RNAi constructs. Genotypes: GMR/+; GMR, daw RNAi (III); GMR, Mp RNAi (III); GMR, GR36/+; GMR, GR36, daw RNAi (III); GMR, GR36, Mp RNAi (III). (b-c) Quantification of the effects of daw and Mp RNAi on the rough eye phenotype in GR36 flies. n = 71 GMR,GR36, 45 GMR,GR36; daw RNAi (III), 68 GMR,GR36; Mp RNAi (III). The p value was determined by chi-squared test. (d–g) Lifespan of GR36/Ctrl (108), or GR36/daw RNAi (II) (118), or GR36/daw RNAi (III) (117), or GR36/Mp RNAi (II) (126), or GR36/Mp RNAi (III) (44). The p value was determined by log-rank test. Genotypes: w; UAS-(GR)36/+; ElavGS/+, w; UAS-(GR)36/UAS-daw RNAi; ElavGS/+, w; UAS-(GR)36/+; ElavGS/UAS-daw RNAi, w; UAS-(GR)36/UAS-Mp RNAi; ElavGS/+, w; UAS-(GR)36/+; ElavGS/UAS-Mp RNAi. (h) Lifespan of WT/daw RNAi (II) -RU (142) or WT/daw RNAi (II) + RU (153). The p value was determined by log-rank test vs. the vehicle-treated (-RU) group. Genotype: w; UAS-daw RNAi/+; ElavGS/+. (i) Lifespan of WT/daw RNAi (III) -RU (157) or WT/daw RNAi (III) + RU (153). The p value was determined by log-rank test vs. the vehicle-treated (-RU) group. Genotype: w; ElavGS/UAS-daw RNAi. (j) Lifespan of WT/Mp RNAi (II) -RU (146) or WT/Mp RNAi (II) + RU (146). The p value was determined by log-rank test vs. the vehicle-treated (-RU) group. Genotype: w; UAS-Mp RNAi/+; ElavGS/+. (k) Lifespan of WT/Mp RNAi (III) -RU (116) or WT/Mp RNAi (III) + RU (116). The p value was determined by log-rank test vs. the vehicle-treated (-RU) group. Genotype: w; ElavGS/UAS-Mp RNAi. Source data

Similar articles

Cited by

References

    1. DeJesus-Hernandez M, et al. Expanded GGGGCC hexanucleotide repeat in noncoding region of C9ORF72 causes chromosome 9p-linked FTD and ALS. Neuron. 2011;72:245–256. doi: 10.1016/j.neuron.2011.09.011. - DOI - PMC - PubMed
    1. Renton AE, et al. A hexanucleotide repeat expansion in C9ORF72 is the cause of chromosome 9p21-linked ALS-FTD. Neuron. 2011;72:257–268. doi: 10.1016/j.neuron.2011.09.010. - DOI - PMC - PubMed
    1. Balendra R, Isaacs AM. C9orf72-mediated ALS and FTD: multiple pathways to disease. Nat. Rev. Neurol. 2018;14:544–558. doi: 10.1038/s41582-018-0047-2. - DOI - PMC - PubMed
    1. Zu T, et al. Non-ATG-initiated translation directed by microsatellite expansions. Proc. Natl Acad. Sci. USA. 2011;108:260–265. doi: 10.1073/pnas.1013343108. - DOI - PMC - PubMed
    1. Ash PEA, et al. Unconventional translation of C9ORF72 GGGGCC expansion generates insoluble polypeptides specific to c9FTD/ALS. Neuron. 2013;77:639–646. doi: 10.1016/j.neuron.2013.02.004. - DOI - PMC - PubMed