

The global atlas of edible insects: analysis of diversity and commonality contributing to food systems and sustainability
- PMID: 38424443
- PMCID: PMC10904393
- DOI: 10.1038/s41598-024-55603-7
The global atlas of edible insects: analysis of diversity and commonality contributing to food systems and sustainability
Abstract
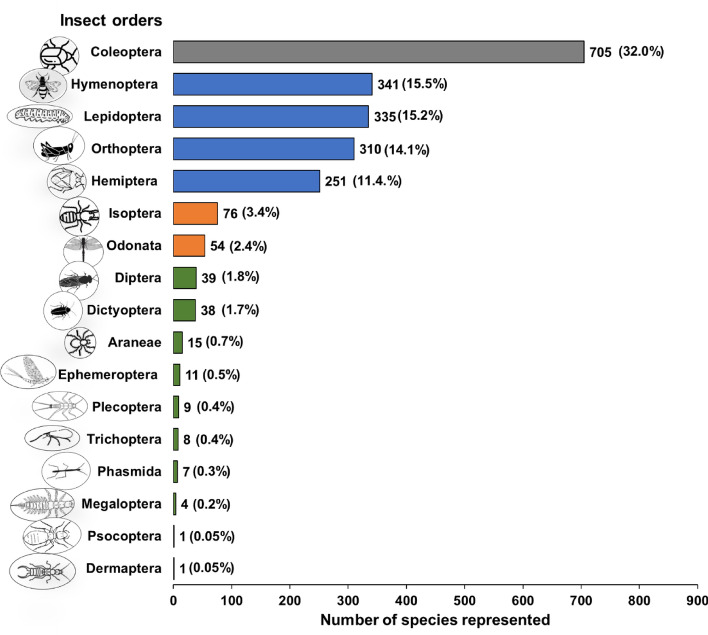
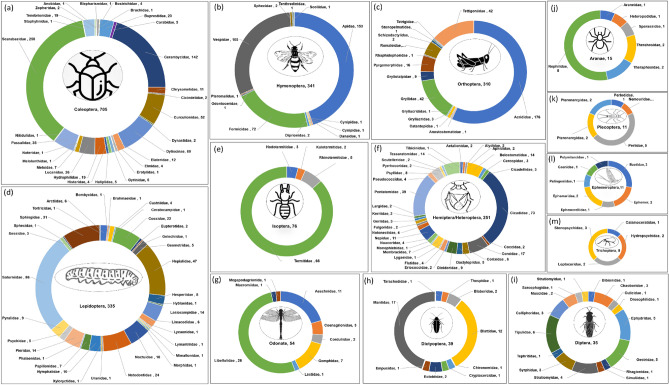
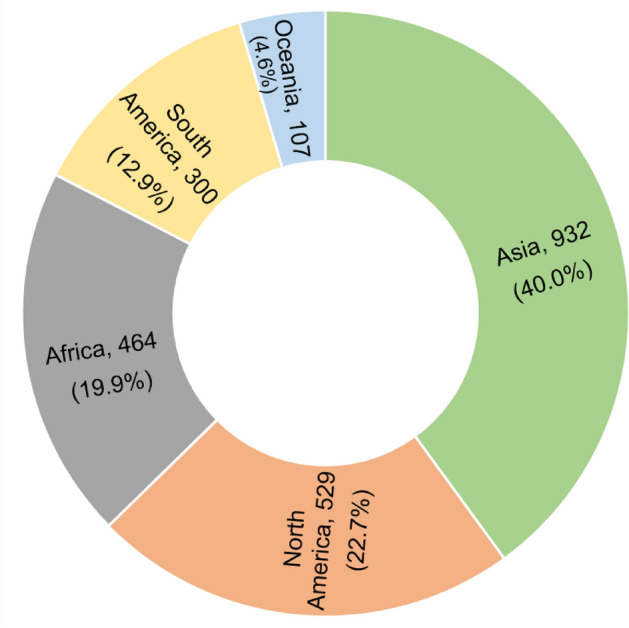
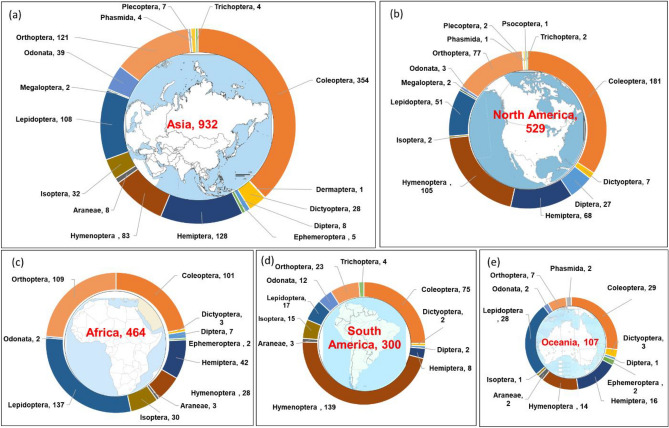
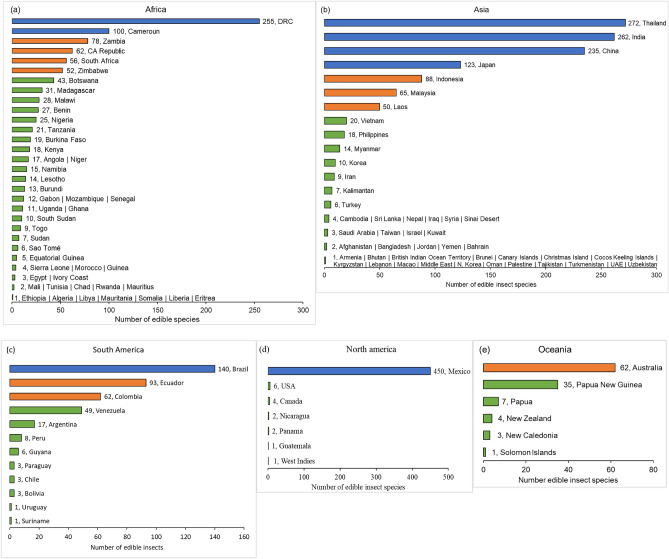
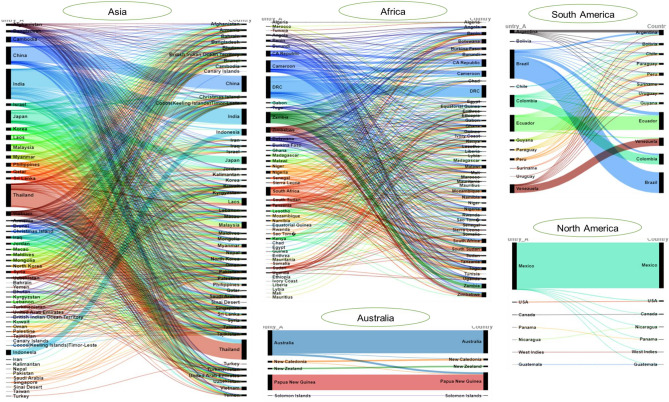
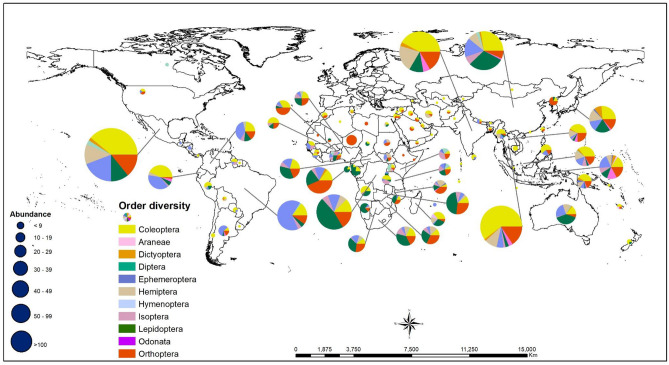
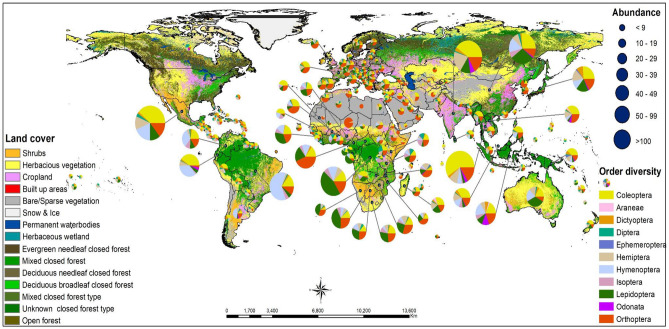
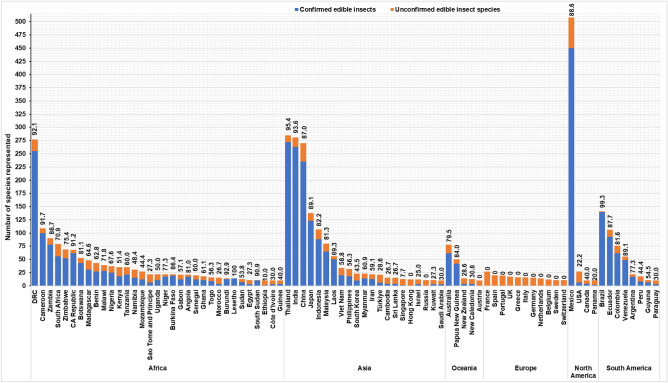
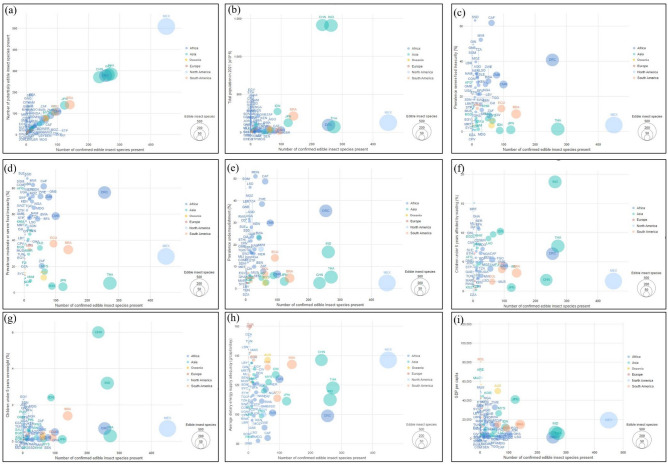
The future of the food system on the planet is increasingly facing uncertainties that are attributable to population growth and a surge in demand for nutritious food. Traditional agricultural practices are poised to place strain on production, as well as natural resources and ecosystem services provided, particularly under a changing climate. Given their remarkable attributes, including a low environmental footprint, high food conversion ratio, rapid growth and nutritional values, edible insects can play a vital role in the global food system. Nonetheless, substantial knowledge gaps persist regarding their diversity, global distribution, and shared characteristics across regions, potentially impeding effective scaling and access to edible insects. Therefore, we compiled and analysed the fragmented database on edible insects and identified potential drivers that elucidate insect consumption, globally, focusing on promoting a sustainable food system. We collated data from various sources, including the literature for a list of edible insect species, the Global Biodiversity Information Facility and iNaturalist for the geographical presence of edible insects, the Copernicus Land Service library for Global Land Cover, and FAOSTAT for population, income, and nutritional security parameters. Subsequently, we performed a series of analytics at the country, regional and continental levels. Our study identifies 2205 insect species, consumed across 128 countries globally. Among continents, Asia has the highest number of edible insects (932 species), followed by North America (mainly Mexico) and Africa. The countries with the highest consumption of insects are Mexico (450 species), Thailand (272 species), India (262 species), DRC (255 species), China (235 species), Brazil (140 species), Japan (123 species), and Cameroon (100 species). Our study also revealed some common and specific practices related to edible insect access and utilisation among countries and regions. Although insect consumption is often rooted in cultural practices, it exhibits correlations with land cover, the geographical presence of potentially edible insects, the size of a country's population, and income levels. The practice of eating insects is linked to the culture of people in Africa, Asia, and Latin America, while increased consciousness and the need for food sustainability are driving most of the European countries to evaluate eating insects. Therefore, edible insects are becoming an increasingly significant part of the future of planetary food systems. Therefore, more proactive efforts are required to promote them for their effective contribution to achieving sustainable food production.
© 2024. The Author(s).
Conflict of interest statement
The authors declare no competing interests.
Figures
Similar articles
-
Edible Insects Consumption in Africa towards Environmental Health and Sustainable Food Systems: A Bibliometric Study.Int J Environ Res Public Health. 2022 Nov 11;19(22):14823. doi: 10.3390/ijerph192214823. Int J Environ Res Public Health. 2022. PMID: 36429542 Free PMC article. Review.
-
Traditional consumption of and rearing edible insects in Africa, Asia and Europe.Crit Rev Food Sci Nutr. 2019;59(14):2169-2188. doi: 10.1080/10408398.2018.1440191. Epub 2018 Mar 15. Crit Rev Food Sci Nutr. 2019. PMID: 29446643 Review.
-
Legal situation and consumer acceptance of insects being eaten as human food in different nations across the world-A comprehensive review.Compr Rev Food Sci Food Saf. 2023 Nov;22(6):4786-4830. doi: 10.1111/1541-4337.13243. Epub 2023 Oct 12. Compr Rev Food Sci Food Saf. 2023. PMID: 37823805 Review.
-
Stewardship of Wild and Farmed Edible Insects as Food and Feed in Sub-Saharan Africa: A Perspective.Front Vet Sci. 2021 Feb 19;8:601386. doi: 10.3389/fvets.2021.601386. eCollection 2021. Front Vet Sci. 2021. PMID: 33681322 Free PMC article. Review.
-
Insect Allergens on the Dining Table.Curr Protein Pept Sci. 2020;21(2):159-169. doi: 10.2174/1389203720666190715091951. Curr Protein Pept Sci. 2020. PMID: 31309888 Review.
Cited by
-
Research Progress and Production Status of Edible Insects as Food in China.Foods. 2024 Jun 24;13(13):1986. doi: 10.3390/foods13131986. Foods. 2024. PMID: 38998491 Free PMC article. Review.
-
The contribution of commonly consumed edible insects to nutrition security in the Eastern D.R. Congo.Sci Rep. 2024 Jul 13;14(1):16186. doi: 10.1038/s41598-024-64078-5. Sci Rep. 2024. PMID: 39003308 Free PMC article.
-
What Veterinarians Need to Know About the Newly-Emerging Field of Insects-as-Food-and-Feed.Vet Sci. 2024 Dec 31;12(1):12. doi: 10.3390/vetsci12010012. Vet Sci. 2024. PMID: 39852887 Free PMC article. Review.
-
Authentication of Insect-Based Products in Food and Feed: A Benchmark Survey.Insects. 2025 Jul 17;16(7):729. doi: 10.3390/insects16070729. Insects. 2025. PMID: 40725360 Free PMC article.
-
Entomophagy Attitudes Among Turkish Generation Z University Students: A Scale Validation and Path Analysis Model for Sustainable and Healthy Dietary Choices.Food Sci Nutr. 2025 Jun 8;13(6):e70397. doi: 10.1002/fsn3.70397. eCollection 2025 Jun. Food Sci Nutr. 2025. PMID: 40491982 Free PMC article.
References
-
- Leach M, Nisbett N, Cabral L, Harris J, Hossain N, Thompson J. Food politics and development. World Dev. 2020;134:105024.
-
- United Nations. The World Population Prospects, The 2017 Revision (2017).
-
- WHO . Workshop on Regulatory and Food Safety Aspects of Alternative Proteins for Conventional Animal Products. World Health Organization; 2021.
-
- Clark MA, Domingo NG, Colgan K, Thakrar SK, Tilman D, Lynch J, Azevedo IL, Hill JD. Global food system emissions could preclude achieving the 1.5 and 2 °C climate change targets. Science. 2020;370:705–708. - PubMed
MeSH terms
Substances
Grants and funding
LinkOut - more resources
Full Text Sources
