. 2024 Feb 29;13(1):10.
doi: 10.1038/s41389-024-00512-7.

Progesterone receptor potentiates macropinocytosis through CDC42 in pancreatic ductal adenocarcinoma

Affiliations

Progesterone receptor potentiates macropinocytosis through CDC42 in pancreatic ductal adenocarcinoma

Ying-Na Liao et al. Oncogenesis. .

Abstract

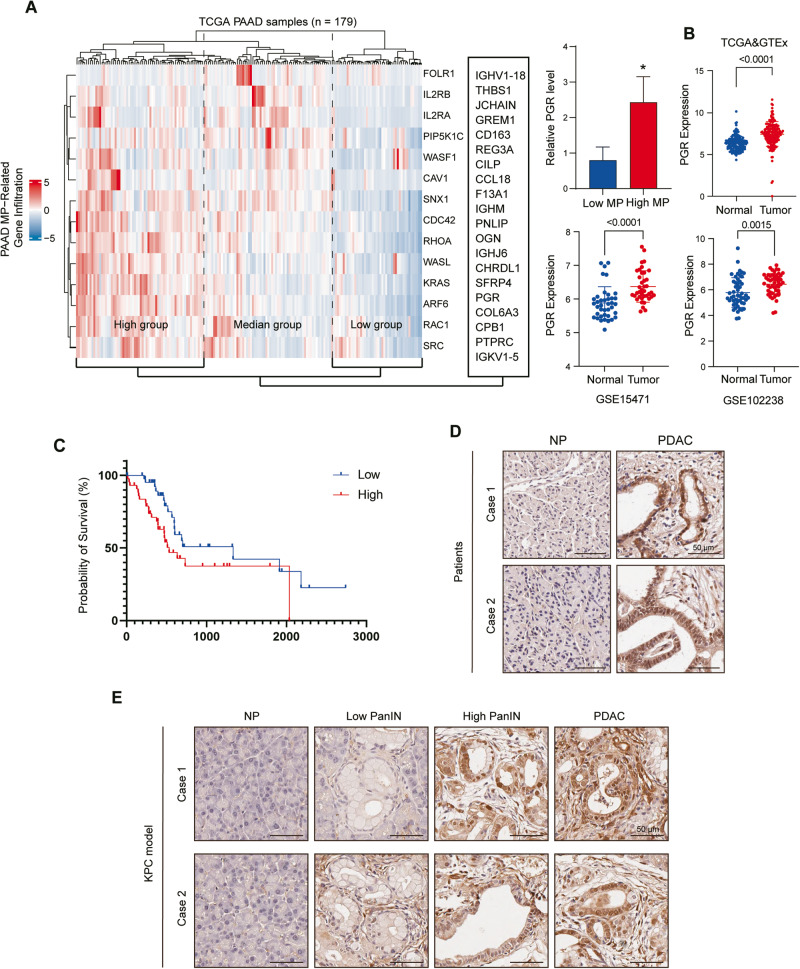
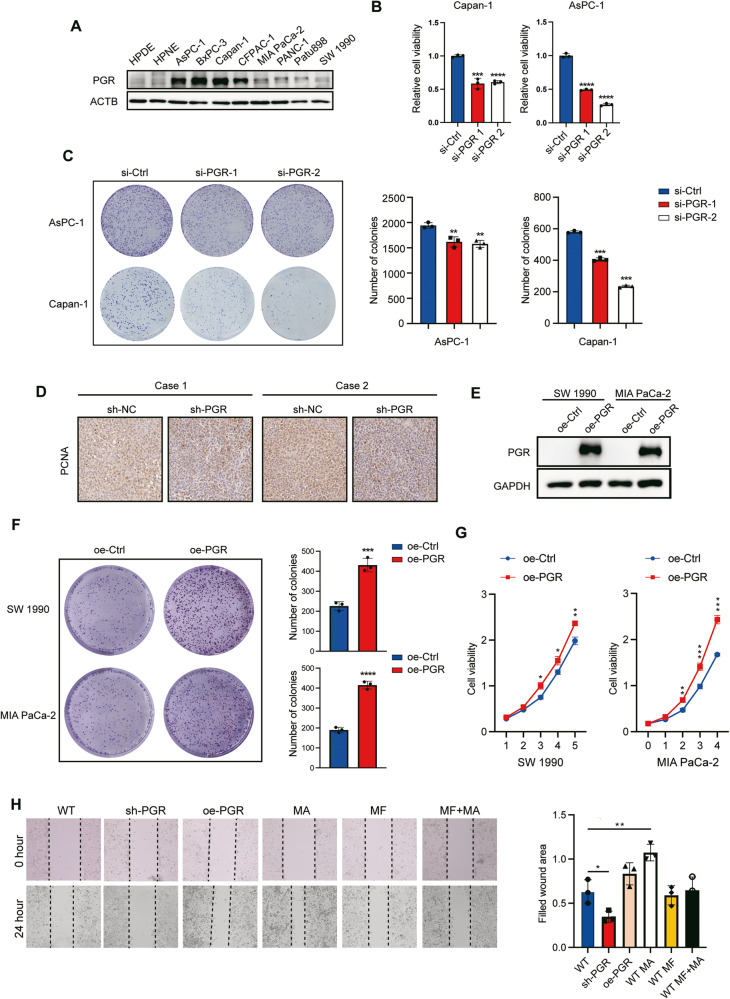
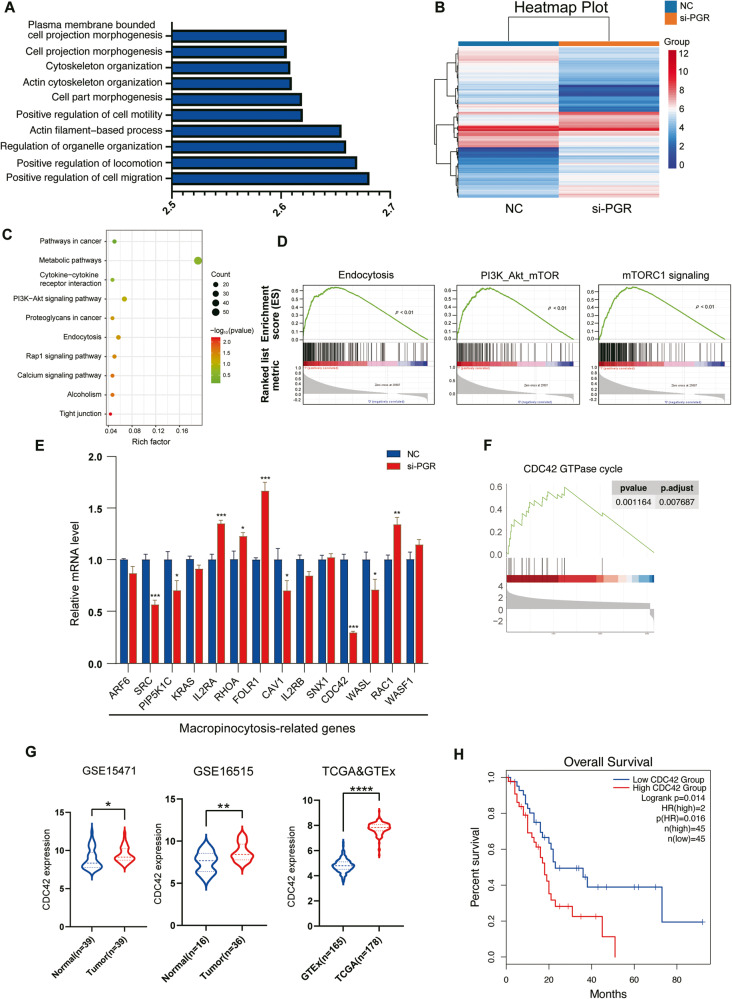
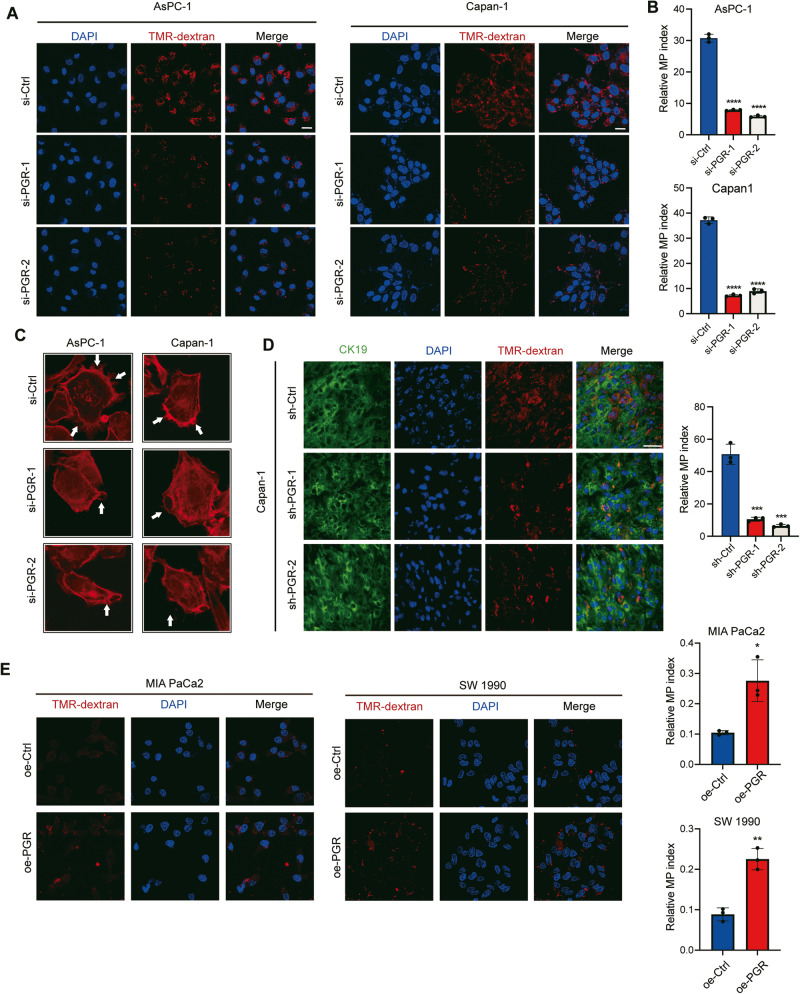
Endocrine receptors play an essential role in tumor metabolic reprogramming and represent a promising therapeutic avenue in pancreatic ductal adenocarcinoma (PDAC). PDAC is characterized by a nutrient-deprived microenvironment. To meet their ascendant energy demands, cancer cells can internalize extracellular proteins via macropinocytosis. However, the roles of endocrine receptors in macropinocytosis are not clear. In this study, we found that progesterone receptor (PGR), a steroid-responsive nuclear receptor, is highly expressed in PDAC tissues obtained from both patients and transgenic LSL-KrasG12D/+; LSL-Trp53R172H/+; PDX1-cre (KPC) mice. Moreover, PGR knockdown restrained PDAC cell survival and tumor growth both in vitro and in vivo. Genetic and pharmacological PGR inhibition resulted in a marked attenuation of macropinocytosis in PDAC cells and subcutaneous tumor models, indicating the involvement of this receptor in macropinocytosis regulation. Mechanistically, PGR upregulated CDC42, a critical regulator in macropinocytosis, through PGR-mediated transcriptional activation. These data deepen the understanding of how the endocrine system influences tumor progression via a non-classical pathway and provide a novel therapeutic option for patients with PDAC.


Conflict of interest statement

The authors declare no competing interests.

Figures

Fig. 1
Fig. 1. PGR is a potential macropinocytosis gene and is overexpressed in PDAC.
A Hierarchical cluster analysis of genes related to macropinocytosis and the top 20 differently expressed genes between high and low macropinocytosis groups. Expression of PGR between high and low macropinocytosis groups (right panel). B Expression of PGR of paired normal pancreatic (NP) and pancreatic ductal adenocarcinoma (PDAC) tissues in TCGA&GTEx, GSE15471, GSE102238. p values were determined by paired two-tailed t-test. C Kaplan–Meier curves of overall survival of pancreatic patients stratified by PGR expression. Data were obtained from the TCGA. n = 91 patients. D Representative images of immunohistochemical staining for PGR in pancreatic cancer tissues and normal pancreatic tissues from two cases of patients. Scale bar, 50 μm. E Representative images of immunohistochemical staining for PGR in pancreatic tissues from KPC mice. Scale bar, 50 μm.
Fig. 2
Fig. 2. PGR is overexpressed in PDAC patients and related to the clinicopathologic parameters.
A Representative images of immunohistochemical staining for PGR in pancreatic tissues tissue microarray. Scale bar, 200 μm (left panel) and 50 μm (right panel). BD Representative IHC staining (B) and statistical analysis of the PGR levels with pancreatic cancer TNM stages (C). Scores −, + represent low expression and ++, +++ represent high expression. D Quantification of PGR up-regulated, down-regulated, and no change cases of PDAC pancreatic tissue microarray. (n = 80).
Fig. 3
Fig. 3. PGR contributes to cell survival and tumor growth in PDAC.
A Western blot analysis of PGR expression levels in human PDAC cell lines. B CCK-8 assay of PGR knockdown by siRNA in Capan-1 cells (left) and AsPC-1 cells (right) (n = 5). Statistical significance was determined using t-test. *p ≤ 0.05, **p ≤ 0.01, ***p ≤ 0.001. C Colony formation assay of control AsPC-1 vs AsPC-1 with PGR knockdown (top) and control Capan-1 vs Capan-1 with PGR knockdown (bottom) (n = 3). The right panel is quantification. Statistical significance was determined using t-test. *p ≤ 0.05, **p ≤ 0.01, ***p ≤ 0.001. D PCNA immunostaining in xenograft pancreatic tumor sections in control and PGR knockdown group. Scale bar, 100 μm. E Western blot analysis of PGR overexpression levels in SW1990 and MIA PaCa-2 cells. F Colony formation assay of cells overexpressed PGR and the quantification. G CCK-8 assay of PDAC cells overexpressed PGR. *p ≤ 0.05, **p ≤ 0.01, ***p ≤ 0.001, ****p ≤ 0.0001. H Wound healing assay of Capan-1 cell transfected with shRNA and overexpressed-plasmid or treated with Medroxyprogesterone acetate (MA) (10 μM) and Mifepristone (MF) (10 μM) for 24 h. *p ≤ 0.05, **p ≤ 0.01.
Fig. 4
Fig. 4. PGR knockdown has a synergic effect with gemcitabine in PDAC cells.
A The co-expression analysis of PGR with PDAC RNA-sequence data in linkedomics dataset. B Reactome gene set enrichment analysis of PGR expressed-relative DEGs in TCGA database. The top 10 terms. C Subcutaneous xenografts of Capan-1 cells transfected with sh-Ctrl or sh-PGR and treated with or without gemcitabine (n = 3). Tumor weight was measured and compared between the four groups. Statistical significance was determined using unpaired t-test. **p ≤ 0.01. D EdU incorporation assay in PDAC cells (AsPC-1 and Capan-1) transfected si-NC or si-PGR and treated with gemcitabine. Scale bar, 50 μm. E CCK8 assay of PDAC cells (Capan-1) transfected si-NC or si-PGR and treated with gemcitabine. *p ≤ 0.05, **p ≤ 0.01, ***p ≤ 0.001.
Fig. 5
Fig. 5. PGR activates macropinocytosis-relative pathways in PDAC cells.
A GSEA analysis plot of GO-BP function in TCGA database. The top 15 terms. B Heatmap profiles of differential gene expression between negative control (NC) and si-PGR AsPC-1 cells from mRNA array analysis. Red indicates an increase in expression and blue indicates a decrease in expression. C KEGG pathways ranked by p value are significantly upregulated in PGR high-expression group. D Gene Set Enrichment Analysis (GSEA) of pathways related to cancer, mTORC1, PI3K-Akt-mTOR and endocytosis in mRNA array analysis data. E Expression changes of genes related to macropinocytosis between NC and si-PGR AsPC-1 cells. t-test was used to calculate the significance between NC and si-PGR groups. *p ≤ 0.05, **p ≤ 0.01, ***p ≤ 0.001. F Reactome Gene Set Enrichment Analysis related to CDC42GTPase cycle in TCGA dataset. G Expression of CDC42 of normal pancreatic (NP) and pancreatic ductal adenocarcinoma (PDAC) tissues in TCGA&GTEx, GSE15471, and GSE102238. p values were determined by paired two-tailed t-test. *p ≤ 0.05, **p ≤ 0.01, ***p ≤ 0.001, ****p ≤ 0.0001. H Kaplan–Meier curves of overall survival of pancreatic patients stratified by CDC42 expression. n = 90.
Fig. 6
Fig. 6. PGR regulates macropinocytosis in PDAC cells in vitro and in vivo.
A Representative fluorescence images of dextran uptake by PDAC cells transfected with si-Ctrl or si-PGR. (Scale bar, 50 μm). B Quantification of macropinocytosis in A. n = 6 and p-value determined by t-test. C Representative images of Capan-1 and AsPC-1 cells transfected with si-Ctrl or si-PGR, with actin filaments labeled with phalloidin-iFluor 594 (red). White arrowheads indicate membrane ruffles. Scale bar, 10 μm. D Representative fluorescence images of dextran (red) uptake from sections of PDAC xenograft tumor tissue. Tumor cells immunostained with anti-CK19 (green) and nuclei are labeled with DAPI (blue). Scale bar, 50 μm. Quantification of macropinocytosis in PDAC xenograft tumor tissue (right panel). n = 5, and p-value is determined by t-test. E Representative fluorescence images of dextran uptake by PDAC cells (SW 1990 and MIA PaCa-2) transfected with oe-Ctrl and oe-PGR. (Scale bar, 50 μm) Quantification of macropinocytosis (right panel). n = 6 and p-value determined by t-test. *p ≤ 0.05, **p ≤ 0.01, ***p ≤ 0.001.
Fig. 7
Fig. 7. PGR promotes PDAC tumor growth by inducing macropinocytosis.
A Representative fluorescence images of dextran uptake by PDAC cells (AsPC-1 and Capan-1) treated with agonist (MA) and antagonist (MF) of PGR at a concentration of 10 μM for 24 h. (Scale bar, 50 μm) B Quantification of macropinocytosis in A. n = 6 and p-value determined by t-test. C IHC analyses of the level of PCNA in xenograft pancreatic tumor cells in control and PGR depletion group. Scale bar, 100 μm. D CCK8 assay of PDAC cells (SW 1990 and MIA PaCa-2) transfected oe-NC or oe-PGR and treated with different doses of EIPA (0.5, 1.0, 2.0, 5.0 μM). EH EdU incorporation assay in PDAC cells (SW 1990 and MIA PaCa-2) transfected oe-NC or oe-PGR and treated with different doses of EIPA (0.5, 1.0 μM). Scale bar, 50 μm. *p ≤ 0.05, **p ≤ 0.01, ***p ≤ 0.001.
Fig. 8
Fig. 8. PGR promotes macropinocytosis through regulating CDC42 expression.
A, B Western blotting for PGR and CDC42 in PDAC cells transfected with si-Ctrl, si-PGR, oe-Ctrl and oe-PGR. C, D Western blotting for CDC42 in PDAC cells (AsPC-1 and Capan-1) treated with different doses of MA (1, 5, 10 μM) and MF (10 μM) for 24 h. E Representative immunofluorescence images of PDAC cells transfected with si-Ctrl or si-PGR and labeled with anti-active CDC42 antibody (red) and DAPI (blue). Scale bar, 20 μm. F Predicted binding sites of PGR on CDC42 promoter region. G Luciferase reporter assays showing the impact of PGR overexpression on CDC42 promoter in PDAC cells (AsPC-1 and Capan-1). H ChIP assay to evaluate PGR binding to the promoter region of CDC42 in PDAC cells (AsPC-1 and Capan-1). ****p ≤ 0.0001.

Similar articles

Cited by

References

    1. Siegel RL, Miller KD, Wagle NS, Jemal A. Cancer statistics, 2023. CA Cancer J Clin. 2023;73:17–48. doi: 10.3322/caac.21763. - DOI - PubMed
    1. Mazur PK, Siveke JT. Genetically engineered mouse models of pancreatic cancer: unravelling tumour biology and progressing translational oncology. Gut. 2012;61:1488–1500. doi: 10.1136/gutjnl-2011-300756. - DOI - PubMed
    1. Kleeff, J, Korc, M, Apte, M, La Vecchia, C, Johnson, CD, Biankin, AV, et al. Pancreatic cancer. Nat Rev Dis Primers. 2016;2:16022. 10.1038/nrdp.2016.22. - PubMed
    1. Aslan M, Shahbazi R, Ulubayram K, Ozpolat B. Targeted therapies for pancreatic cancer and hurdles ahead. Anticancer Res. 2018;38:6591–606. doi: 10.21873/anticanres.13026. - DOI - PubMed
    1. Ferreira APA, Boucrot E. Mechanisms of carrier formation during clathrin-independent endocytosis. Trends Cell Biol. 2018;28:188–200. doi: 10.1016/j.tcb.2017.11.004. - DOI - PubMed