

Assessment of a one-week ketogenic diet on brain glycolytic metabolism and on the status epilepticus stage of a lithium-pilocarpine rat model
- PMID: 38424459
- PMCID: PMC10904769
- DOI: 10.1038/s41598-024-53824-4
Assessment of a one-week ketogenic diet on brain glycolytic metabolism and on the status epilepticus stage of a lithium-pilocarpine rat model
Abstract
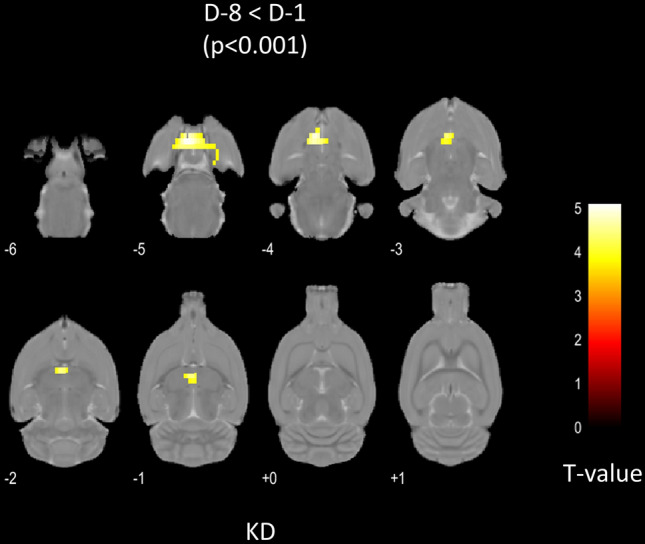
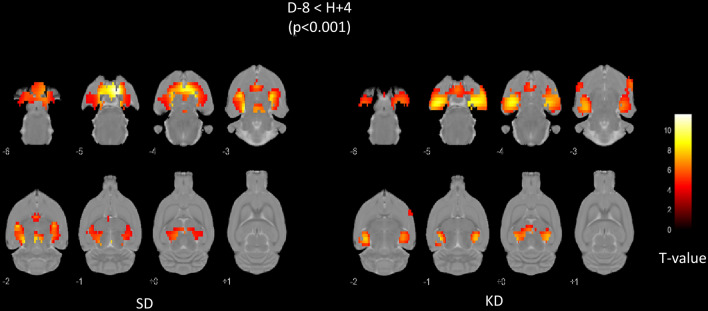
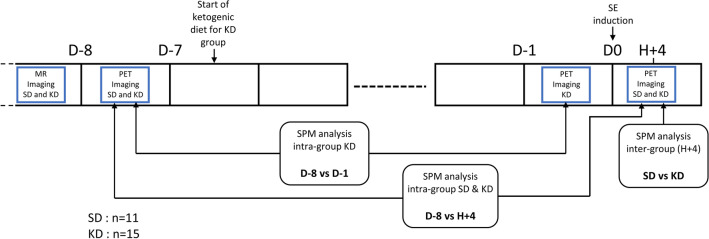
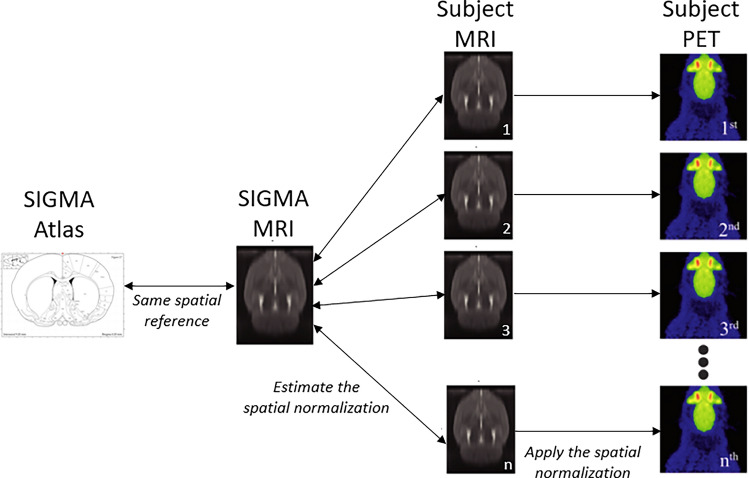
The ketogenic diet (KD) has been shown to be effective in refractory epilepsy after long-term administration. However, its interference with short-term brain metabolism and its involvement in the early process leading to epilepsy remain poorly understood. This study aimed to assess the effect of a short-term ketogenic diet on cerebral glucose metabolic changes, before and after status epilepticus (SE) in rats, by using [18F]-FDG PET. Thirty-nine rats were subjected to a one-week KD (KD-rats, n = 24) or to a standard diet (SD-rats, n = 15) before the induction of a status epilepticus (SE) by lithium-pilocarpine administrations. Brain [18F]-FDG PET scans were performed before and 4 h after this induction. Morphological MRIs were acquired and used to spatially normalize the PET images which were then analyzed voxel-wisely using a statistical parametric-based method. Twenty-six rats were analyzed (KD-rats, n = 15; SD-rats, n = 11). The 7 days of the KD were associated with significant increases in the plasma β-hydroxybutyrate level, but with an unchanged glycemia. The PET images, recorded after the KD and before SE induction, showed an increased metabolism within sites involved in the appetitive behaviors: hypothalamic areas and periaqueductal gray, whereas no area of decreased metabolism was observed. At the 4th hour following the SE induction, large metabolism increases were observed in the KD- and SD-rats in areas known to be involved in the epileptogenesis process late-i.e., the hippocampus, parahippocampic, thalamic and hypothalamic areas, the periaqueductal gray, and the limbic structures (and in the motor cortex for the KD-rats only). However, no statistically significant difference was observed when comparing SD and KD groups at the 4th hour following the SE induction. A one-week ketogenic diet does not prevent the status epilepticus (SE) and associated metabolic brain abnormalities in the lithium-pilocarpine rat model. Further explorations are needed to determine whether a significant prevention could be achieved by more prolonged ketogenic diets and by testing this diet in less severe experimental models, and moreover, to analyze the diet effects on the later and chronic stages leading to epileptogenesis.
© 2024. The Author(s).
Conflict of interest statement
The authors declare no competing interests.
Figures
Similar articles
-
Ketogenic diet exhibits neuroprotective effects in hippocampus but fails to prevent epileptogenesis in the lithium-pilocarpine model of mesial temporal lobe epilepsy in adult rats.Epilepsia. 2010 Sep;51(9):1829-36. doi: 10.1111/j.1528-1167.2010.02667.x. Epub 2010 Jul 14. Epilepsia. 2010. PMID: 20633040
-
Ameliorating effect of ketogenic diet on acute status epilepticus: Insights into biochemical and histological changes in rat hippocampus.J Food Biochem. 2022 Sep;46(9):e14217. doi: 10.1111/jfbc.14217. Epub 2022 May 11. J Food Biochem. 2022. PMID: 35543175
-
A ketogenic diet did not prevent effects on the ectonucleotidases pathway promoted by lithium-pilocarpine-induced status epilepticus in rat hippocampus.Metab Brain Dis. 2012 Dec;27(4):471-8. doi: 10.1007/s11011-012-9333-7. Epub 2012 Sep 5. Metab Brain Dis. 2012. PMID: 22945235
-
Energy metabolism as part of the anticonvulsant mechanism of the ketogenic diet.Epilepsia. 2008 Nov;49 Suppl 8(Suppl 8):91-3. doi: 10.1111/j.1528-1167.2008.01846.x. Epilepsia. 2008. PMID: 19049599 Free PMC article. Review.
-
The role of ketogenic diets in the treatment of status epilepticus.Epilepsy Behav. 2024 Nov;160:110068. doi: 10.1016/j.yebeh.2024.110068. Epub 2024 Oct 9. Epilepsy Behav. 2024. PMID: 39388975 Review.
Cited by
-
Effects of the ketogenic diet on dentate gyrus and CA3 KCC2 expression in male rats with electrical amygdala kindling-induced seizures.Front Neurosci. 2025 Apr 8;19:1489407. doi: 10.3389/fnins.2025.1489407. eCollection 2025. Front Neurosci. 2025. PMID: 40264914 Free PMC article.
References
-
- French JA, et al. Characteristics of medial temporal lobe epilepsy: I. Results of history and physical examination. Ann. Neurol. 1993;34:774–780. - PubMed
-
- Verger A, et al. Temporal epilepsy lesions may be detected by the voxel-based quantitative analysis of brain FDG-PET images using an original block-matching normalization software. Ann. Nucl. Med. 2016;30:272–278. - PubMed
MeSH terms
Substances
LinkOut - more resources
Full Text Sources
