. 2024 Mar;56(3):371-376.
doi: 10.1038/s41588-024-01674-1. Epub 2024 Feb 29.

A combinatorial genetic strategy for exploring complex genotype-phenotype associations in cancer

Affiliations

A combinatorial genetic strategy for exploring complex genotype-phenotype associations in cancer

Shan Li et al. Nat Genet. 2024 Mar.

Abstract

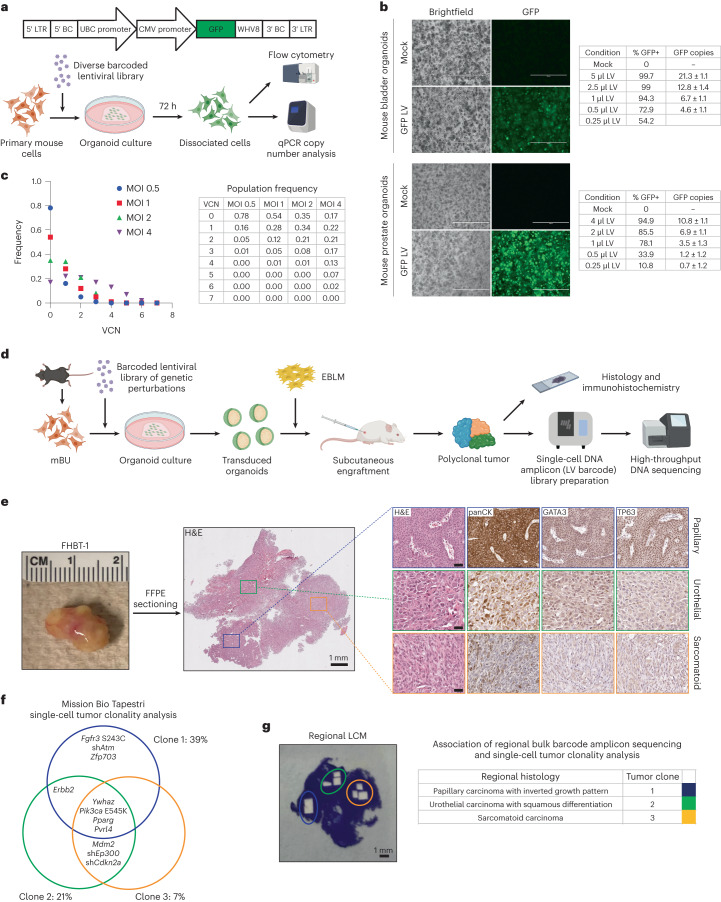
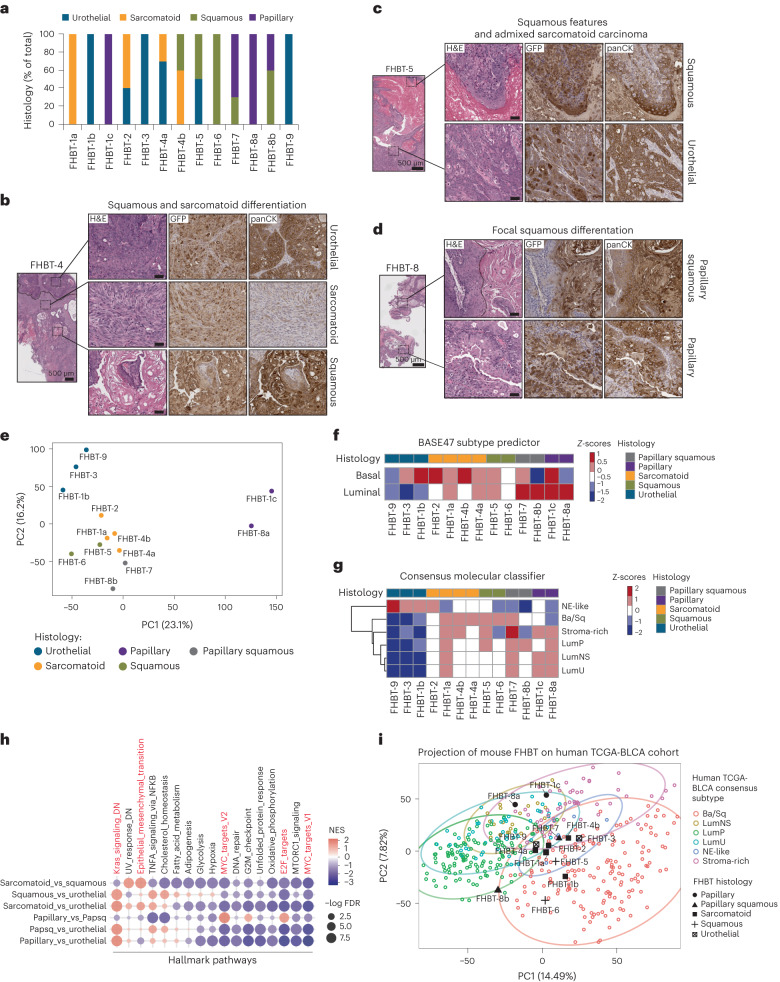
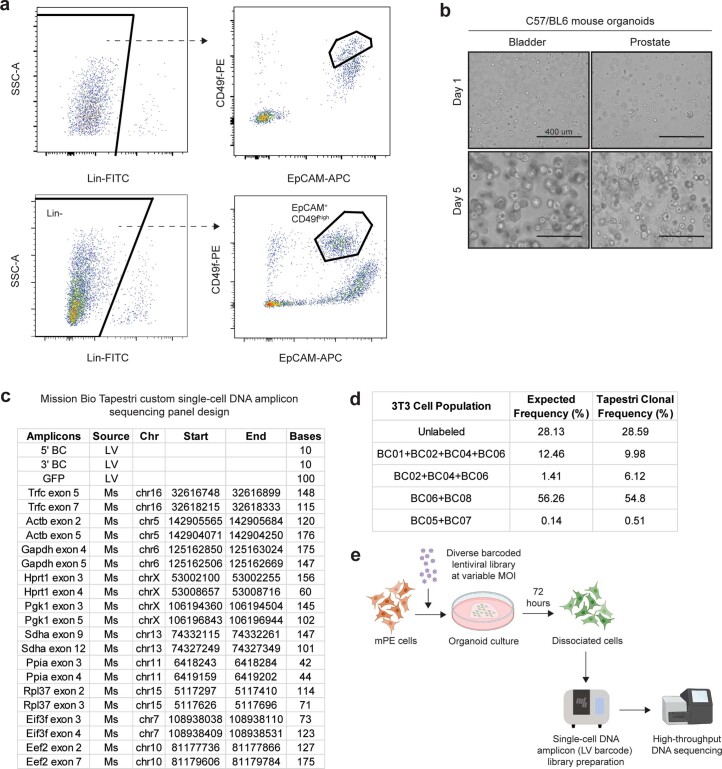
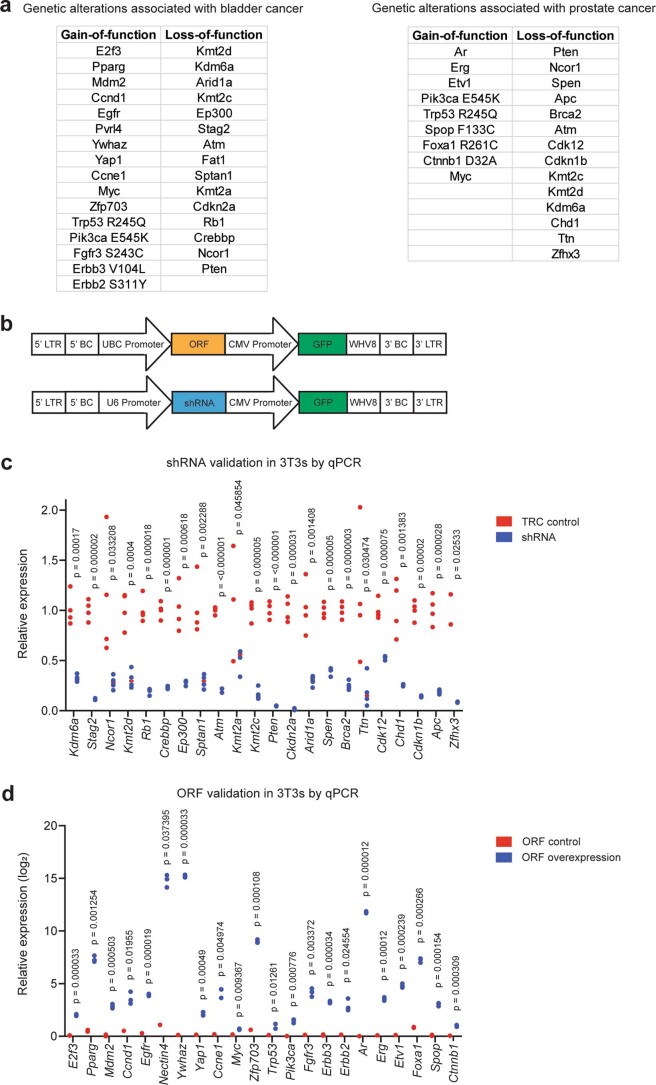
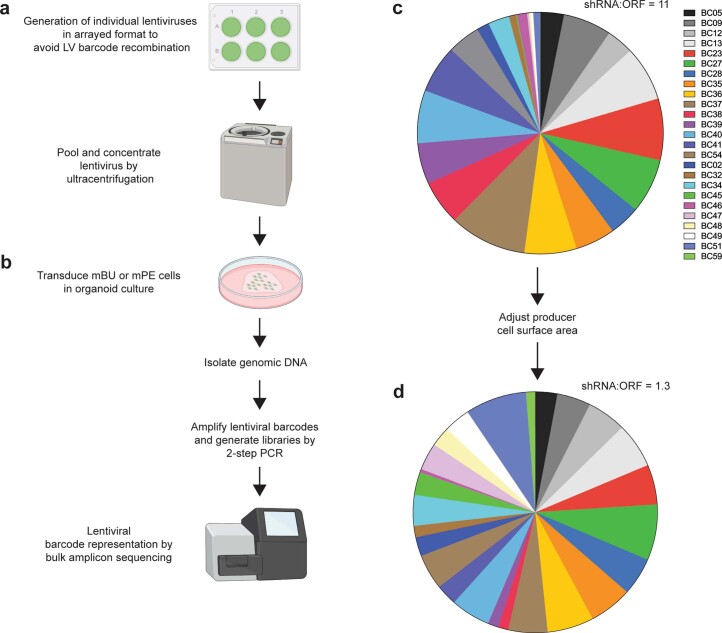
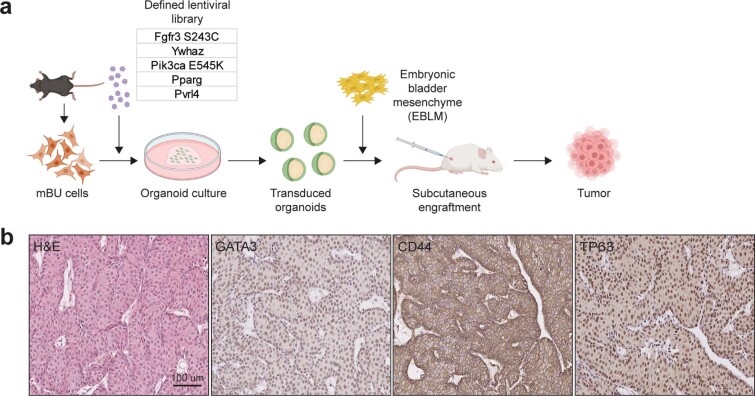
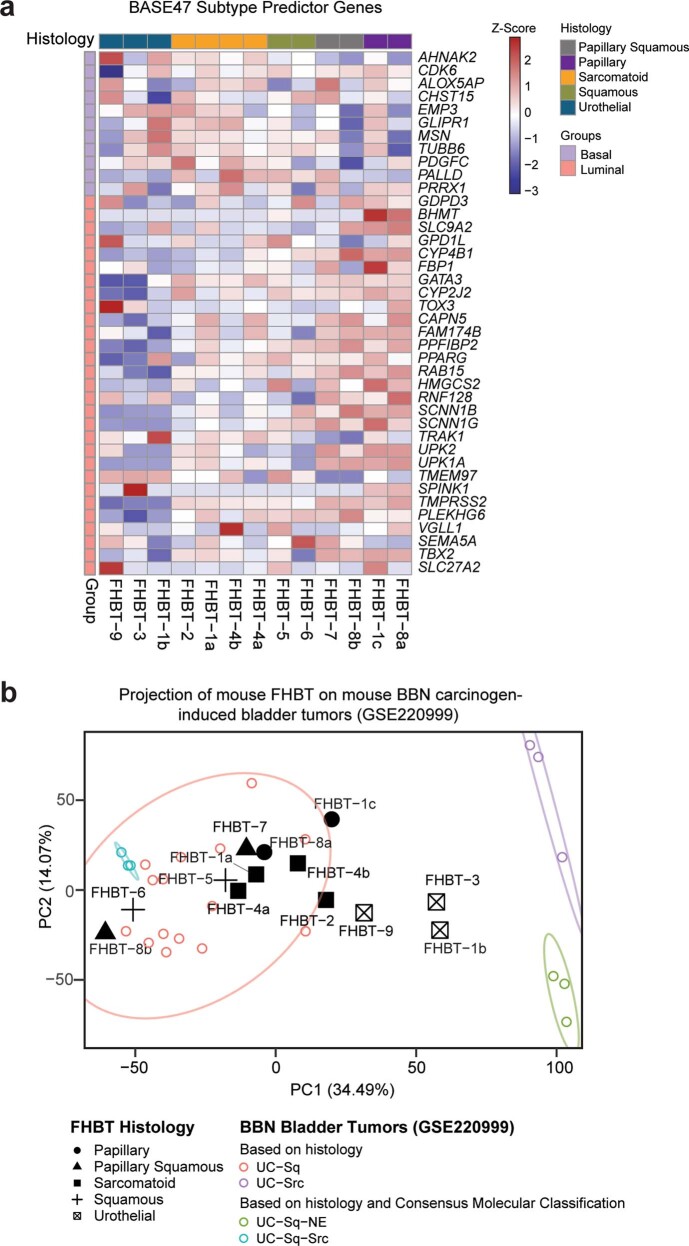
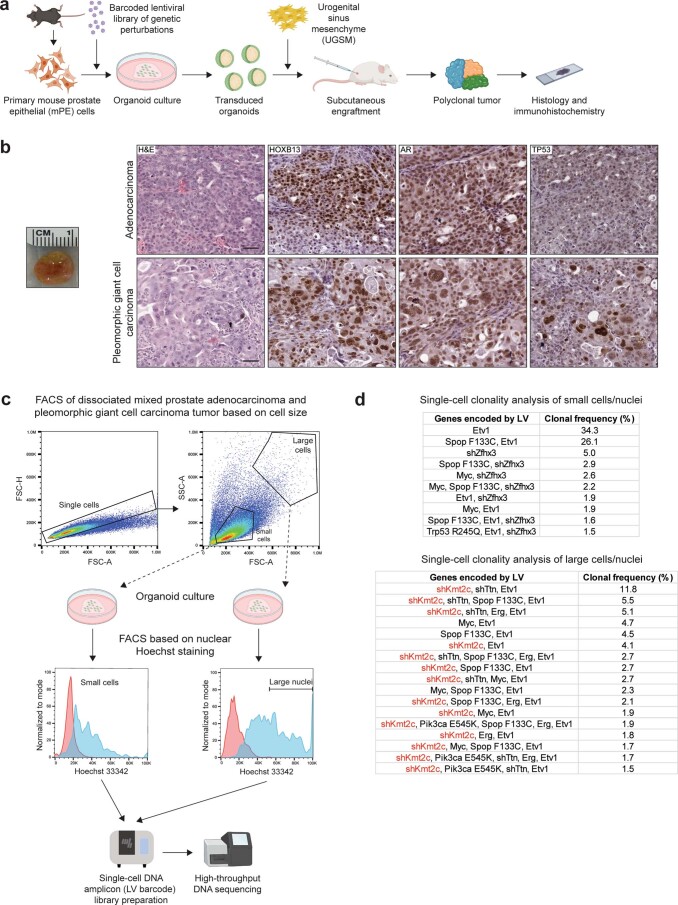
Available genetically defined cancer models are limited in genotypic and phenotypic complexity and underrepresent the heterogeneity of human cancer. Here, we describe a combinatorial genetic strategy applied to an organoid transformation assay to rapidly generate diverse, clinically relevant bladder and prostate cancer models. Importantly, the clonal architecture of the resultant tumors can be resolved using single-cell or spatially resolved next-generation sequencing to uncover polygenic drivers of cancer phenotypes.


Conflict of interest statement

J.K.L. served on the Speaker’s Bureau for Mission Bio. B.M.F. has consulting or advisory roles with QED Therapeutics, Boston Gene, Astrin Biosciences Merck, Immunomedics/Gilead, Guardant and Janssen and receives patent royalties from Immunomedics/Gilead and research support from Eli Lilly. All other authors declare no competing interests.

Figures

Fig. 1
Fig. 1. Efficient lentiviral transduction of primary epithelial cells at high multiplicity of infection and transformation of urothelial cells to tumors with mixed cancer histologies.
a, Top, schematic of a lentiviral (LV) construct with matching barcodes (BCs) at the 5′ and 3′ ends. Bottom, overview of experiments with LV infection of primary mouse cells in organoid culture and quantification of transduction. Created with BioRender.com. CMV, cytomegalovirus; UBC, ubiquitin C; WVH8, Woodchuck hepatitis virus 8 post-transcriptional regulatory element. b, Left, brightfield and GFP images of mouse bladder or prostate organoids 72 h after mock or GFP LV transduction. Scale bar, 400 µm. Right, tables summarizing quantification of LV transduction by flow cytometry and LV copies of GFP (± s.d.) by qPCR. c, Left, plot of the distribution of LV copies per mPE cell at different MOIs 72 h after transduction. Right, table summarizing viral copy number (VCN) population frequencies at varying MOIs. The experiment was independently repeated three times with similar results. d, Scheme of the mBU organoid transformation assay to uncover functional genotype–phenotype associations in bladder cancer. Created with BioRender.com. e, Left, gross image of a tumor arising from mBU transformed with a BU-LVP. Middle, low-magnification image of the hematoxylin and eosin (H&E)-stained tumor section. Right, high-magnification images of H&E-stained and immunohistochemically stained sections of regions with distinct histologies. Scale bars, 50 µm. Each FHBT model is a unique tumor that is the result of an independent experiment. f, Clonal architecture of the three dominant clones in the tumor as determined by Mission Bio Tapestri single-cell analysis of LV barcodes. g, Left, tumor tissue section after LCM of the histologically distinct regions. Right, table showing the associations between regional tumor histologies and clones in f based on LCM and bulk DNA amplicon sequencing of LV barcodes.
Fig. 2
Fig. 2. Rapid generation of a series of clinically relevant and phenotypically diverse bladder cancer models.
a, Bar graph showing the representation of cancer histologies present across a series of FHBTs generated using mBU transformed with BU-LVP. bd, Low-magnification and high-magnification images of H&E-stained sections and high-magnification images of immunohistochemically stained sections for GFP and panCK expression depicting high-grade urothelial carcinomas with mixed histologies present within the same tumor. Scale bars, 50 µm. Each FHBT model is a unique tumor that is the result of an independent experiment. e, PCA plot showing FHBT series color-coded on the basis of histology. Heatmaps showing the histologies of the FHBT series relative to basal and luminal signature scores for the BASE47 subtype predictor (f) and signature scores for the Consensus Molecular Classifier (g) assigned to neuroendocrine-like (NE-like), basal and/or squamous (Ba/Sq), stroma-rich, luminal papillary (LumP), luminal non-specified (LumNS) and luminal unstable (LumU) subtypes. h, Pre-ranked GSEA dotplot of hallmark pathways based on differentially expressed genes (false discovery rate < 0.001) in pairwise histology comparisons. i, PCA projection plot of FHBT samples over the TCGA-BLCA samples color-coded by Consensus Molecular Classification (Ba/Sq, LumNS, LumP, LumU, NE-like or stroma-rich) with 90% confidence ellipses shown.
Extended Data Fig. 1
Extended Data Fig. 1. Isolation of mouse bladder urothelial and prostate epithelial cells for organoid culture and design/validation of a custom Mission Bio Tapestri single-cell DNA amplicon sequencing panel.
(a) Representative flow cytometry plot for the isolation of mouse bladder urothelial (top) and prostate epithelial (bottom) from dissociated tissues based on a Lin-(CD45-CD31-Ter119-) EpCAM+CD49fhigh immunophenotype. (b) Images of organoid cultures of mouse bladder urothelial and prostate epithelial cells on day 1 and day 5 after seeding. (c) Table showing the amplicons represented in a custom Mission Bio Tapestri single-cell DNA amplicon sequencing panel. (d) Table showing results of a validation study where a defined mixture of 3T3 cells with an unlabeled population and others labeled with combinations of lentiviruses encoding distinct barcodes were analyzed using the Mission Bio Tapestri single-cell DNA amplicon sequencing panel to determine clonality. ~2,000 cells were analyzed. (e) Overview of experiments with infection of mouse prostate epithelial (mPE) cells with a diverse barcoded lentiviral library in organoid culture across a range of multiplicity-of-infection (MOI) and quantification of viral copy number per cell across the population by single-cell amplicon sequencing. Created with BioRender.com.
Extended Data Fig. 2
Extended Data Fig. 2. Recurrent genetic alterations associated with bladder and prostate cancer encoded in barcoded lentiviral libraries.
(a) Tables showing gain-of-function and loss-of-function genetic alterations associated with bladder and prostate cancer selected for representation in cancer-specific barcoded lentiviral libraries. (b) Schematics of barcoded lentiviral vectors expressing open reading frames (ORF) or short-hairpin RNA (shRNA). LTR = long terminal repeat; BC = barcode; UBC = Ubiquitin C; CMV = cytomegalovirus; GFP = green fluorescent protein; WHV8 = Woodchuck hepatitis virus 8 post-transcriptional regulatory element. (c) Plot showing relative expression of target genes as determined by quantitative polymerase chain reaction (qPCR) in 3T3 cells 72 hours after lentiviral transduction with pLKO.1-TRC control or pLKO.1 expressing select shRNA previously screened and selected for inclusion in the barcoded lentiviral libraries based on the extent of gene knockdown. qPCR reactions were performed on four biologically independent replicates. Statistical analysis was performed by two-tailed, unpaired t-test with p-values shown. (d) Plot showing relative overexpression of gain-of-function genes as determined by qPCR in 3T3 cells 72 hours after lentiviral transduction with barcoded ORF vectors. qPCR reactions were performed on three biologically independent replicates. Statistical analysis was performed by two-tailed, unpaired t-test with p-values shown.
Extended Data Fig. 3
Extended Data Fig. 3. Generation of barcoded lentiviral libraries and normalization of library representation.
Schema showing the (a) generation of individual lentiviruses from the library in arrayed format with subsequent pooling and concentration by ultracentrifugation and (b) transduction of respective mouse bladder urothelial (mBU) or prostate epithelial (mPE) cells in organoid culture with concentrated lentiviral libraries to determine lentiviral barcode representation by bulk amplicon sequencing of genomic DNA. Created with BioRender.com. (c) Representative distribution of barcoded lentiviruses within a library with skewed enrichment of shRNA relative to ORF lentiviruses. (d) Representative distribution of barcoded lentiviruses within a library after applying information from c to adjust producer cell surface area in a for the generation of the lentiviral library.
Extended Data Fig. 4
Extended Data Fig. 4. Active mutant Fgfr3 S243C cooperates with other oncogenic factors in mouse bladder urothelial cells to drive papillary urothelial carcinoma with inverted growth pattern.
(a) Scheme of the mBU organoid transformation assay using a defined lentiviral library to confirm functional genotype-phenotype associations. Created with BioRender.com. (b) High-magnification images of H&E- and IHC-stained sections of a resultant tumor of the experiment in a with histologic features consistent with papillary urothelial carcinoma with inverted growth pattern.
Extended Data Fig. 5
Extended Data Fig. 5. Frequencies of gene alterations represented in the bladder urothelial LV pool in human muscle-invasive bladder cancer.
Oncoprint from cBioPortal analysis of human muscle-invasive bladder cancers from The Cancer Genome Atlas bladder cancer (TCGA-BLCA) cohort showing select genes for which gain- or loss-of-function events were incorporated into the bladder urothelial LV pool.
Extended Data Fig. 6
Extended Data Fig. 6. FHBT models demonstrate diverse cancer histologies.
(ae) Low- and high-magnification images of H&E-stained sections and high-magnification images of IHC-stained sections for GFP and pan-cytokeratin (panCK) expression depicting characteristic histologies. Scale bars = 50 µm.
Extended Data Fig. 7
Extended Data Fig. 7. Phenotypic diversity and relevance of FHBT models.
(a) Heatmap showing the histologies of the Fred Hutch Bladder Tumor (FHBT) series relative to expressions of genes that constitute basal and luminal signatures for the BASE47 subtype predictor. (b) Principle component analysis (PCA) projection plot of FHBT samples over BBN carcinogen-induced mouse bladder tumors color-coded based on histology or histology and Consensus Molecular Classification (UC = urothelial carcinoma, Sq = squamous, Src = sarcomatoid, NE = neuroendocrine) with 90% confidence ellipses shown.
Extended Data Fig. 8
Extended Data Fig. 8. Association of adenocarcinoma with polymorphic giant cell carcinoma of the prostate with perturbation of Kmt2c.
(a) Scheme of the mouse prostate epithelial (mPE) organoid transformation assay to uncover functional genotype-phenotype associations in prostate cancer. Created with BioRender.com. (b) Left, Gross image of a tumor arising from mPE transformed with a prostate epithelial lentiviral pool (PE-LVp). Right, high-magnification images of H&E- and IHC-stained sections of regions with high-grade adenocarcinoma and pleomorphic giant cell carcinoma. Scale bar = 50 µm. (c) Overview of the experimental approach to enrich for prostate adenocarcinoma and pleomorphic giant cell carcinoma based on cell size and nuclear DNA content followed by single-cell lentiviral barcode enumeration. (d) Tables showing single-cell clonality analysis of: Top, tumor cells enriched for ‘small cells/nuclei.’ Bottom, tumor cells enriched for ‘large cells/nuclei.’ Highlighted in red is shKmt2c based on the enumeration of the associated lentiviral barcode. Created with BioRender.com.

Update of

Similar articles

Cited by

References

    1. Loeb LA, Loeb KR, Anderson JP. Multiple mutations and cancer. Proc. Natl Acad. Sci. USA. 2003;100:776–781. doi: 10.1073/pnas.0334858100. - DOI - PMC - PubMed
    1. Kretzschmar K, Clevers H. Organoids: modeling development and the stem cell niche in a dish. Dev. Cell. 2016;38:590–600. doi: 10.1016/j.devcel.2016.08.014. - DOI - PubMed
    1. Santos CP, et al. Urothelial organoids originating from Cd49fhigh mouse stem cells display Notch-dependent differentiation capacity. Nat. Commun. 2019;10:4407. doi: 10.1038/s41467-019-12307-1. - DOI - PMC - PubMed
    1. Drost J, et al. Organoid culture systems for prostate epithelial and cancer tissue. Nat. Protoc. 2016;11:347–358. doi: 10.1038/nprot.2016.006. - DOI - PMC - PubMed
    1. Robertson AG, et al. Comprehensive molecular characterization of muscle-invasive bladder cancer. Cell. 2017;171:540–556.e525. doi: 10.1016/j.cell.2017.09.007. - DOI - PMC - PubMed