. 2024 Feb 29;23(1):45.
doi: 10.1186/s12943-024-01936-w.

Targeted deletion of CD244 on monocytes promotes differentiation into anti-tumorigenic macrophages and potentiates PD-L1 blockade in melanoma

Affiliations

Targeted deletion of CD244 on monocytes promotes differentiation into anti-tumorigenic macrophages and potentiates PD-L1 blockade in melanoma

Jeongsoo Kim et al. Mol Cancer. .

Abstract

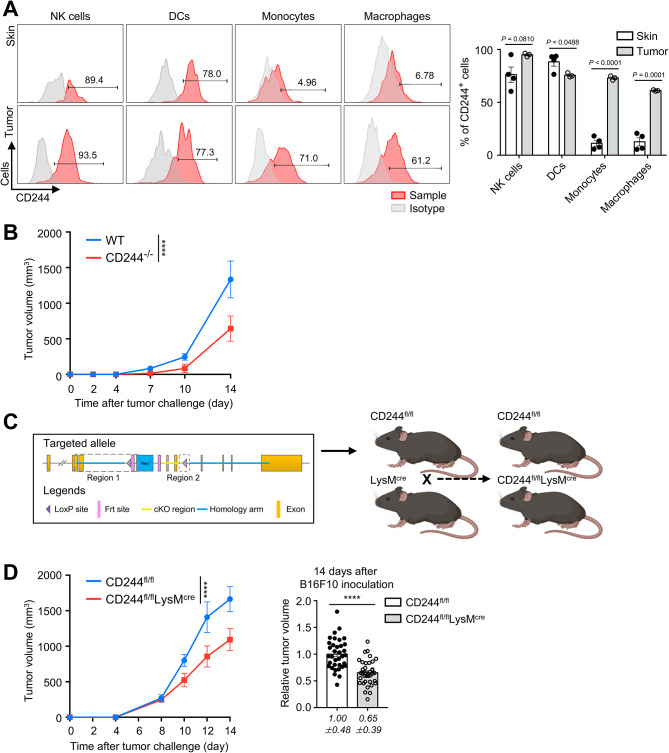
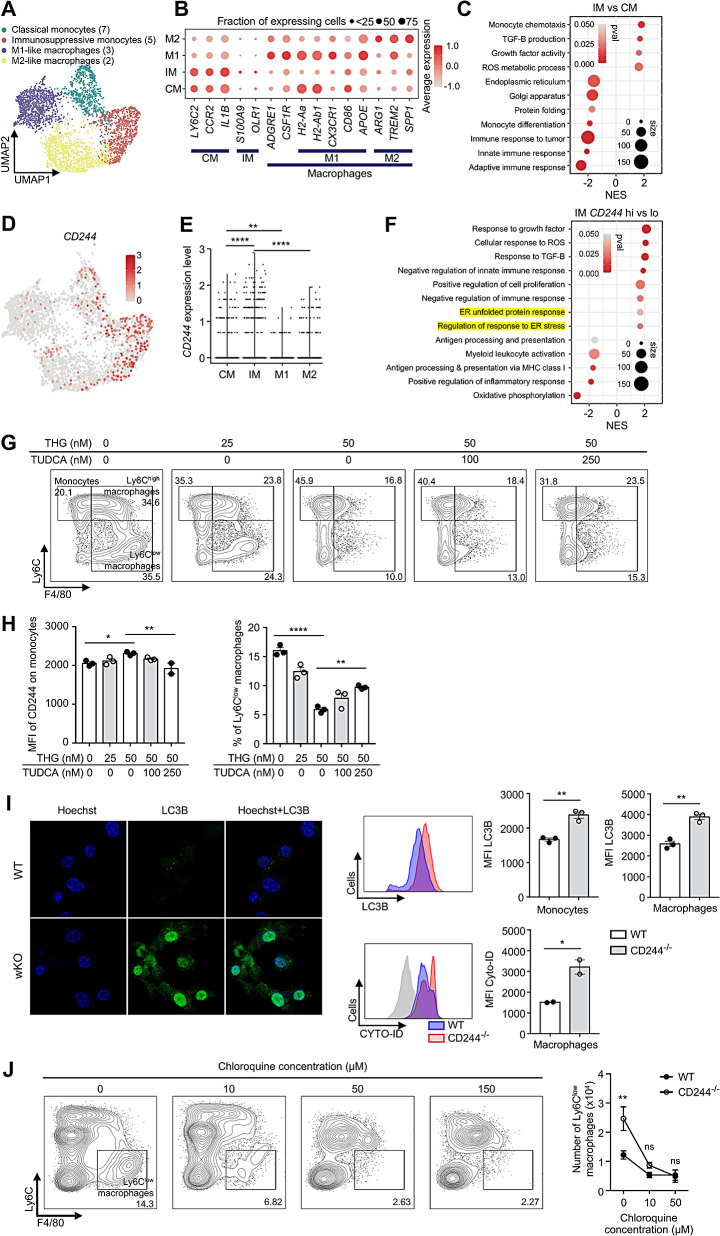
Background: In the myeloid compartment of the tumor microenvironment, CD244 signaling has been implicated in immunosuppressive phenotype of monocytes. However, the precise molecular mechanism and contribution of CD244 to tumor immunity in monocytes/macrophages remains elusive due to the co-existing lymphoid cells expressing CD244.

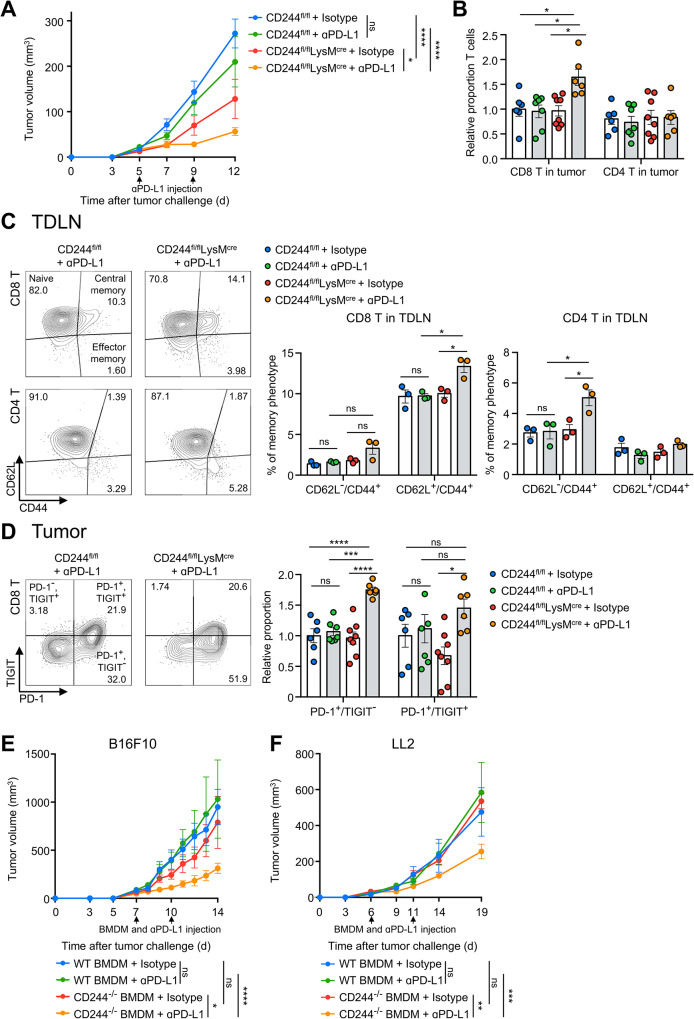
Methods: To directly assess the role of CD244 in tumor-associated macrophages, monocyte-lineage-specific CD244-deficient mice were generated using cre-lox recombination and challenged with B16F10 melanoma. The phenotype and function of tumor-infiltrating macrophages along with antigen-specific CD8 T cells were analyzed by flow cytometry and single cell RNA sequencing data analysis, and the molecular mechanism underlying anti-tumorigenic macrophage differentiation, antigen presentation, phagocytosis was investigated ex vivo. Finally, the clinical feasibility of CD244-negative monocytes as a therapeutic modality in melanoma was confirmed by adoptive transfer experiments.

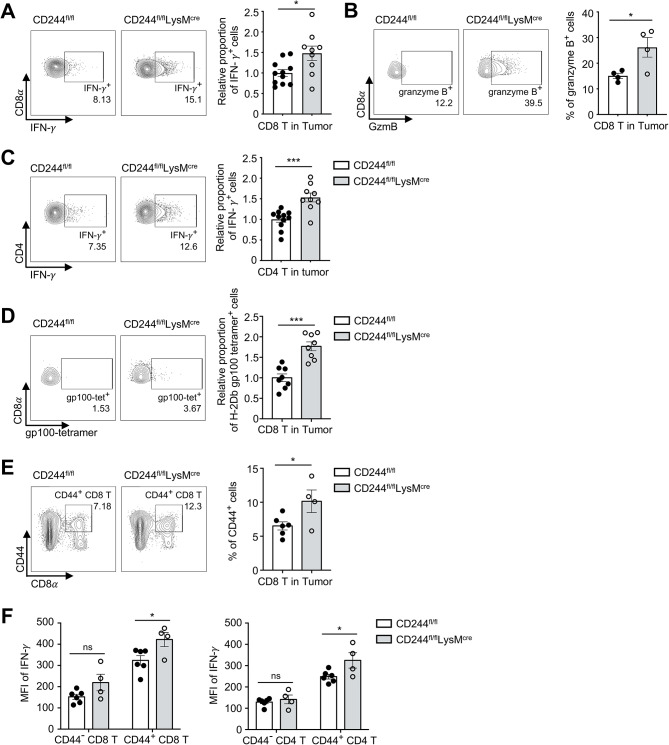
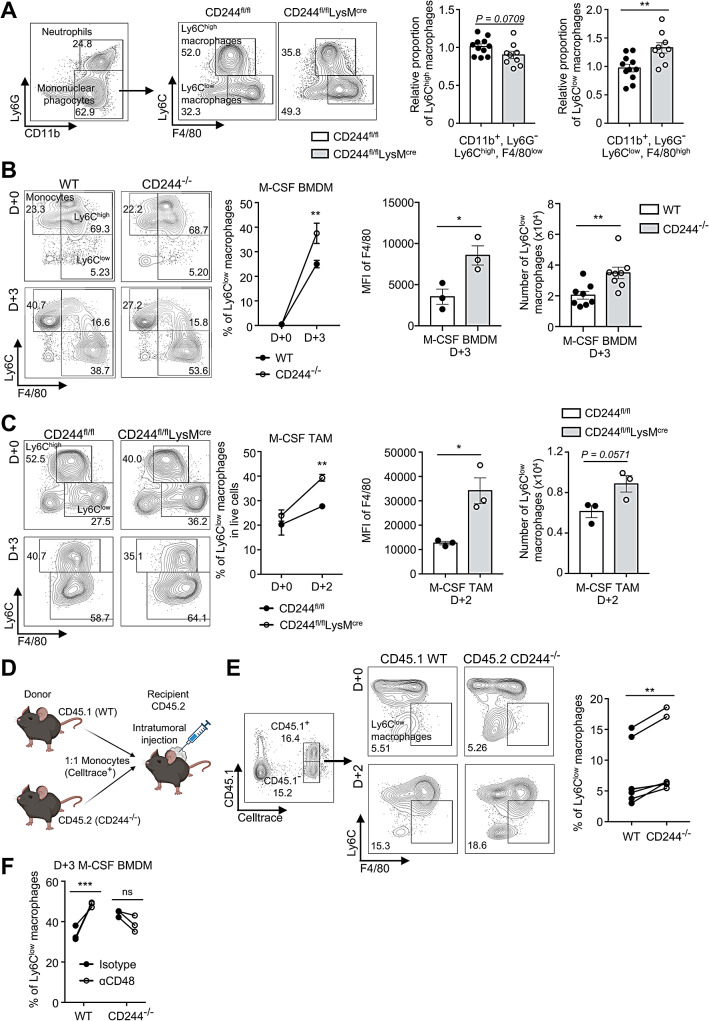
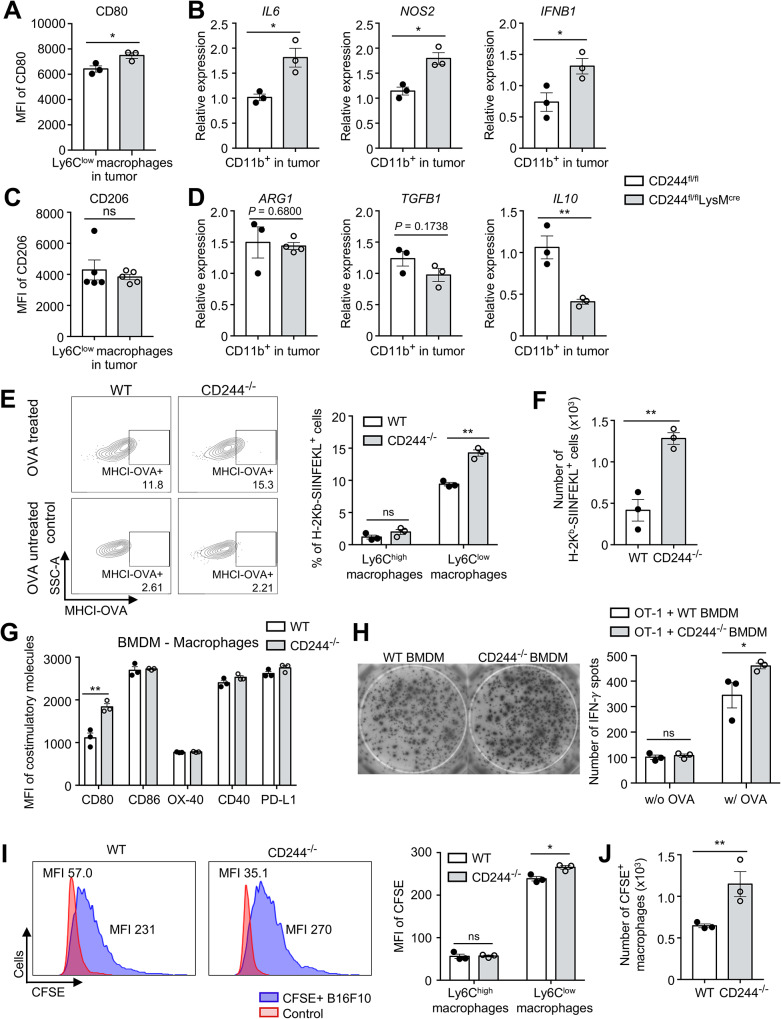
Results: CD244fl/flLysMcre mice demonstrated a significant reduction in tumor volume (61% relative to that of the CD244fl/fl control group) 14 days after tumor implantation. Within tumor mass, CD244fl/flLysMcre mice also showed higher percentages of Ly6Clow macrophages, along with elevated gp100+IFN-γ+ CD8 T cells. Flow cytometry and RNA sequencing data demonstrated that ER stress resulted in increased CD244 expression on monocytes. This, in turn, impeded the generation of anti-tumorigenic Ly6Clow macrophages, phagocytosis and MHC-I antigen presentation by suppressing autophagy pathways. Combining anti-PD-L1 antibody with CD244-/- bone marrow-derived macrophages markedly improved tumor rejection compared to the anti-PD-L1 antibody alone or in combination with wild-type macrophages. Consistent with the murine data, transcriptome analysis of human melanoma tissue single-cell RNA-sequencing dataset revealed close association between CD244 and the inhibition of macrophage maturation and function. Furthermore, the presence of CD244-negative monocytes/macrophages significantly increased patient survival in primary and metastatic tumors.

Conclusion: Our study highlights the novel role of CD244 on monocytes/macrophages in restraining anti-tumorigenic macrophage generation and tumor antigen-specific T cell response in melanoma. Importantly, our findings suggest that CD244-deficient macrophages could potentially be used as a therapeutic agent in combination with immune checkpoint inhibitors. Furthermore, CD244 expression in monocyte-lineage cells serve as a prognostic marker in cancer patients.

Keywords: CD244; Differentiation; Immune checkpoint blockade; Macrophage-based cell therapy; Macrophages; Melanoma.


Conflict of interest statement

JSK and KML are named inventors on a patent for a pharmaceutical composition to prevent or treat cancer-comprising monocytes or macrophages that inhibit CD244 expression or activity as an active ingredient (KR10-2022-0067313, PCT/KR2023/007574).

Figures

Fig. 1
Fig. 1
The lack of CD244 in monocytes inhibited melanoma tumorigenesis. (A, B, D) 1 × 106 of B16F10 cells were subcutaneously inoculated into the right flank of mice. (A) CD244 expression in NK cells, DCs, monocytes and macrophages in the skin of WT naïve mice and within the B16F10 tumor mass of WT tumor-bearing mice, 14 days after tumor inoculation, was analyzed using flow cytometry. The skin samples were derived from mice that did not undergo tumor inoculation and obtained from the identical location as the tumor site in mice subjected to tumor inoculation. Representative histograms (left) display surface CD244 expression on NK cells, DCs, monocytes and macrophages from the skin (top) and the tumor (bottom). The percentages of CD244-expressing cells in NK cells, DCs, monocytes and macrophages from both skin and tumor are presented as a bar graph (right). (B) Tumor growth in WT and CD244−/− mice is depicted (n = 4 in each group). (C) The process for generating littermate CD244fl/fl and CD244fl/flLysMcre mice is illustrated. (D) B16F10 tumor growth in littermate CD244fl/fl and CD244fl/flLysMcre mice is shown (n = 4 in each group) (left). The relative tumor volume on 14 days after tumor inoculation (n (number of samples) = 35 of CD244fl/fl and 36 of CD244fl/flLysMcre mice) (right). Significance was indicated as ****P < 0.0001, and the statistical analysis was performed using two-way ANOVA (B, D (left)) or unpaired Student’s t-test (A, D (right)). Data are representative of two (A), three (B) or nine (D (left)) or compiled from nine (D (right)) independent experiments
Fig. 2
Fig. 2
The deletion of CD244 on monocyte-lineage cells enhanced IFN-γ secretion from antigen-specific T cells. (A-E) The CD45+ cell population infiltrating the tumor was isolated using magnetic sorting and subjected to flow cytometry analysis 14 days after inoculating 1 × 106 B16F10 cells into CD244fl/fl and CD244fl/flLysMcre mice. IFN-γ and granzyme-B expression were measured after 16 h co-culture with γ-irradiated B16F10 cells. Expression of IFN-γ (A) and granzyme-B (B) in CD8 T cells, as well as IFN-γ expression in CD4 T cells (C), gp100-specific TCR (D), CD44 (E) expression in CD8 T cells and IFN-γ expression in CD44 and CD44+ CD8 T cells (left) and CD4 T cells (right) (F) were shown. *P < 0.05; ***P < 0.001; unpaired Student’s t-test. Data are representative of two (B, E, F) or compiled from two (A, C, D) independent experiments
Fig. 3
Fig. 3
The lack of CD244 led to an increase in M1 macrophage populations. (A) After inoculating B16F10 cells into CD244fl/fl and CD244fl/flLysMcre mice, the percentage of Ly6Chigh macrophages (CD11b+Ly6GLy6ChighF4/80low) and Ly6Clow macrophages (CD11b+Ly6GLy6ClowF4/80high) within tumor was assessed 14 days later. Representative flow cytometry plots (left) and relative proportion of Ly6Chigh macrophages (middle) and Ly6Clow macrophages (right) in CD45+ cells were shown. (B-C) Bone marrow cells (B) or tumor-infiltrating CD11b+ cells (C) were cultured with M-CSF for 3 days. Presented are a representative flow cytometry plot (1st), proportion of Ly6Clow macrophages (2nd), Mean fluorescence intensity (MFI) of F4/80 (3rd) and absolute Ly6Clow macrophage count (4th). (D-E) Monocytes were isolated from bone marrow of CD45.1 WT and CD45.2 CD244−/− mice, stained with CellTrace Far Red (CTFR), and mixed in a 1:1 ratio. This monocyte mixture was then injected directly into B16F10 tumor mass of WT CD45.2 recipient mice. Tumors were harvested after 48 h, and the ratio of CTFR+ CD45.1 and CD45.2 Ly6Clow macrophages was determined. (D) Schematic representation of in vivo differentiation experiment. (E) Demonstrated are a representative flow cytometry plots (left) and the proportion (right) of CTFR+ CD45.1 and CD45.2 Ly6Clow macrophages within tumors. (F) WT and CD244−/− bone marrow cells were cultured for 72 h with M-CSF and treated either with an isotype control or an anti-CD48 antibody. The proportion of Ly6Clow macrophages was determined and presented. *P < 0.05; **P < 0.01; ***P < 0.001; ns, not significant; unpaired Student’s t-test (A, B, C) or two-way ANOVA (B, C) or paired Student’s t-test (E, F). Data are representative of three (B, C) or two (E, F) or compiled from three (A) independent experiments
Fig. 4
Fig. 4
The deletion of CD244 on monocyte-lineage cells enhances antigen presentation and phagocytosis. (A-D) The population of tumor-infiltrating CD11b+ cells was isolated using magnetic sorting, and the expression of anti/pro-tumorigenic macrophage markers was evaluated using flow cytometry and real-time quantitative PCR. (A) MFI of CD80 in macrophages. (B) Relative mRNA expression level of anti-tumorigenic macrophage markers (IL6, NOS2, IFNB1). (C) MFI of CD206 in macrophages. (D) Relative mRNA expression level of pro-tumorigenic macrophage markers (ARG1, TGFB1, IL10). (E-F) Bone marrow cells were cultured with M-CSF and whole OVA protein. OVA presentation via MHC-I was measured using anti-H-2 kb-SIINFEKL antibody on day 3. Demonstrated are representative flow cytometry plots (left), proportion (right) (E) and absolute number (F) of MHC-I-OVA complex expressing cells in WT and CD244−/− BMDMs. (G) MFI of costimulatory molecules (CD80, CD86, OX-40, CD40, and PD-L1) on WT and CD244−/− BMDM on day 3. (H) Differentiated BMDMs and OT-1 cells were co-cultured for 48 h with whole OVA protein. Representative photographs (left) and the number of IFN-γ spots (right) were counted for OT-1 cells co-cultured with either WT or CD244−/− BMDMs. (I-J) Differentiated BMDMs were co-cultured with CFSE-stained B16F10 cells, and phagocytic activity was assessed 24 h later by measuring CFSE fluorescence in macrophages. Presented are representative flow cytometry plots (left) and MFI of CFSE (right) in monocytes and macrophages (I) and the absolute number of CFSE+ macrophages (J) from WT and CD244−/− BMDMs. *P < 0.05; **P < 0.01; ns, not significant; unpaired Student’s t-test. Data are representative of two (A-D, G, H) or three (E, F, I, J) independent experiments
Fig. 5
Fig. 5
The expression of CD244 is increased in response to endoplasmic reticulum (ER) stress in immature monocytes. (A-F) The single cell RNA sequencing (scRNA-seq) data (GSE121861) was downloaded and re-analyzed. GSE121861 contained scRNA-seq data of 6 syngeneic mice tumor model (CT-26, EMT-6 : BALB/C; MC-38, LL2, B16F10 : C57B6/J; Sa1N : A/J). Each mouse tumor was harvested when it reached 100–200 mm. (A) Uniform manifold approximation and projection (UMAP) plot showing 4 clusters of myeloid cells among total 16 clusters containing 3 lymphoid [11, 13, 15] and 4 myeloid [2, 3, 5, 7] clusters, cancer associated fibroblasts (CAF), and tumor cells (CT26, LL2, MC-38, Sa1N, B16F10 and EMT-6). (B) The dotplot illustrated markers for classical monocytes (CM), immunosuppressive monocytes (IM), M1-like macrophages (M1), and M2-like macrophages (M2). (C) Gene set enrichment analysis (GSEA) result predicted from differentially expressed genes (DEGs) of IM compared to CM. (D) The UMAP plot depicted CD244 expression in 4 monocyte-lineage cell clusters. (E) A graph presented CD244 expression levels on CM, IM, M1, and M2. (F) GSEA result was predicted from DEGs of CD244-high IMs compared to CD244-low IMs. (G-H) Thapsigargin (THG) and Taurosodeoxycholic acid (TUDCA), an inducer and an inhibitor of ER stress, were administered to BMDMs along with M-CSF, and the cells were cultured for 3 days. (G) Representative flow cytometry plots displayed the monocyte and macrophage populations. (H) MFI of CD244 in monocytes (left) and the proportion of macrophages (right) were evaluated after treatment with THG alone or co-treatment with THG and TUDCA. (I) WT and CD244−/− BMDMs were stained with Hoechst 33,342 and rabbit anti-mouse LC3B antibody, followed by a secondary anti-rabbit IgG-AlexaFlour555 antibody. LC3B expression on BMDMs was assessed using Immunofluorescence (left) and flow cytometry (right; top). Autophagosome formation in WT and CD244−/− BMDMs was measured by Cyto-ID staining (right; bottom). (J) BMDMs were treated with chloroquine, an inhibitor of autophagolysosome formation, and M-CSF and cultured for 3 days. Representative flow cytometry plots demonstrated changes in the monocyte/macrophage population (left) and the number of macrophages (right). *P < 0.05; **P < 0.01; ***P < 0.001; ****P < 0.0001; one-way ANOVA (E, H) or unpaired Student’s t-test (I) or two-way ANOVA (J). The data represent two (G-J) independent experiments
Fig. 6
Fig. 6
Macrophages lacking CD244 significantly delay tumor growth by increasing memory T cell populations when combined with anti-PD-L1 antibody. (A to D) CD244fl/fl and CD244fl/flLysMcre mice were administered either anti-PD-L1 antibody or the corresponding isotype antibody on 5 and 9 days following B16F10 injection. Analysis of CD8 and CD4 T cells from both the tumor and tumor-draining lymph nodes (TDLN) was conducted 12 days after tumor inoculation. (A) A graph of B16F10 tumor growth. (B) Relative proportion of CD8 and CD4 T cells within the tumor. (C) Illustrated are a representative flow cytometry plots (left), proportion of effector memory (CD62LCD44+) and central memory (CD62L+CD44+) CD8 (middle) and CD4 (right) T cells in the TDLN. (D) Representative flow cytometry plots (left), proportion of PD-1+TIGIT and PD-1+TIGIT+ cells among total CD8 T cells in the tumor. (E, F) After tumor inoculation, WT mice were co-administered twice with either WT or CD244−/− BMDMs, along with either isotype antibody or anti-PD-L1 antibody. The growth of B16F10 (E) and LL2 (F) tumors was observed and evaluated in these mice. *P < 0.05; **P < 0.01; ***P < 0.001; ****P < 0.0001; ns, not significant; two-way ANOVA (A, E, F) or one-way ANOVA (B-D). The data represents two (A, C, E, F) and compiled from two (B, D) independent experiments
Fig. 7
Fig. 7
Single-cell RNA sequencing (scRNA-seq) data combined with deconvolution analysis unveil that CD244 plays a role in determining the destiny of monocytes/macrophages differentiation and influences melanoma patient survival. The scRNA-seq data of 16,291 immune cells from 48 tumor samples of melanoma patients treated with checkpoint inhibitors (GSE120575) was downloaded and subjected to re-analysis. (A) UMAP plot showing seven subclusters (C0–6) of monocytes/macrophages identified from scRNA-seq data. (B) UMAP plot showing CD244-expressing monocytes/macrophages (left) and CD244 expression levels in three cell groups (C0–1, C2–3 and C4–6) (right). (C) Heatmap showing DEGs between CD244+ and CD244 monocytes/macrophages in C0–1. (D) Cellular pathways enriched by 221 genes upregulated in CD244 monocytes/macrophages. (E) The expression of genes preferentially involved in the innate immune response, phagosome/antigen presentation, and autophagy was assessed in CD244+ and CD244 monocytes/macrophages (F) A schematic representation is provided to illustrate the classification of patients based on the expression level of CD244 in monocytes/macrophages (left). The UMAP plot demonstrates the distribution of CD8 T cells among patients classified as CD244 low and high, based on the expression levels of monocytes/macrophages (right). (G) Cellular pathways enriched by the genes upregulated in CD8 T cells of CD244 low patients (based on monocytes/macrophages); presented as –log10 (P-value). (H) Genes predominantly upregulated in C2–3, C4–6, CD244+ and CD244 monocytes/macrophages in the C0–1. (I) DEGs in C2–3, C4–6 and CD244+ and CD244 within the C0–1 were deconvoluted to TCGA-SKCM bulk RNA-seq data. The estimated survival of patients was analyzed based on the presence or absence of CD244-negative monocytes/macrophages. The overall survival of patients with primary tumors (left) or metastatic tumors (right) was assessed. ***P < 0.001; one-way ANOVA (B) or Kaplan–Meier (log rank) test (G)

References

    1. Lee KM, Chuang E, Griffin M, Khattri R, Hong DK, Zhang WG, et al. Molecular basis of T cell inactivation by CTLA-4. Science. 1998;282(5397):2263–6. - PubMed
    1. Cai GF, Freeman GJ. The CD160, BTLA, LIGHT/HVEM pathway: a bidirectional switch regulating T-cell activation. Immunol Rev. 2009;229:244–58. - PubMed
    1. Boussiotis VA. Molecular and biochemical aspects of the PD-1 checkpoint pathway. N Engl J Med. 2016;375(18):1767–78. - PMC - PubMed
    1. Anderson AC, Joller N, Kuchroo VK, Lag-3. Tim-3, and TIGIT: co-inhibitory receptors with Specialized functions in Immune Regulation. Immunity. 2016;44(5):989–1004. - PMC - PubMed
    1. Calabro L, Danielli R, Sigalotti L, Maio M. Clinical studies with Anti-CTLA-4 antibodies in non-melanoma indications. Semin Oncol. 2010;37(5):460–7. - PubMed

Publication types

Substances

Associated data