. 2024 Mar 1;43(1):65.
doi: 10.1186/s13046-024-02987-z.

Tight junction protein cingulin variant is associated with cancer susceptibility by overexpressed IQGAP1 and Rac1-dependent epithelial-mesenchymal transition

Affiliations

Tight junction protein cingulin variant is associated with cancer susceptibility by overexpressed IQGAP1 and Rac1-dependent epithelial-mesenchymal transition

Yi-Ting Huang et al. J Exp Clin Cancer Res. .

Abstract

Background: Cingulin (CGN) is a pivotal cytoskeletal adaptor protein located at tight junctions. This study investigates the link between CGN mutation and increased cancer susceptibility through genetic and mechanistic analyses and proposes a potential targeted therapeutic approach.

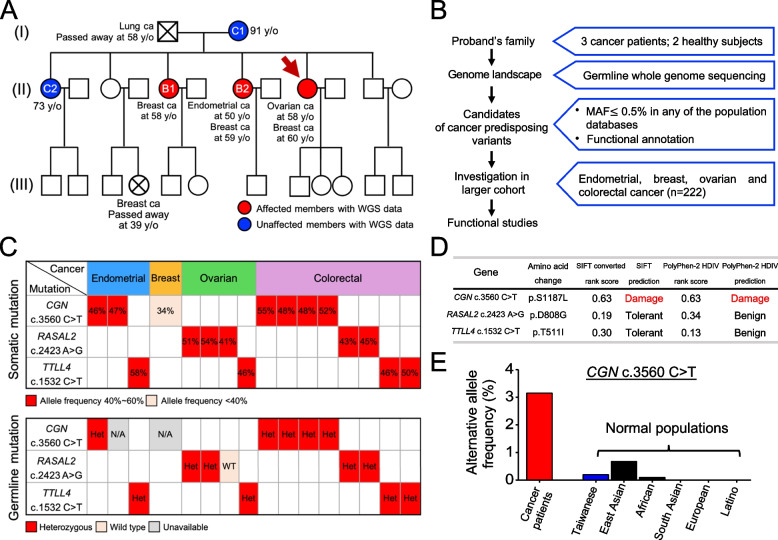
Methods: In a high-cancer-density family without known pathogenic variants, we performed tumor-targeted and germline whole-genome sequencing to identify novel cancer-associated variants. Subsequently, these variants were validated in a 222 cancer patient cohort, and CGN c.3560C > T was identified as a potential cancer-risk allele. Both wild-type (WT) (c.3560C > C) and variant (c.3560C > T) were transfected into cancer cell lines and incorporated into orthotopic xenograft mice model for evaluating their effects on cancer progression. Western blot, immunofluorescence analysis, migration and invasion assays, two-dimensional gel electrophoresis with mass spectrometry, immunoprecipitation assays, and siRNA applications were used to explore the biological consequence of CGN c.3560C > T.

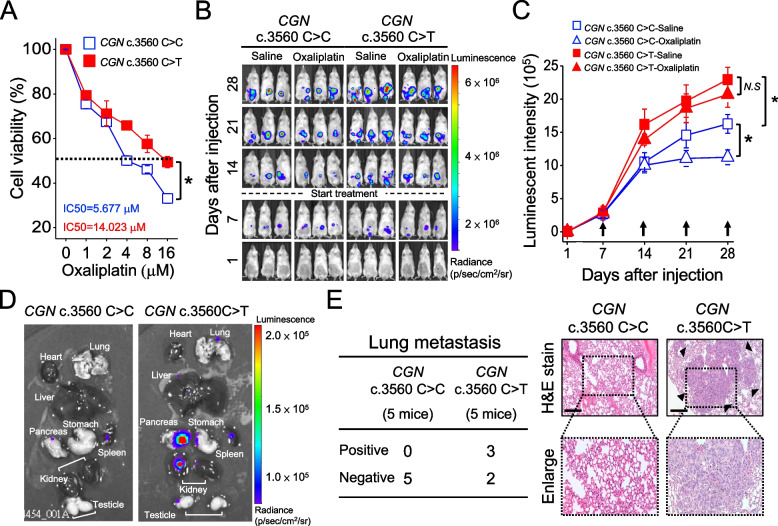
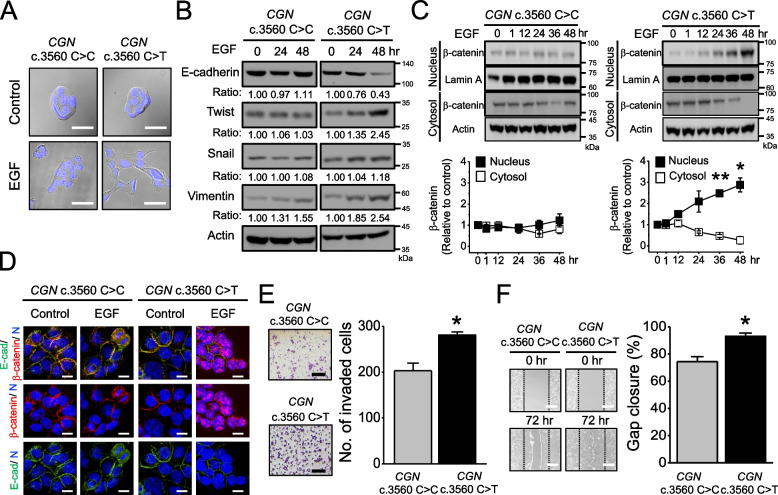
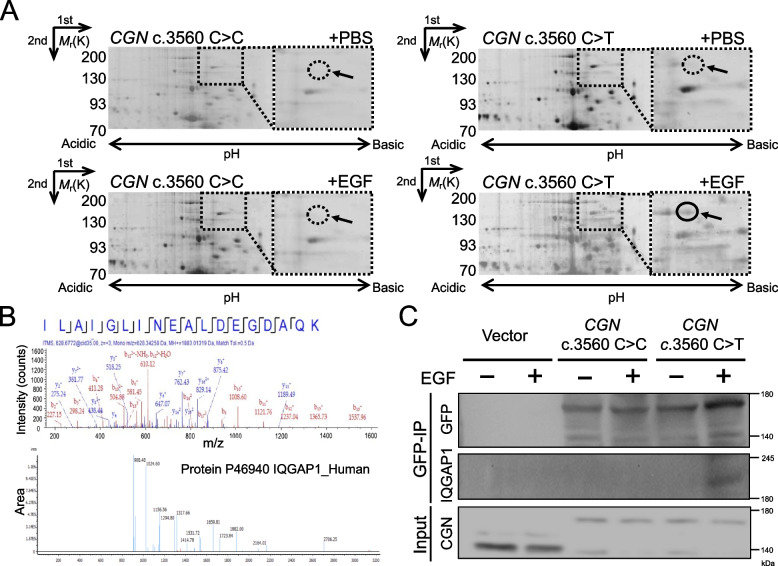
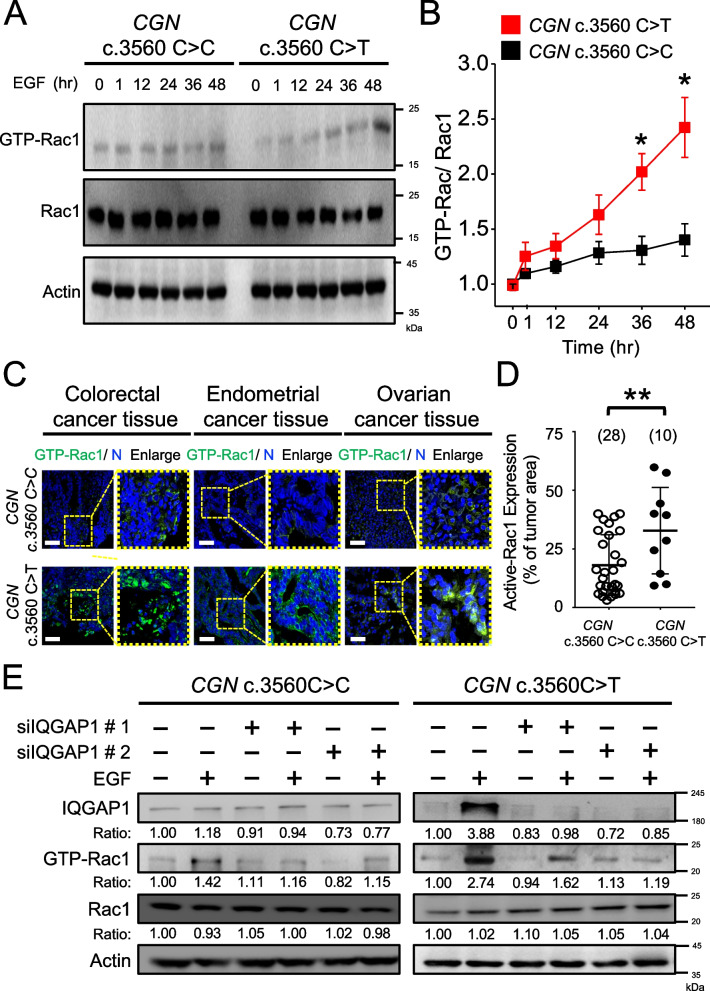
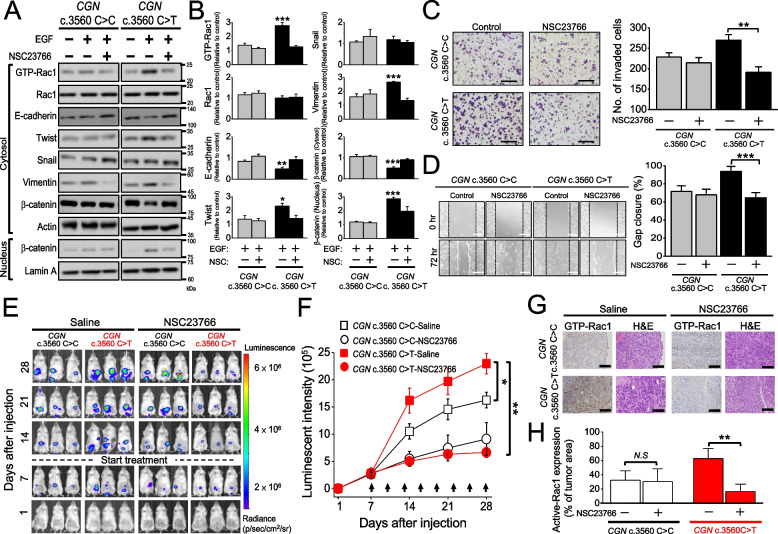
Results: In cancer cell lines and orthotopic animal models, CGN c.3560C > T enhanced tumor progression with reduced sensitivity to oxaliplatin compared to the CGN WT. The variant induced downregulation of epithelial marker, upregulation of mesenchymal marker and transcription factor, which converged to initiate epithelial-mesenchymal transition (EMT). Proteomic analysis was conducted to investigate the elements driving EMT in CGN c.3560C > T. This exploration unveiled overexpression of IQGAP1 induced by the variant, contrasting the levels observed in CGN WT. Immunoprecipitation assay confirmed a direct interaction between CGN and IQGAP1. IQGAP1 functions as a regulator of multiple GTPases, particularly the Rho family. This overexpressed IQGAP1 was consistently associated with the activation of Rac1, as evidenced by the analysis of the cancer cell line and clinical sample harboring CGN c.3560C > T. Notably, activated Rac1 was suppressed following the downregulation of IQGAP1 by siRNA. Treatment with NSC23766, a selective inhibitor for Rac1-GEF interaction, resulted in the inactivation of Rac1. This intervention mitigated the EMT program in cancer cells carrying CGN c.3560C > T. Consistently, xenograft tumors with WT CGN showed no sensitivity to NSC23766 treatment, but NSC23766 demonstrated the capacity to attenuate tumor growth harboring c.3560C > T.

Conclusions: CGN c.3560C > T leads to IQGAP1 overexpression, subsequently triggering Rac1-dependent EMT. Targeting activated Rac1 is a strategy to impede the advancement of cancers carrying this specific variant.

Keywords: Cancer-predisposing variant; Cingulin; Epithelial-mesenchymal transition; IQGAP1; Rac1.


Conflict of interest statement

The authors declare that they have no conflict of interest.

Figures

Fig. 1
Fig. 1
Identification of cancer-predisposing variants from the proband’s family. A, The pedigree of the proband. The proband is indicated by the arrow. Deceased individuals are marked with a cross. Shape symbols indicated sex: square for males and circle for females. B, The workflow for identifying germline cancer predisposition variants is composed of candidate variant selection, validation with cancer patient cohort, and functional studies. C, The germline and somatic mutational pattern of CGN c.3560C > T, RASAL2 c.2423A > G, and TTLL4 c.1532C > T in 16 patients from the validation cohort. D, The functional prediction of CGN c.3560C > T, RASAL2 c.2423A > G, and TTLL4 c.1532C > T based on SIFT and PolyPhen-2. E, The allele frequency of CGN c.3560C > T was compared across multiple cohorts, including the cancer patient cohort, normal Taiwanese population, and various ethnic groups enlisted in the Genome Aggregation Database (gnomAD). MAF, minor allelic frequency; Ca, cancer; Het, heterozygous; N/A, non-available; WT, wild-type; T, tolerated; D, damaging; B, benign
Fig. 2
Fig. 2
CGN c.3560C > T leads to oxaliplatin resistance in cancer cells. A, Dyk-CGN c.3560 C > C or c.3560C > T were transient transfection in HT-29 cells and treated with different concentrations of oxaliplatin (0 μM, 1 μM, 2 μM, 4 μM, 8 μM, and 16 μM) for 24 h for the MTT assay. The IC50 values of oxaliplatin in HT-29 cells were measured by MTT assay. Value, mean ± SEM from analysis of three different clones. B, Representative images showing tumor growth in Luc-CGN c.3560 C > C and c.3560C > T HT-29 orthotopic xenograft tumor receiving saline and oxaliplatin treatment were assessed by IVIS system. Mice were repeatedly imaged until week four after inoculation to record luminescence signals. The data were shown as radiance (photons/ sec/ cm2/ steradian) with a color bar. C, Quantitative analysis of luminescence intensity from each tumor. Mice were analyzed by optical bioluminescence imaging at 1, 7, 14, 21, and 28 days after cancer cell injection. Arrows indicate the treatment time points. Value, mean ± SEM, n = 6 in each group. D, Luciferase bioluminescence signal detection of various organs. E, (Upper) The frequencies of pulmonary metastasis were assessed in mice carrying Luc-CGN 3560 C > C or c.3560C > T HT-29 xenograft tumors at the 28th days after injection. Metastasis frequencies based on the number of mice were shown. (Lower) H&E staining results of lung tissues in CGN c.3560 C > C group and CGN c.3560 C > T group. Melanoma foci formed in the lungs were observed in CGN c.3560 C > T group (black arrows). Original magnification, × 10, scale bar, 100 μm. Data are presented as the mean ± SEM. t-test for statistical significance, *p < 0.05.; N.S, ≥ 0.05, not significant
Fig. 3
Fig. 3
CGN c.3560C > T induces a mesenchymal phenotypic switch in HT-29 cells. A, Morphological change induced by 100 ng/ml EGF in CGN WT and c.3560C > T HT-29 cells. Photographs using the 40× objective. Scale bar: 20 μm. B, Western blot analyses of the expression of EMT markers in HT-29 cells with CGN WT and c.3560C > T after 100 ng/ml EGF treatment. Representative western blot from three different clones. C, (Upper) Western blot of the cytosol and nucleus β-catenin in HT-29 cells with CGN WT and c.3560C > T after 100 ng/ml EGF treatment. Lamin A and actin served as internal loading controls for cytosolic and nuclear fractions, respectively. (Lower) Densitometric quantification of the cytosol and nucleus β-catenin expression levels. Value, mean ± SEM from analysis of three different clones. D, Representative images showing E-cadherin (E-cad) (green), β-catenin (red), and DAPI nuclei (N) staining (blue) expression using immunofluorescent assay in response to 100 ng/ml EGF stimulation for 48 h. Nuclear β-catenin accumulation can be observed after EGF stimulation for 48 h in HT-29 cells with CGN c.3560C > T. Scale bar: 10 μm. E, (Left) Transwell assay and (Right) quantitative analyses of the invasion activity of CGN WT and c.3560C > T HT-29 cells. Column, mean ± SEM from analysis of three different clones. Scale bar: 200 μm. F, (Left) Migratory activities of CGN WT and c.3560C > T HT-29 cells were assessed by using gap closure assay. (Right) Quantitative analyses of the migration activity of CGN WT and c.3560C > T HT-29 cells. Gap closure area quantified by using the ImageJ software was taken as the index of cell migration activity. Column, mean ± SEM from analysis of three different clones. Scale bar: 200 μm. Data are presented as the mean ± SEM. t-test for statistical significance, *p < 0.05; **p < 0.01
Fig. 4
Fig. 4
CGN c.3560C > T leads to overexpressed IQGAP1 identified by proteomic analysis. A Proteomic analysis using two-dimensional (2D) gel electrophoresis was conducted on lysates from HT-29 cells with either CGN c.3560 C > C or c.3560 C > T, both with and without EGF treatment over a 48-hour period. Enlarged images of specific 2D gel spots, denoted by arrows, were employed to underscore the observed variations in expression levels. A gel spot (solid circle) from CGN c.3560 C > T treat with EGF group was selected and followed by LC-MS/ MS analysis. B (Upper) Assignments to a protein in the searched database are established by correlating mass-to-charge ratio (m/z) values derived from both the Peptide Mass Fingerprinting (PMF) and the tandem mass spectrometry (MS/MS) data of the peptide ILAIGLINEALDEGDAQK. (Bottom) The peptide mapping figure and the identified sequence correspond to the protein IQGAP1. C The specific interaction of GFP-CGN WT, GFP-CGN c.3560 C > T, and IQGAP1 in HT-29 cells was investigated through immunoprecipitation (IP) using a GFP antibody. IP lane represents immunoprecipitation of bound eluted proteins, and input lane represents whole cell lysate. IP were analyzed by Western blotting using anti-IQGAP1 and anti-GFP antibody, and CGN expression in input was using anti-CGN antibody
Fig. 5
Fig. 5
CGN c.3560C > T is associated with Rac1 activation. A Western blot of Rac1 expression level in HT-29 cells with CGN c.3560 C > C or c.3560C > T. B Densitometric quantification of GTP-Rac1 expression levels. Value, mean ± SEM from analysis of three different clones. C Representative confocal images of GTP-Rac1 (green) and DAPI nuclei (N) (blue) staining from 38 human tumor samples, including colorectal, ovarian, and endometrial cancers. Ten tumor samples are from patients with germline CGN c.3560C > T heterozygous mutation and 28 tumor samples are from patients with CGN c.3560C > C. Scale bar: 50 μm. D Quantitative analysis of Rac1 intensity from confocal images of 38 tumor samples using the TissueFAXS System. E Western blot showing IQGAP1, GTP-Rac1, and Rac1 protein levels. Two different IQGAP1-delivered siRNA duplexes or scramble siRNAs were treated for 24 hours followed 48 hours with or without 100 ng/ml EGF stimulus. Cell lysates were then harvested for blotting. Data are presented as the mean ± SEM. t-test for statistical significance. *p < 0.05, **p < 0.01
Fig. 6
Fig. 6
Inactivation of Rac1 reverses EMT in CGN c.3560C > T HT-29 cancer cells and inhibits the growth of CGN c.3560C > T mutant orthotopic colorectal tumors. A Western blot analyses of GTP-Rac1, EMT markers, and β-catenin in CGN WT and c.3560C > T HT-29 cells with or without NSC23766 (100 μM) and EGF (100 ng/ml) treatment. B Densitometric quantification of the expression level of EMT markers assessed by Western blot. Column, mean ± SEM from analysis of three different clones. C (Left) Transwell assay of CGN WT and c.3560C > T HT-29 cells with or without NSC23766 (100 μM) treatment. (Right) Quantitative analyses of the invasion activity of CGN WT and c.3560C > T HT-29 cells with or without NSC23766 (100 μM) treatment. Column, mean ± SEM from analysis of three different clones. Scale bar: 200 μm. D (Left) Migratory activities of CGN WT or c.3560C > T HT-29 cells with or without NSC23766 treatment assessed by using gap closure assay. (Right) Quantitative analyses of the migration activity of CGN WT and c.3560C > T HT-29 cells with or without NSC23766 (100 μM) treatment were assessed by using a gap closure assay. Gap closure area quantified by using the ImageJ software was taken as the index of cell migration activity. Scale bar: 200 μm. Column, mean ± SEM from analysis of three different clones. E Representative images showing tumor growth in CGN WT and c.3560C > T HT-29 orthotopic xenograft tumor receiving saline or NSC23766 treatment were assessed by IVIS system. Mice were repeatedly imaged until week four after inoculation to record luminescence signals. The data were shown as radiance (photons/ sec/ cm2/ steradian) with a color bar. F Quantitative analysis of luminescence intensity from each tumor. Mice were analyzed by optical bioluminescence imaging at 1, 7, 14, 21, and 28 days after cancer cell injection. Arrows indicate the treatment time points. Value, mean ± SEM, n = 6 in each group. G Representative image of immunohistochemistry staining for GTP-Rac1 from xenograft tumor tissues. H The expression level of GTP-Rac1 was detected and analyzed by HistoQuest software in tumor tissues. Column, mean ± SEM from analysis of three different clones. t-test for statistical significance, *p < 0.05, **p < 0.01, ***p < 0.001

Similar articles

Cited by

References

    1. Futreal PA, Liu Q, Shattuck-Eidens D, Cochran C, Harshman K, Tavtigian S, et al. BRCA1 mutations in primary breast and ovarian carcinomas. Science. 1994;266:120–122. doi: 10.1126/science.7939630. - DOI - PubMed
    1. Wooster R, Neuhausen SL, Mangion J, Quirk Y, Ford D, Collins N, et al. Localization of a breast cancer susceptibility gene, BRCA2, to chromosome 13q12-13. Science. 1994;265:2088–2090. doi: 10.1126/science.8091231. - DOI - PubMed
    1. Friedman LS, Ostermeyer EA, Szabo CI, Dowd P, Lynch ED, Rowell SE, et al. Confirmation of BRCA1 by analysis of germline mutations linked to breast and ovarian cancer in ten families. Nat Genet. 1994;8:399–404. doi: 10.1038/ng1294-399. - DOI - PubMed
    1. Vahteristo P, Bartkova J, Eerola H, Syrjakoski K, Ojala S, Kilpivaara O, et al. A CHEK2 genetic variant contributing to a substantial fraction of familial breast cancer. Am J Hum Genet. 2002;71:432–438. doi: 10.1086/341943. - DOI - PMC - PubMed
    1. Erkko H, Xia B, Nikkila J, Schleutker J, Syrjakoski K, Mannermaa A, et al. A recurrent mutation in PALB2 in Finnish cancer families. Nature. 2007;446:316–319. doi: 10.1038/nature05609. - DOI - PubMed

Substances