. 2024 Feb 29;17(1):8.
doi: 10.1186/s13040-024-00359-z.

Interpreting drug synergy in breast cancer with deep learning using target-protein inhibition profiles

Affiliations

Interpreting drug synergy in breast cancer with deep learning using target-protein inhibition profiles

Thanyawee Srithanyarat et al. BioData Min. .

Abstract

Background: Breast cancer is the most common malignancy among women worldwide. Despite advances in treating breast cancer over the past decades, drug resistance and adverse effects remain challenging. Recent therapeutic progress has shifted toward using drug combinations for better treatment efficiency. However, with a growing number of potential small-molecule cancer inhibitors, in silico strategies to predict pharmacological synergy before experimental trials are required to compensate for time and cost restrictions. Many deep learning models have been previously proposed to predict the synergistic effects of drug combinations with high performance. However, these models heavily relied on a large number of drug chemical structural fingerprints as their main features, which made model interpretation a challenge.

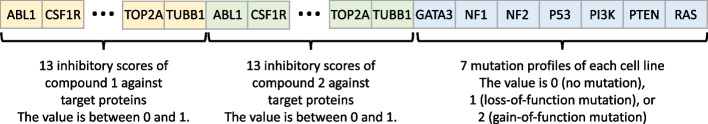
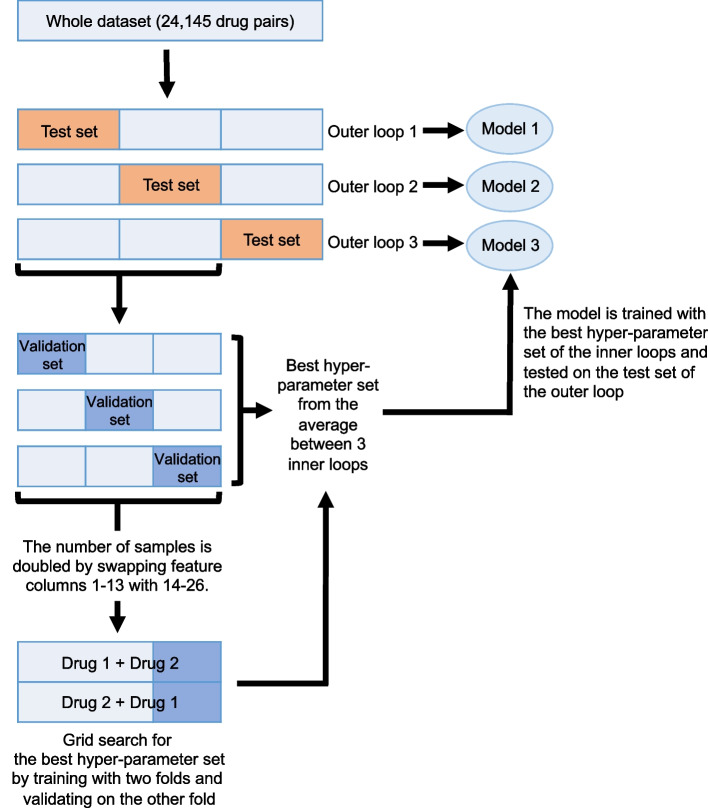
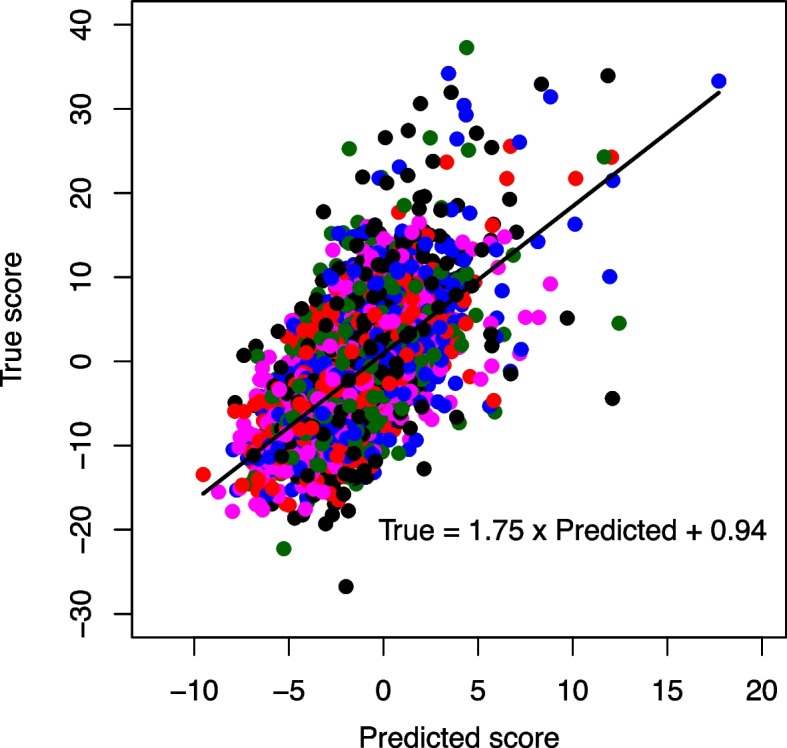
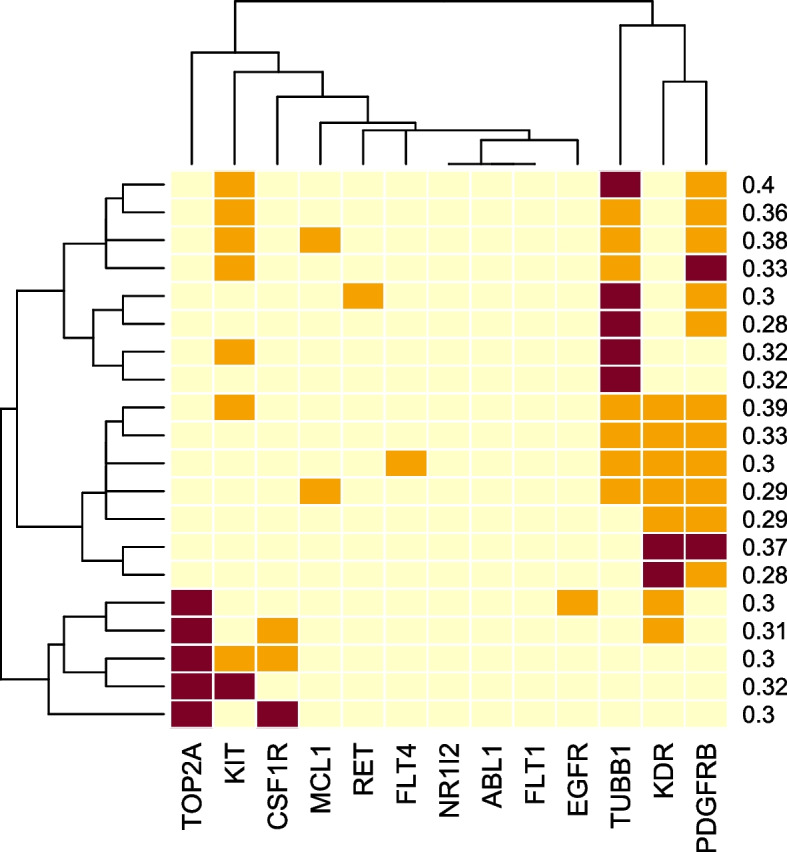
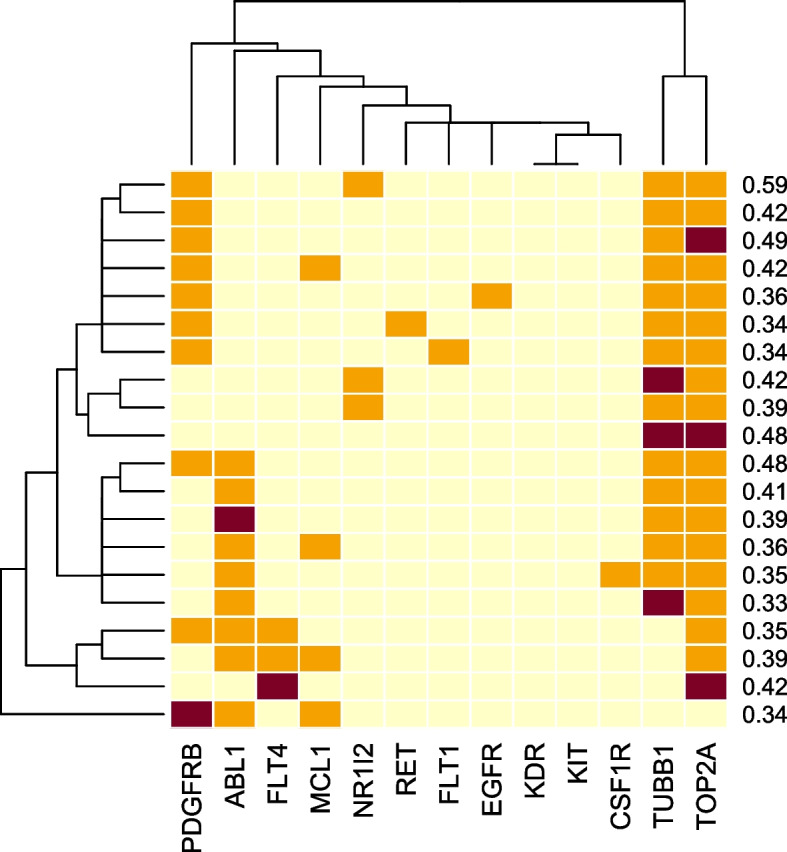
Results: This study developed a deep neural network model that predicts synergy between small-molecule pairs based on their inhibitory activities against 13 selected key proteins. The synergy prediction model achieved a Pearson correlation coefficient between model predictions and experimental data of 0.63 across five breast cancer cell lines. BT-549 and MCF-7 achieved the highest correlation of 0.67 when considering individual cell lines. Despite achieving a moderate correlation compared to previous deep learning models, our model offers a distinctive advantage in terms of interpretability. Using the inhibitory activities against key protein targets as the main features allowed a straightforward interpretation of the model since the individual features had direct biological meaning. By tracing the synergistic interactions of compounds through their target proteins, we gained insights into the patterns our model recognized as indicative of synergistic effects.

Conclusions: The framework employed in the present study lays the groundwork for future advancements, especially in model interpretation. By combining deep learning techniques and target-specific models, this study shed light on potential patterns of target-protein inhibition profiles that could be exploited in breast cancer treatment.

Keywords: Deep neural network; Drug combination; Small-molecule inhibitors; Synergistic effects; Targeted therapy.


Conflict of interest statement

The authors declare that they have no competing interests.

Figures

Fig. 1
Fig. 1
Input features of the drug-synergy prediction model. A group of graph convolutional neural network models generated 13 scores, representing inhibitory activities against 13 protein targets (the target-protein inhibition profile). To predict synergy between two drugs, the target-protein inhibition profile of each drug was concatenated, resulting in 13 × 2 = 26 features. Each feature has a value between 0 and 1. Mutation profiles of seven genes of each cell line retrieved from the Cell Model Passports and DepMap databases were also concatenated, where 0, 1, and 2 represent no mutation, loss-of-function mutation, and gain-of-function mutation, respectively
Fig. 2
Fig. 2
3 × 3 nested cross-validation (CV) method. 24,145 drug pairs tested on five cell lines from the DrugComb database were divided into three folds in the outer loop of the nested CV, where one fold was used as a test dataset while the other two folds were further divided into three folds in the inner loop. In each round of the inner loop, two folds were used as a training dataset, and the other fold was used as a validation set in a grid search for the best hyperparameter set. The best hyperparameter set (identified based on the average Pearson correlation coefficients obtained across each round of the three inner loops) was used to train a model, and the model was evaluated using the test set from the outer loop
Fig. 3
Fig. 3
Example of inhibitory scores for three drugs (row) against some target proteins (column)
Fig. 4
Fig. 4
The scatter plot compares true and predicted ZIP scores from the test dataset of Model 1. The true ZIP scores were from the original values reported in the DrugComb database. BT-549 (blue); MCF-7 (red); MDA-MB-231 (magenta); MDA-MB-468 (black); T-47D (green)
Fig. 5
Fig. 5
Inhibitory activities of the top 20 predicted synergy scores for BT-549 obtained from the generated inhibition profiles with 2–4 targets. The orange color indicates that the targets were inhibited with a score of 1.0 by either one of the drugs in the pair, maroon represents inhibition with a score of 1.0 by both drugs in the pair, and yellow indicates that neither of the drugs inhibited the targets (score = 0). The numbers indicate the predicted synergy scores
Fig. 6
Fig. 6
Inhibitory activities of the top 20 predicted synergy scores for MCF-7 obtained from the generated inhibition profiles with 2–4 targets. The orange color indicates that the targets were inhibited with a score of 1.0 by either one of the drugs in the pair, maroon represents inhibition with a score of 1.0 by both drugs in the pair, and yellow indicates that neither of the drugs inhibited the targets (score = 0). The numbers indicate the predicted synergy scores

Similar articles

Cited by

References

    1. Nussinov R, Tsai C-J, Jang H. A new view of pathway-driven drug resistance in tumor proliferation. Trends Pharmacol Sci. 2017;38(5):427–437. doi: 10.1016/j.tips.2017.02.001. - DOI - PMC - PubMed
    1. Bergholz JS, Zhao JJ. How compensatory mechanisms and adaptive rewiring have shaped our understanding of therapeutic resistance in cancer. Cancer Res. 2021;81(24):6074–6077. doi: 10.1158/0008-5472.CAN-21-3605. - DOI - PMC - PubMed
    1. Cremers CG, Nguyen LK. Network rewiring, adaptive resistance and combating strategies in breast cancer. Cancer Drug Resist. 2019;2(4):1106–1126. - PMC - PubMed
    1. Razavi P, Chang MT, Xu G, Bandlamudi C, Ross DS, Vasan N, et al. The genomic landscape of endocrine-resistant advanced breast cancers. Cancer Cell. 2018;34(3):427–438. doi: 10.1016/j.ccell.2018.08.008. - DOI - PMC - PubMed
    1. Priedigkeit N, Ding K, Horne W, Kolls JK, Du T, Lucas PC, et al. Acquired mutations and transcriptional remodeling in long-term estrogen-deprived locoregional breast cancer recurrences. Breast Cancer Res. 2021;23(1):1. doi: 10.1186/s13058-020-01379-3. - DOI - PMC - PubMed

LinkOut - more resources