. 2024 Feb 29;23(1):88.
doi: 10.1186/s12933-024-02174-6.

The SGLT2 inhibitor Empagliflozin promotes post-stroke functional recovery in diabetic mice

Affiliations

The SGLT2 inhibitor Empagliflozin promotes post-stroke functional recovery in diabetic mice

Ellen Vercalsteren et al. Cardiovasc Diabetol. .

Abstract

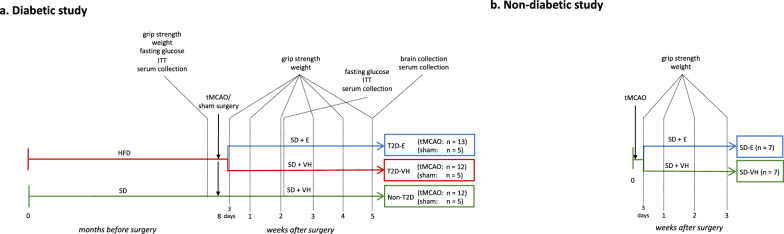
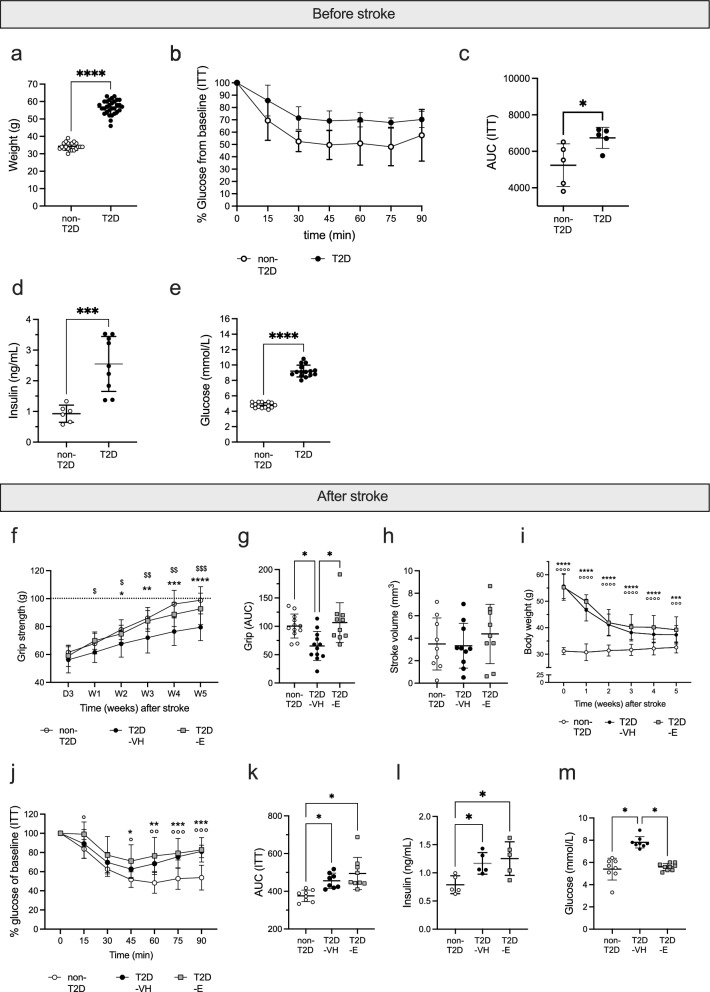
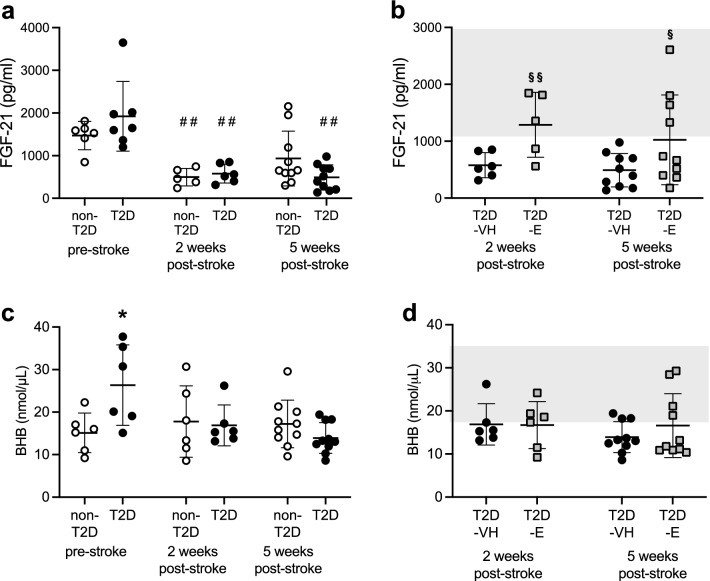
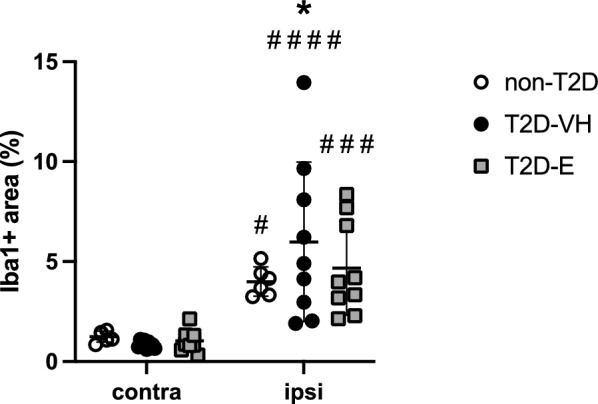
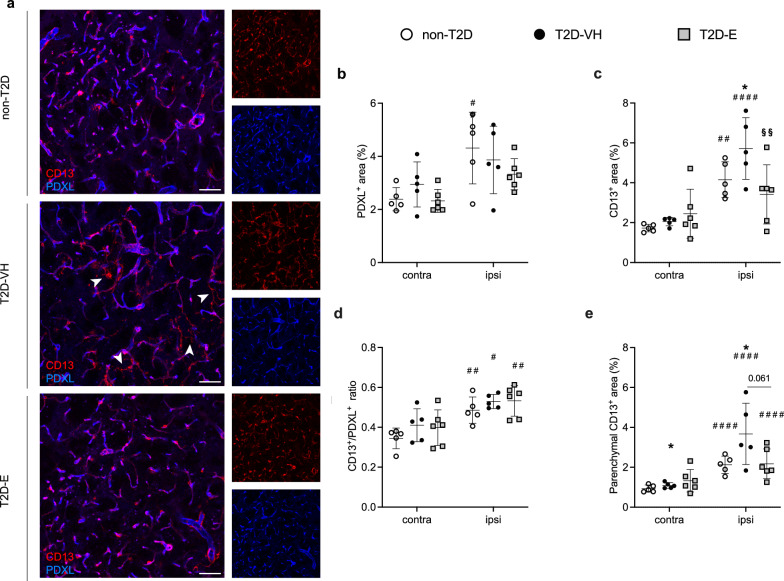
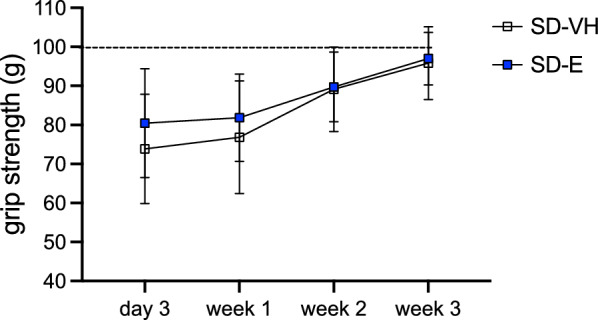
Type-2 diabetes (T2D) worsens stroke recovery, amplifying post-stroke disabilities. Currently, there are no therapies targeting this important clinical problem. Sodium-glucose cotransporter 2 inhibitors (SGLT2i) are potent anti-diabetic drugs that also efficiently reduce cardiovascular death and heart failure. In addition, SGLT2i facilitate several processes implicated in stroke recovery. However, the potential efficacy of SGLT2i to improve stroke recovery in T2D has not been investigated. Therefore, we determined whether a post-stroke intervention with the SGLT2i Empagliflozin could improve stroke recovery in T2D mice. T2D was induced in C57BL6J mice by 8 months of high-fat diet feeding. Hereafter, animals were subjected to transient middle cerebral artery occlusion and treated with vehicle or the SGLTi Empagliflozin (10 mg/kg/day) starting from 3 days after stroke. A similar study in non diabetic mice was also conducted. Stroke recovery was assessed using the forepaw grip strength test. To identify potential mechanisms involved in the Empagliflozin-mediated effects, several metabolic parameters were assessed. Additionally, neuronal survival, neuroinflammation, neurogenesis and cerebral vascularization were analyzed using immunohistochemistry/quantitative microscopy. Empagliflozin significantly improved stroke recovery in T2D but not in non-diabetic mice. Improvement of functional recovery was associated with lowered glycemia, increased serum levels of fibroblast growth factor-21 (FGF-21), and the normalization of T2D-induced aberration of parenchymal pericyte density. The global T2D-epidemic and the fact that T2D is a major risk factor for stroke are drastically increasing the number of people in need of efficacious therapies to improve stroke recovery. Our data provide a strong incentive for the potential use of SGLT2i for the treatment of post-stroke sequelae in T2D.

Keywords: Diabetes; Empagliflozin; Mouse; Sodium-glucose cotransporter 2 inhibitors; Stroke recovery.


Conflict of interest statement

This study was supported by Boehringer Ingelheim Pharma GmbH & Co. KG. TK is an employee of Boehringer Ingelheim Pharma GmbH & Co. KG. T.N. has received unrestricted grants from AstraZeneca and consultancy fees from Boehringer Ingelheim, Eli Lilly, Novo Nordisk, Merck and Sanofi-Aventis. The other authors declare that they have no competing interests.

Figures

Fig. 1
Fig. 1
Experimental design of the studies. a 4-week-old male C57BL6/J mice were fed for 8 months with SD or HFD. Stroke was then induced experimentally by 30 min tMCAO and the mice on HFD were then changed to SD for the entire duration of the recovery phase. Three days after stroke, T2D mice were randomized in two groups: a group receiving 10 mg/kg/day Empagliflozin and a VH-group. During the recovery phase, behavioral tests were performed once weekly for 5 weeks. Serum was collected before stroke and at two and five weeks after stroke. The metabolic state of the animals was characterized before stroke to confirm T2D, and at 2 weeks after stroke to confirm efficacy of Empagliflozin treatment. At 5 weeks after stroke, mice were sacrificed to collect brains for immunohistochemistry and serum for assessment of metabolic parameters. b 3-month-old mice were subjected to tMCAO surgery with a 30 min occlusion. Three days after tMCAO, mice were randomized in 2 groups: a group receiving 10 mg/kg/day Empagliflozin and a VH-group. Behavioral tests were performed once weekly for 3 weeks. HFD = high-fat diet, SD = standard diet, ITT = insulin tolerance test, E = 10 mg/kg/day Empagliflozin p.o., VH = vehicle (0.5% methylcellulose), tMCAO = transient middle cerebral artery occlusion
Fig. 2
Fig. 2
Effect of Empagliflozin treatment on metabolic parameters and functional recovery after stroke. Effect of 8 months of HFD on weight (a), insulin sensitivity shown as plotted curve (b) and area under the curve (c), serum insulin levels (d) and fasting glycemia (e). Forepaw grip strength after stroke shown as plotted curve (f) and area under the curve (g). Ischemic stroke volume (h). Body weight during stroke recovery (i). Insulin sensitivity, shown as plotted curve (j) and area under the curve (k), serum insulin (l) and fasting glycemia (m) at 2 weeks after stroke. Data are presented as mean ± SD. Statistical significance was calculated using two-way repeated measures ANOVA followed by Benjamini, Krieger and Yekutieli multiple comparisons test for insulin tolerance tests, forepaw grip strength and post-stroke body weight (b, f, i, j), Welch’s t-test for weight, area under the curve for ITT, plasma insulin and fasting glycemia before stroke (a, ce) Brown-Forsythe and Welch’s one-way ANOVA followed by Benjamini, Krieger and Yekutieli multiple comparisons test for post-stroke area under the curve of grip and ITT, stroke volume, plasma insulin and fasting glycemia (g, h, km). Results were considered significant if p < 0.05. *denotes a significant difference between non-T2D and T2D-VH, °denotes a significant difference between non-T2D and T2D-E, $denotes a significant difference between T2D-VH and T2D-E. * and $denote p < 0.05, ** and $$denote p < 0.01, ***, °°° and $$$denote p < 0.001, **** and °°°°denote p < 0.0001. Sample size: a non-T2D n = 20, T2D n = 30; b, c n = 5 in both non-T2D and T2D; d non-T2D n = 6, T2D n = 9; e n = 15 in both non-T2D and T2D; f, g non-T2D n = 12, T2D-VH n = 12, T2D-E n = 10; h non-T2D n = 9, T2D-VH n = 10, T2D-E n = 9; i non-T2D n = 12, T2D-VH n = 12, T2D-E n = 13; j, k non-T2D n = 8, T2D-VH n = 8, T2D-E = 9; l non-T2D n = 5, T2D-VH n = 5, T2D-E n = 5; m non-T2D n = 8, T2D-VH n = 8, T2D-E n = 9
Fig. 3
Fig. 3
Effect of stroke and Empagliflozin treatment on serum FGF-21 and BHB concentrations. Serum fibroblast growth factor 21 (FGF-21) (a) and β-hydroxybutyrate (BHB) (c) levels before stroke and at 2 and 5 weeks after stroke in non-diabetic controls (non-T2D) and type-2 diabetic mice (T2D). Serum FGF-21 (b) and BHB (d) levels of T2D mice treated with VH (T2D-VH) and diabetic mice treated daily with 10 mg/kg Empagliflozin (T2D-E) at 2 and 5 weeks after stroke. The grey area indicates the range of pre-stroke levels of Fgf-21 (b) and BHB (d) in T2D mice. Data are presented as mean ± SD. Statistical significance was calculated using two-way repeated measures ANOVA followed by Benjamini, Krieger and Yekutieli multiple comparisons test. Results were considered significant if p < 0.05. §denotes a significant difference between T2D-VH and T2D-E, *denotes a significant difference between non-T2D and T2D, #denotes a significant difference compared to pre-stroke in the same group. *denotes p < 0.05, **, §§ and ##denote p < 0.01. Sample size: n = 5–10 per group. At the pre-stroke and intermediate post-stroke timepoint, each data point represents results from serum pooled from 2–3 animals
Fig. 4
Fig. 4
Effect of Empagliflozin on neurogenesis after stroke. Number of Ki67+ cells in subventricular zone (SVZ) (a) and number of DCX+ cells in striatum (b) of non-diabetic controls (non-T2D), diabetic mice (T2D-VH) and diabetic mice treated with Empagliflozin (T2D-E) after stroke. Data are presented as mean ± SD. Statistical significance was calculated using two-way ANOVA followed by Benjamini, Krieger and Yekutieli multiple comparisons test. Results were considered statistically significant if p < 0.05. #denotes a difference between the contralateral and ipsilateral hemisphere within the same group. ##denotes p < 0.01, ###denotes p < 0.001. non-T2D n = 6, T2D-VH n = 7, T2D-E n = 8
Fig. 5
Fig. 5
Effect of Empagliflozin on neuroinflammation after stroke. Iba-1 expression in striatum of non-diabetic controls (non-T2D), diabetic mice (T2D-VH) and diabetic mice treated with Empagliflozin (T2D-E) after stroke. Data are presented as mean ± SD. Statistical significance was calculated using two-way ANOVA followed by Benjamini, Krieger and Yekutieli multiple comparisons test. Results were considered statistically significant if p < 0.05. *denotes a significant difference between non-T2D and T2D-VH in the same hemisphere, #denotes a significant difference between the contralateral and ipsilateral hemisphere within the same group. # and *denote p < 0.05, ###denotes p < 0.001 and ####denotes p < 0.0001. non-T2D n = 6, T2D-VH n = 9, T2D-E n = 9
Fig. 6
Fig. 6
Effect of Empagliflozin on vascularization after stroke. Confocal images (A) showing the expression in the striatum of non-diabetic controls (non-T2D), diabetic mice (T2D-VH) and diabetic mice treated with Empagliflozin (T2D-E) after stroke of CD13 (red) and PDXL (blue) evaluating vessel density (B), pericyte density (C), pericyte coverage (D) and parenchymal pericyte density (E). White arrows indicate the pericytes that are not associated with the vessels. Data are presented as mean ± SD. Statistical significance was calculated using two-way ANOVA followed by Benjamini, Krieger and Yekutieli multiple comparisons test. Results were considered statistically significant if p < 0.05. *denotes a difference between non-T2D and T2D-VH, §denotes a difference between T2D-VH and T2D-E, #denotes a difference between contralateral and ipsilateral hemisphere within the same group. Scale bar = 50 μm. non-T2D n = 5, T2D-VH n = 5, T2D-E n = 6
Fig. 7
Fig. 7
The effect of Empagliflozin on functional recovery after stroke in non-T2D mice. Forepaw grip strength of non-T2D mice treated with vehicle (SD-VH) or daily treatment with 10 mg/kg Empagliflozin p.o. (SD-E) after stroke shown as plotted curve. Data are presented as mean ± SD. Statistical significance was calculated using two-way repeated measures ANOVA followed by Benjamini, Krieger and Yekutieli multiple comparisons test and results were considered significant when p < 0.05. SD-VH n = 7, SD-E n = 7

References

    1. Collaborators GBDS. Global, regional, and national burden of stroke and its risk factors, 1990–2019: a systematic analysis for the Global Burden of Disease Study 2019. Lancet Neurol. 2021;20(10):795–820. doi: 10.1016/S1474-4422(21)00252-0. - DOI - PMC - PubMed
    1. Fadini GP, Cosentino F. Diabetes and ischaemic stroke: a deadly association. Eur Heart J. 2018;39(25):2387–2389. doi: 10.1093/eurheartj/ehy033. - DOI - PubMed
    1. Jia Q, Zhao X, Wang C, Wang Y, Yan Y, Li H, et al. Diabetes and poor outcomes within 6 months after acute ischemic stroke: the China National Stroke Registry. Stroke. 2011;42(10):2758–2762. doi: 10.1161/STROKEAHA.111.621649. - DOI - PubMed
    1. Tziomalos K, Spanou M, Bouziana SD, Papadopoulou M, Giampatzis V, Kostaki S, et al. Type 2 diabetes is associated with a worse functional outcome of ischemic stroke. World J Diabetes. 2014;5(6):939–944. doi: 10.4239/wjd.v5.i6.939. - DOI - PMC - PubMed
    1. Megherbi SE, Milan C, Minier D, Couvreur G, Osseby GV, Tilling K, et al. Association between diabetes and stroke subtype on survival and functional outcome 3 months after stroke: data from the European BIOMED Stroke Project. Stroke. 2003;34(3):688–694. doi: 10.1161/01.STR.0000057975.15221.40. - DOI - PubMed

Publication types

MeSH terms

LinkOut - more resources