

Multi-omics approaches for drug-response characterization in primary biliary cholangitis and autoimmune hepatitis variant syndrome
- PMID: 38424613
- PMCID: PMC10902991
- DOI: 10.1186/s12967-024-05029-6
Multi-omics approaches for drug-response characterization in primary biliary cholangitis and autoimmune hepatitis variant syndrome
Abstract
Background: Primary biliary cholangitis (PBC) and autoimmune hepatitis (AIH) variant syndrome (VS) exhibit a complex overlap of AIH features with PBC, leading to poorer prognoses than those with PBC or AIH alone. The biomarkers associated with drug response and potential molecular mechanisms in this syndrome have not been fully elucidated.
Methods: Whole-transcriptome sequencing was employed to discern differentially expressed (DE) RNAs within good responders (GR) and poor responders (PR) among patients with PBC/AIH VS. Subsequent gene ontology (GO) analysis and Kyoto Encyclopedia of Genes and Genomes (KEGG) pathway analysis were conducted for the identified DE RNAs. Plasma metabolomics was employed to delineate the metabolic profiles distinguishing PR and GR groups. The quantification of immune cell profiles and associated cytokines was achieved through flow cytometry and immunoassay technology. Uni- and multivariable logistic regression analyses were conducted to construct a predictive model for insufficient biochemical response. The performance of the model was assessed by computing the area under the receiver operating characteristic (AUC) curve, sensitivity, and specificity.
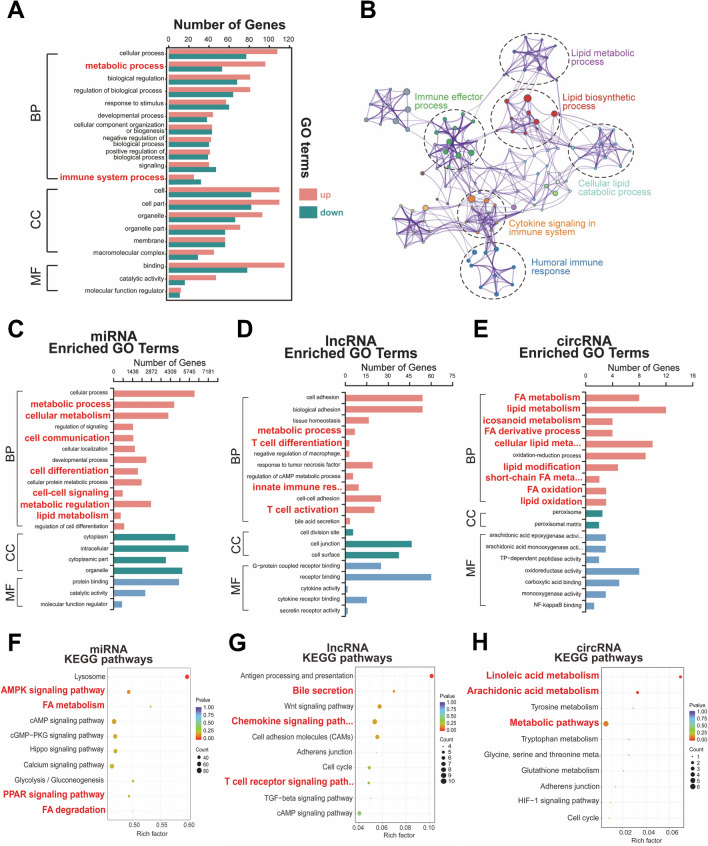
Findings: The analysis identified 224 differentially expressed (DE) mRNAs, 189 DE long non-coding RNAs, 39 DE circular RNAs, and 63 DE microRNAs. Functional pathway analysis revealed enrichment in lipid metabolic pathways and immune response. Metabolomics disclosed dysregulated lipid metabolism and identified PC (18:2/18:2) and PC (16:0/20:3) as predictors. CD4+ T helper (Th) cells, including Th2 cells and regulatory T cells (Tregs), were upregulated in the GR group. Pro-inflammatory cytokines (IFN-γ, TNF-α, IL-9, and IL-17) were downregulated in the GR group, while anti-inflammatory cytokines (IL-10, IL-4, IL-5, and IL-22) were elevated. Regulatory networks were constructed, identifying CACNA1H and ACAA1 as target genes. A predictive model based on these indicators demonstrated an AUC of 0.986 in the primary cohort and an AUC of 0.940 in the validation cohort for predicting complete biochemical response.
Conclusion: A combined model integrating genomic, metabolic, and cytokinomic features demonstrated high accuracy in predicting insufficient biochemical response in patients with PBC/AIH VS. Early recognition of individuals at elevated risk for insufficient response allows for the prompt initiation of additional treatments.
Keywords: Autoimmune liver diseases; Cytokinomic; Drug-response; Metabolomic; Whole-transcriptomic.
© 2024. The Author(s).
Conflict of interest statement
There are no conflicts of interest to declare.
Figures


Similar articles
-
Evaluation of classical and novel autoantibodies for the diagnosis of Primary Biliary Cholangitis-Autoimmune Hepatitis Overlap Syndrome (PBC-AIH OS).PLoS One. 2018 Mar 19;13(3):e0193960. doi: 10.1371/journal.pone.0193960. eCollection 2018. PLoS One. 2018. PMID: 29554146 Free PMC article.
-
Serum metabolic profiling of targeted bile acids reveals potentially novel biomarkers for primary biliary cholangitis and autoimmune hepatitis.World J Gastroenterol. 2022 Oct 21;28(39):5764-5783. doi: 10.3748/wjg.v28.i39.5764. World J Gastroenterol. 2022. PMID: 36338890 Free PMC article.
-
Therapy response and outcome of overlap syndromes: autoimmune hepatitis and primary biliary cirrhosis compared to autoimmune hepatitis and autoimmune cholangitis.Hepatogastroenterology. 2010 May-Jun;57(99-100):441-6. Hepatogastroenterology. 2010. PMID: 20698205
-
Variant syndromes of primary biliary cholangitis.Best Pract Res Clin Gastroenterol. 2018 Jun-Aug;34-35:55-61. doi: 10.1016/j.bpg.2018.06.003. Epub 2018 Jun 14. Best Pract Res Clin Gastroenterol. 2018. PMID: 30343711 Review.
-
[Autoimmune liver diseases and their overlap syndromes].Praxis (Bern 1994). 2006 Sep 6;95(36):1363-81. doi: 10.1024/1661-8157.95.36.1363. Praxis (Bern 1994). 2006. PMID: 16989180 Review. German.
Cited by
-
T-Type Voltage-Gated Calcium Channels: Potential Regulators of Smooth Muscle Contractility.Int J Mol Sci. 2024 Nov 19;25(22):12420. doi: 10.3390/ijms252212420. Int J Mol Sci. 2024. PMID: 39596484 Free PMC article. Review.
-
The relationship of peripheral blood lncRNA-PVT1 and miR-146a levels with Th17/Treg cytokines in patients with Hashimoto's thyroiditis and their clinical significance.Biomol Biomed. 2024 Sep 6;24(5):1170-1177. doi: 10.17305/bb.2024.10237. Biomol Biomed. 2024. PMID: 38761409 Free PMC article.
References
Publication types
MeSH terms
Substances
Grants and funding
LinkOut - more resources
Full Text Sources
Research Materials
