. 2024 Mar 1;43(1):64.
doi: 10.1186/s13046-024-02958-4.

JAK/STAT3 represents a therapeutic target for colorectal cancer patients with stromal-rich tumors

Affiliations

JAK/STAT3 represents a therapeutic target for colorectal cancer patients with stromal-rich tumors

Kathryn A F Pennel et al. J Exp Clin Cancer Res. .

Abstract

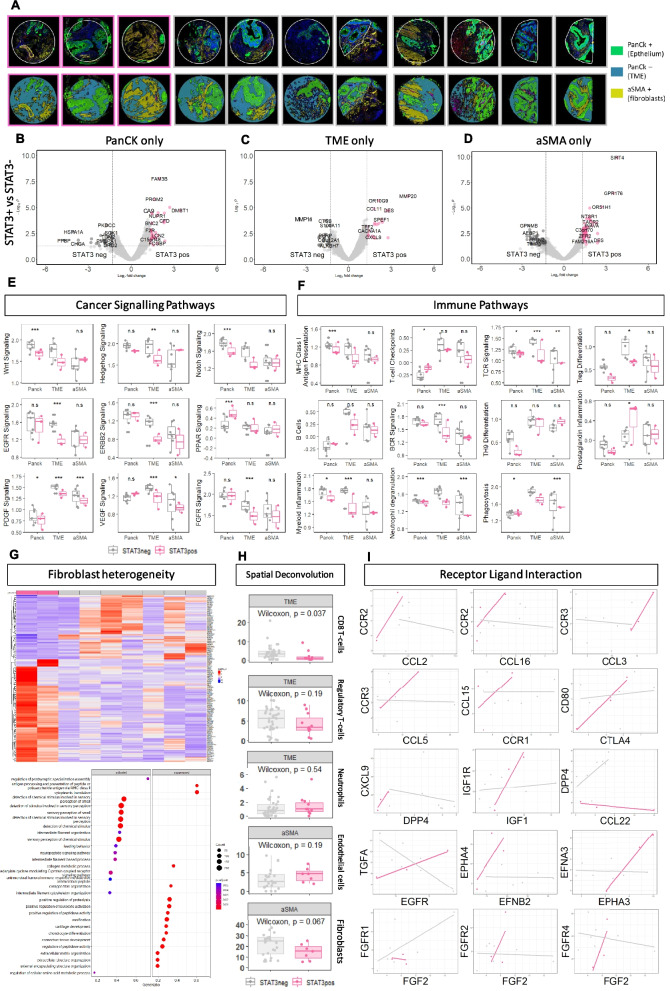
Colorectal cancer (CRC) is a heterogenous malignancy underpinned by dysregulation of cellular signaling pathways. Previous literature has implicated aberrant JAK/STAT3 signal transduction in the development and progression of solid tumors. In this study we investigate the effectiveness of inhibiting JAK/STAT3 in diverse CRC models, establish in which contexts high pathway expression is prognostic and perform in depth analysis underlying phenotypes. In this study we investigated the use of JAK inhibitors for anti-cancer activity in CRC cell lines, mouse model organoids and patient-derived organoids. Immunohistochemical staining of the TransSCOT clinical trial cohort, and 2 independent large retrospective CRC patient cohorts was performed to assess the prognostic value of JAK/STAT3 expression. We performed mutational profiling, bulk RNASeq and NanoString GeoMx® spatial transcriptomics to unravel the underlying biology of aberrant signaling. Inhibition of signal transduction with JAK1/2 but not JAK2/3 inhibitors reduced cell viability in CRC cell lines, mouse, and patient derived organoids (PDOs). In PDOs, reduced Ki67 expression was observed post-treatment. A highly significant association between high JAK/STAT3 expression within tumor cells and reduced cancer-specific survival in patients with high stromal invasion (TSPhigh) was identified across 3 independent CRC patient cohorts, including the TrasnSCOT clinical trial cohort. Patients with high phosphorylated STAT3 (pSTAT3) within the TSPhigh group had higher influx of CD66b + cells and higher tumoral expression of PDL1. Bulk RNAseq of full section tumors showed enrichment of NFκB signaling and hypoxia in these cases. Spatial deconvolution through GeoMx® demonstrated higher expression of checkpoint and hypoxia-associated genes in the tumor (pan-cytokeratin positive) regions, and reduced lymphocyte receptor signaling in the TME (pan-cytokeratin- and αSMA-) and αSMA (pan-cytokeratin- and αSMA +) areas. Non-classical fibroblast signatures were detected across αSMA + regions in cases with high pSTAT3. Therefore, in this study we have shown that inhibition of JAK/STAT3 represents a promising therapeutic strategy for patients with stromal-rich CRC tumors. High expression of JAK/STAT3 proteins within both tumor and stromal cells predicts poor outcomes in CRC, and aberrant signaling is associated with distinct spatially-dependant differential gene expression.

Keywords: Biomarkers; Cellular signaling; Colorectal cancer; JAK inhibitors; JAK/STAT3 signal transduction; Patient-derived organoids; Prognosis; Spatial biology; Stratified medicine; Tumor microenvironment; Tumor-stroma.


Conflict of interest statement

The authors declare no conflict of interests.

Figures

Fig. 1
Fig. 1
JAK inhibition and a therapeutic approach for CRC. Representative image of IHC staining for pSTAT3tyr705 in a KPN and AKPT mouse tumor (A). Bar chart showing the effect of JAK inhibitors on expression of pSTAT3tyr705 as measured by ELISA (B). Plot showing the effect of JAK inhibitors in control and in HCT116s with STAT3 knocked down (C). Representative images showing patient derived explants derived from matched normal and tumor colon samples and stained for Ki67via IHC after treatment with vehicle, Ruxolitinib or Tofacitinib (D). Brightfield images showing the effect of vehicle control, Ruxolitinib, Tofacitinib and 5FU on KPN and AKPT organoids after 72 h treatment (E). Representative images of immunofluorescent (IF) staining for Ki67 in an untreated and Ruxolitinib treated KPN mouse organoid (F). Box plot showing the effect of treatment with vehicle control, Ruxolitinib, Tofacitinib and 5FU for 72 h on cell viability of KPN and AKPT organoids (G). Representative images of IF staining for Ki67 and Caspase 8 in an untreated and Ruxolitinib treated PDO line (H). Dot plots showing the effect of treatment with vehicle control, Ruxolitinib, Tofacitinib and 5FU for 72 h on cell viability of 7 PDO lines with error bars represented by standard deviation and drug treatment compared to vehicle control by ANOVA (I). Significance set to *p < 0.05, **p < 0.005, p < 0.0005***
Fig. 2
Fig. 2
Expression of JAK1 and JAK2 and their association with prognosis in colorectal cancer. Representative images of negative, weak, moderate and strong IHC staining for JAK1 and JAK2 proteins in a retrospective cohort of CRC patients (A). Histograms showing the distribution of weighted histoscores for cytoplasmic JAK1 (B) and JAK2 (C). Representative images of high and low tumor stromal percentage cases (D). Kaplan Meier survival curve showing the association between TSP and CSS in cohort 1 (E). Kaplan Meier survival analysis of JAK1 and JAK2 tumor membrane expression in TSPhigh cases in cohort 1 (F). Kaplan Meier survival analysis of membranous JAK1 and JAK2 expression in TSPhigh cases when each protein was assessed individually (G-H). Representative staining of HCT116 cell pellets stained for pSTAT3tyr705 via IHC after treatment with vehicle of AZD1480 (I). Dose response curve showing the effect of JAK specific inhibitor AZD1480 on HCT116 cell viability (H). Bar chart showing the effect of 100µM AZD1480 on cell viability of mouse model organoids when used as monotherapy in AKPT (p = 0.056) and KPN (p < 0.0001) and in combination with 100µM 5FU (AKPT p = 0.002, KPN p = 0.0006) (I). Significance set to p < 0.05*, p < 0.005**, p < 0.0005***
Fig. 3
Fig. 3
STAT3 expression is significantly prognostic in patients with stromal-rich tumors. Representative images of negative, weak, moderate, and strong IHC staining for pSTAT3tyr705 in CRC tissue from patient cohort 1 (A). Histogram showing the distribution of weighted histoscores for pSTAT3tyr705 quantified in the tumor cell nuceli of cohort 1 (B). Kaplan Meier curve showing the association between tumor nuclear expression of pSTAT3tyr705 and CSS in the full patient cohort 1(n = 660) (C). Bar plot showing the distribution of weighted histoscores for pSTAT3tyr705 across TSPlow and TSPhigh cases (D). Kaplan Meier survival analysis showing tumor nuclear pSTAT3tyr705 expression and CSS in TSPlow (E) and TSPhigh cases (F). Kaplan Meier survival curve showing the association between a combined score of pSTAT3tyr705 and pSTAT3ser727 expression and CSS in TSPhigh cases (G). Representative image of multiplex IF staining for pSTAT3tyr705 and pSTAT3ser727 in CRC tissue from patient cohort 1 with arrows highlighting the dual positive cells (H). Kaplan Meier curves showing the association between pSTAT3tyr705 expression and CSS in the TransSCOT clinical trial patient cohort (n = 1820) relative to treatment type (I-J) and treatment duration (K-L). Significance set to p < 0.05*, p < 0.005**, p < 0.0005***
Fig. 4
Fig. 4
Immune and genetic profiles of high pSTAT3 expression within TSPhigh cases. Box plot showing association between CD45Ro + (A), CD3 + (B), CD8 + (C), FOXP3 + (D), CD66b + (E), CD68 + (F), CD80 + (G), PDL1 + (H), PD1 + (I) and Ki67 + cells (J) and pSTAT3tyr705 status within TSPhigh tumors. Statistical significance was assessed using Mann–Whitney tests and bars represent mean ± standard error of the mean. Corrplot showing the association between pSTAT3 status and clinicopathological characteristics of TSPhigh patients (K). Oncoplot showing the top mutated genes between high and low pSTAT3tyr705 groups within the TSPhigh patients (L). Enrichment plots showing the key pathways upregulated in pSTAT3tyr705 high TSPhigh tumors (MN). Kaplan Meier survival curve showing the association between pSTAT3tyr705 and TSP score in cohort 3 (p = 0.0019) (O). Volcano plot showing differential gene expression analysis of high versus low pSTAT3tyr705 within TSPhigh cases (P). Box plots showing top upregulated and downregulated genes across pSTAT3tyr705 high and low groups within TSPhigh tumors of cohort 3 (Q). Significance set to p < 0.05*, p < 0.005**, p < 0.0005***, p < 0.00005****
Fig. 5
Fig. 5
Digital Spatial Profiling revealed profound differences in compartments of the tumor microenvironment of high pSTAT3Tyr705 cases. First row demonstrates representative images of 3 high pSTAT3 TSPhigh TMA cores (pink) and 8 Low pSTAT3 TSPhigh TMA cores (from patient cohort 3) (grey) stained with SYTO13 (blue), PanCK(green), aSMA(yellow) scanned on the Nanostring GeoMx® platform (A). The second row demonstrates masks used to generate PanCK + (epithelial), aSMA + (fibroblast), PanCK-SMA-(TME) segmented transcriptome compartments (A). Volcano plot demonstrating differential gene expression results comparing high pSTAT3 cores versus low pSTAT3 cores in PanCK compartment only (B). Volcano plot demonstrating differential gene expression results comparing high pSTAT3 cores versus low pSTAT3 cores in TME compartment only (C). Volcano plot demonstrating differential gene expression results comparing high pSTAT3 cores versus low pSTAT3 cores in aSMA compartment only (D). Box plots demonstrating Normalized Expression (y-axis) of common cancer signaling pathways (Nanostring WTA curated gene sets) calculated using fgsea comparing high pSTAT3 (pink) and low pSTAT3 (grey) cases in segmented compartments (x-axis) (p < 0.05*, p < 0.005**, p < 0.0005***) (E). Box plots demonstrating Normalized Expression (y-axis) of common immune signaling pathways (Nanostring WTA curated gene sets) calculated using fgsea comparing high pSTAT3 (pink) and low pSTAT3 (low) cases in segmented compartments (x-axis) (p < 0.05*, p < 0.005**, p < 0.0005***) (F). Panel 1: Heatmap demonstrating differentially expressed genes comparing high pSTAT3 and low pSTAT3 in aSMA compartment. Panel 2: Gene Set Enrichment Analysis of differentially expressed genes in the aSMA compartment comparing high pSTAT3 and low pSTAT3 in aSMA compartment generated using ClusterProfiler package to interrogate REACTOME curated pathways (G). Boxplots demonstrating results of deconvoluting transcriptomic readout of high pSTAT3 and low pSTAT3 cores into estimated immune cells counts, selected plots from TME and aSMA compartment are shown (H). Scatterplots of gene expression count of selected receptor ligand pairs (CellPhoneDB) comparing high pSTAT3 (pink) and low pSTAT3 (grey) with superimposed linear model line, well correlated gene pairs are assumed to imply a relationship between receptor and ligand in that group (I)
Fig. 6
Fig. 6
Activation of STAT3 in the tumor-associated stroma. Box plot showing the expression of STAT3 in different cell populations from a cohort of CRC patients from counfoundR (A-B). Enrichment plot showing IL6/JAK/STAT3 in a CRC cohort comparing epithelial and fibroblas t expression using confoundR (C). Box plot showing the expression of pSTAT3tyr705 within the tumor and stromal compartments of cohort 1 (D). Box plot showing the expression of pSTAT3tyr705 within the stroma relative to TSP status of cohort 1 (E). Kaplan Meier survival curve showing the association between stromal pSTAT3 and CSS in cohort 1 (F). Scatter plot showing the association between pSTAT3 expression within the tumor and stroma of cohort 1 (G). Kaplan Meier survival curve showing the association between a combined tumor and stromal score for pSTAT3tyr705 and CSS in cohort 1 (H). Brightfield images of untreated/AZD1480 treated CCD18Co colorectal fibroblasts (I). Bar chart showing the effect of AZD1480 on cell viability of CCD18Co cells (J) and a patient-derived CAF primary cell line (K). Representative images of IF staining for MHC1 in HCT116 cells grown as a monoculture and as a coculture with CAFs (L) Representative images of IF staining for β-catenin and programmed death ligand 1 (PDL1) in HCT116 cells grown as a monoculture, as a coculture with CAFs treated with vehicle control or AZD1480 (M). Significance set to p < 0.05*, p < 0.005**, p < 0.0005***, p < 0.00005****

References

    1. Coukos G. Neoadjuvant immune-checkpoint blockade in resectable colon cancer. Nat Med. 2020;26(4):473–474. doi: 10.1038/s41591-020-0826-3. - DOI - PubMed
    1. Park JH, et al. Evaluation of a tumor microenvironment-based prognostic score in primary operable colorectal cancer. Clin Cancer Res. 2015;21(4):882–888. doi: 10.1158/1078-0432.CCR-14-1686. - DOI - PubMed
    1. Guinney J, et al. The consensus molecular subtypes of colorectal cancer. Nat Med. 2015;21(11):1350–1356. doi: 10.1038/nm.3967. - DOI - PMC - PubMed
    1. Park JH, et al. The relationship between tumour stroma percentage, the tumour microenvironment and survival in patients with primary operable colorectal cancer. Ann Oncol. 2014;25(3):644–651. doi: 10.1093/annonc/mdt593. - DOI - PMC - PubMed
    1. Park JH, et al. Tumour invasiveness, the local and systemic environment and the basis of staging systems in colorectal cancer. Br J Cancer. 2017;116(11):1444–1450. doi: 10.1038/bjc.2017.108. - DOI - PMC - PubMed