. 2024 Sep;18(9):2212-2233.
doi: 10.1002/1878-0261.13616. Epub 2024 Feb 29.

Vitamin-C-dependent downregulation of the citrate metabolism pathway potentiates pancreatic ductal adenocarcinoma growth arrest

Affiliations

Vitamin-C-dependent downregulation of the citrate metabolism pathway potentiates pancreatic ductal adenocarcinoma growth arrest

Aiora Cenigaonandia-Campillo et al. Mol Oncol. 2024 Sep.

Abstract

In pancreatic ductal adenocarcinoma (PDAC), metabolic rewiring and resistance to standard therapy are closely associated. PDAC cells show enormous requirements for glucose-derived citrate, the first rate-limiting metabolite in the synthesis of new lipids. Both the expression and activity of citrate synthase (CS) are extraordinarily upregulated in PDAC. However, no previous relationship between gemcitabine response and citrate metabolism has been documented in pancreatic cancer. Here, we report for the first time that pharmacological doses of vitamin C are capable of exerting an inhibitory action on the activity of CS, reducing glucose-derived citrate levels. Moreover, ascorbate targets citrate metabolism towards the de novo lipogenesis pathway, impairing fatty acid synthase (FASN) and ATP citrate lyase (ACLY) expression. Lowered citrate availability was found to be directly associated with diminished proliferation and, remarkably, enhanced gemcitabine response. Moreover, the deregulated citrate-derived lipogenic pathway correlated with a remarkable decrease in extracellular pH through inhibition of lactate dehydrogenase (LDH) and overall reduced glycolytic metabolism. Modulation of citric acid metabolism in highly chemoresistant pancreatic adenocarcinoma, through molecules such as vitamin C, could be considered as a future clinical option to improve patient response to standard chemotherapy regimens.

Keywords: PDAC; citrate synthase; gemcitabine; metabolism; vitamin C.


Conflict of interest statement

The authors declare no conflict of interest.

Figures
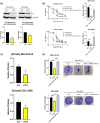
Fig. 1
Fig. 1
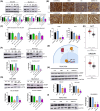
Citrate Synthase (CS) knockdown sensitizes pancreatic ductal adenocarcinoma cell lines to gemcitabine. (A) Western Blot showing CS expression in empty vector (pLV) and pLV CSshRNA transfected Mia‐PaCa2 and CRL‐2558 cell lines (n = 3). (B) IC50 of gemcitabine in pLV empty vector, shCS and shCS +200 μm citrate (n = 3). (C) Relative citrate concentration in pLV empty and pLV CSshRNA transfected Mia‐PaCa2 and CRL‐2558 cell lines (n = 3). (D) Proliferation assay of pLV empty, pLV CSshRNA and pLV CSshRNA +200 μm citrate transfected Mia‐PaCa2 and CRL‐2558 cell lines (n = 3). Data are presented as mean ± SD. Statistical analyses were determined by two‐tailed unpaired t‐test (*P < 0.05; **P < 0.01) in case of panel A & C, and using one‐way ANOVA with Tukey's multiple comparison test (*P < 0.05; **P < 0,01; ***P < 0.001) in B & D panels.
Fig. 2
Fig. 2
Vitamin C inhibits citrate synthase activity. (A) Citrate synthase (CS) protein expression in Mia‐PaCa 2 and CRL‐2558 cell lines after ascorbic acid, gemcitabine or combinatory treatment (n = 3). (B) mitochondrial CS expression in Mia‐Paca 2 and CRL‐2558 cell lines upon ascorbic acid, gemcitabine or combinatory treatment (n = 3). (C) CS activity in both pancreatic ductal adenocarcinoma cell lines after ascorbic acid, gemcitabine or combinatory treatment (n = 3). (D) 13C Glucose conversion into citrate in Mia‐Paca 2 and CRL‐2558 in hypoxic conditions and after vitamin C treatment. Data is represented as fractional contribution ± SD. All experiments were set in triplicate. (E) Ratio between 13C glucose‐derived citrate and pyruvate in both PDAC cell lines upon Nickel Chloride (NiCl2) and vitamin C exposure for 4 h (n = 3). (F) CS expression in mice tumors treated with vitamin C (VC), Gemcitabine (GEM), or combinatory treatment (n = 5) Scale Bar Measurement = 50 μm. (G) CS activity in PDAC mice tumors treated with vitamin C, Gemcitabine (GEM) or combinatory treatment (n = 5). (H) Citrate levels in PDAC Patient‐derived xenograft (PDX) after vitamin C, gemcitabine or combinatory treatment (n = 5). (I) Relative CS activity in Mia‐PaCa2 and CRL‐2558 cell lines upon N‐Acetyl Cystein (NAC) pretreatment and exposure of cells to NiCl2, vitamin C and/or gemcitabine. Data are presented as mean ± SD (unless specified) Statistical analyses were determined by one‐way ANOVA with Tukey's multiple comparison test (*P < 0.05; **P < 0.01; ***P < 0.001; ****P < 0.0001).
Fig. 3
Fig. 3
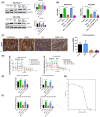
Ascorbic acid‐dependent downregulation of Fatty Acid Synthase (FASN) and ATP Citrate Lyase (ACLY) through AKT/SREBP1 axis modulation. (A) FASN and ACLY protein expression after NiCl2 (Nickel chloride), ascorbate, gemcitabine or combinatory treatment in Mia‐PaCa2 and CRL‐2558 cell lines (n = 3). (B) Immunohistochemistry analysis and h score bars showing FASN and ACLY expression in mice tumors treated with Gemcitabine (GEM), vitamin C or combinatory therapy (n = 5) Scale Bar Measurement = 50 μm. (C) FASN gene expression in Mia‐Paca2 and CRL‐2558 after NiCl2, GEM, vitamin C or combinatory treatment (n = 3). (D) Schematic representation of FASN transcriptional regulation through AKT. (E) The Cancer Genome Atlas (TGCA database) analysis of pancreatic tumor (red) versus healthy tissue (gray) of AKT and SREBP1 expression. F and G AKT and SREBP1 protein expression after NiCl2, vitamin C, GEM or combinatory treatment in both PDAC cell lines (n = 3). (H, I) AKT, p‐AKT (Ser 473) and SREBP1 tumor expression (n = 5) Data are presented as mean ± SD. Statistical analyses were done using one‐way ANOVA with Tukey's multiple comparison test (*P < 0.05; **P < 0.01; ***P < 0.001; ****P < 0.0001).
Fig. 4
Fig. 4
Vitamin C‐dependent downregulation of Lactate Dehydrogenase A (LDHA). (A, B) LDHA protein and gene expression in pancreatic cancer (PDAC) cell lines treated with NiCl2 (Nickel Chloride), vitamin C, Gemcitabine (GEM) or combination of both treatments. Protein expression was normalized to β‐Actin and gene expression to RPLP0 (n = 3). (C) LDHA in vivo protein expression in mice tumors in response to vitamin C, GEM or combination (n = 5) Scale Bar Measurement = 50 μm. (D–F) ECAR (Extracellular acidification rate), basal glycolysis and compensatory glycolysis in Mia‐PaCa2 and CRL‐2558 after NiCl2, ascorbic acid, gemcitabine or combination (n = 5). GlycoPER = Glycolutic Proton Efflux Rate; AA = Antimycin A; 2‐DG = 2‐Deoxy‐D‐glucose. (G) Effect of vitamin C concentration on the LDHA activity. The reaction medium at 25 °C contained 100 mm sodium phosphate buffer pH 7.0, 250 μm pyruvate, 10 μm NADH, 1 mg·mL−1 LDHA and increasing concentrations of ascorbic acid (0–20 mm) (n = 3). Data are presented as mean ± SD. Statistical analyses were done using one‐way ANOVA with Tukey's multiple comparison test (*P < 0.05; **P < 0.01; ***P < 0.001; ****P < 0.0001).
Fig. 5
Fig. 5
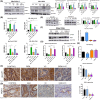
Vitamin C targets GLUT1 and PDK1, enhancing PDH activity. (A, B) GLUT1 and PDK1 protein and gene expression in response to NiCl2, vitamin C, gemcitabine or combination in Mia‐PaCa2 and CRL‐2558 cell lines (n = 3). (C, D) Immunohistochemical analysis and its h score bars of PDAC PDX tumors showing GLUT1 and PDK1 expression in mice treated with vitamin C, Gemcitabine GEM or combinatory treatment (n = 5). Scale bars = 50 μm. (E) Relative p‐PDH/PDH protein expression in PDAC cell lines (n = 3) after NiCl2, vitamin C, gemcitabine or combination treatment. (F) Relative p‐PDH/PDH protein expression in Patient‐derived xenograft tumors (PDX) (n = 5) after vitamin C, gemcitabine or combination treatment. (G) PDH activity in PDAC cell lines (n = 3). (H) PDH activity in PDX tumors (n = 5) in response to vitamin C, gemcitabine or combination. Data are presented as mean ± SD. Statistical analyses were determined by one‐way ANOVA with Tukey's multiple comparison test (*P < 0.05; **P < 0.01; ***P < 0.001; ****P < 0.0001).
Fig. 6
Fig. 6
Vitamin C synergizes with Gemcitabine in pancreatic cancer cells inducing apoptosis. (A) Annexin V‐PI (Propidium Iodide) based apoptosis analysis in Mia‐PaCa2 and CRL‐2558 cell lines in response to vitamin C, gemcitabine or combinatory treatment (n = 3). (B) Viability assay of PDAC cell lines after, vitamin C, Gemcitabibe (GEM) or combination (n = 3). (C) Representative images showing cell morphology after vitamin C, GEM or combinatory treatment (n = 3) Scale bar = 200 μm. (D, E) ATP production and mitochondrial membrane potential in Mia‐PaCa2 and CRL‐2558 cell lines after vitamin C, gemcitabine or combination (n = 3). FCCP was used as a positive control for mitochondrial potential loss. RFU, relative fluorescence value. Data are presented as mean ± SD. Statistical analyses were done using one‐way ANOVA with Tukey's multiple comparison test (*P < 0.05; ***P < 0.001; ****P < 0.0001).
Fig. 7
Fig. 7
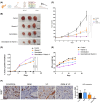
Vitamin C enhances gemcitabine response in PDAC PDX model. (A) Schematic representation of the PDX model treatment design. (B) Tumor images at the end of the treatment. (C) Tumor volume curve in response to saline, vitamin C, gemcitabine of combinatory treatment (n = 9 per group). (D) Percentage of tumor growth inhibition during mice treatment (n = 9 per group) Scale bars = 5 mm. (E) Mice weight during treatment infusion (n = 9 per group). (F) Ki67 protein expression in PDAC mice tumors after saline, vitamin C, gemcitabine or combination (n = 5) Scale Bar Measurement = 50 μm. Data are presented as mean ± SEM. Statistical analyses were determined by one‐way ANOVA with Tukey's multiple comparison test. Tumor volumes were analyzed by Kruskal–Wallis nonparametric test with pairwise Wilcoxon correction for multiple comparison (*P < 0.05; **P < 0.01; ***P < 0.001; ****P < 0.0001).

References

    1. Robatel S, Schenk M. Current limitations and novel perspectives in pancreatic cancer treatment. Cancer. 2022;14(4):985. - PMC - PubMed
    1. Rawla P, Sunkara T, Gaduputi V. Epidemiology of pancreatic cancer: global trends, etiology and risk factors. World J Oncol. 2019;10(1):10–27. - PMC - PubMed
    1. Principe DR, Underwood PW, Korc M, Trevino JG, Munshi HG, Rana A. The current treatment paradigm for pancreatic ductal adenocarcinoma and barriers to therapeutic efficacy. Front Oncol. 2021;11:688377. - PMC - PubMed
    1. Alo PL, Amini M, Piro F, Pizzuti L, Sebastiani V, Botti C, et al. Immunohistochemical expression and prognostic significance of fatty acid synthase in pancreatic carcinoma. Anticancer Res. 2007;27(4B):2523–2527. - PubMed
    1. Yang Y, Li H, Li Z, Zhao Z, Yip‐Schneider M, Fan Q, et al. Role of fatty acid synthase in gemcitabine and radiation resistance of pancreatic cancers. Int J Biochem Mol Biol. 2011;2(1):89–98. - PMC - PubMed

MeSH terms