

HLA-DQB1*05 subtypes and not DRB1*10:01 mediates risk in anti-IgLON5 disease
- PMID: 38425314
- PMCID: PMC11224611
- DOI: 10.1093/brain/awae048
HLA-DQB1*05 subtypes and not DRB1*10:01 mediates risk in anti-IgLON5 disease
Abstract
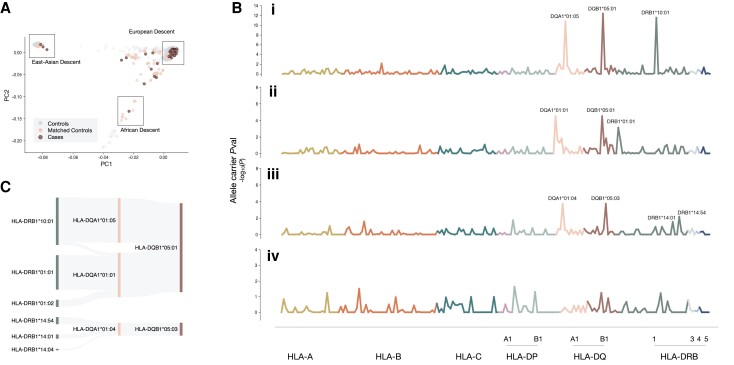
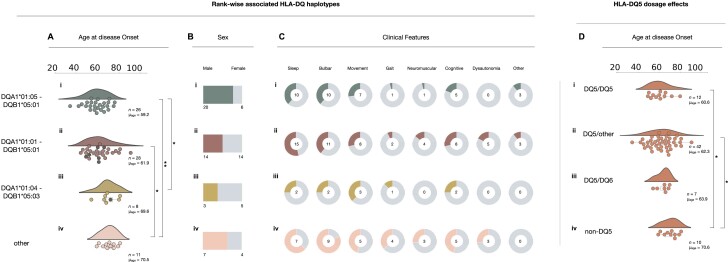
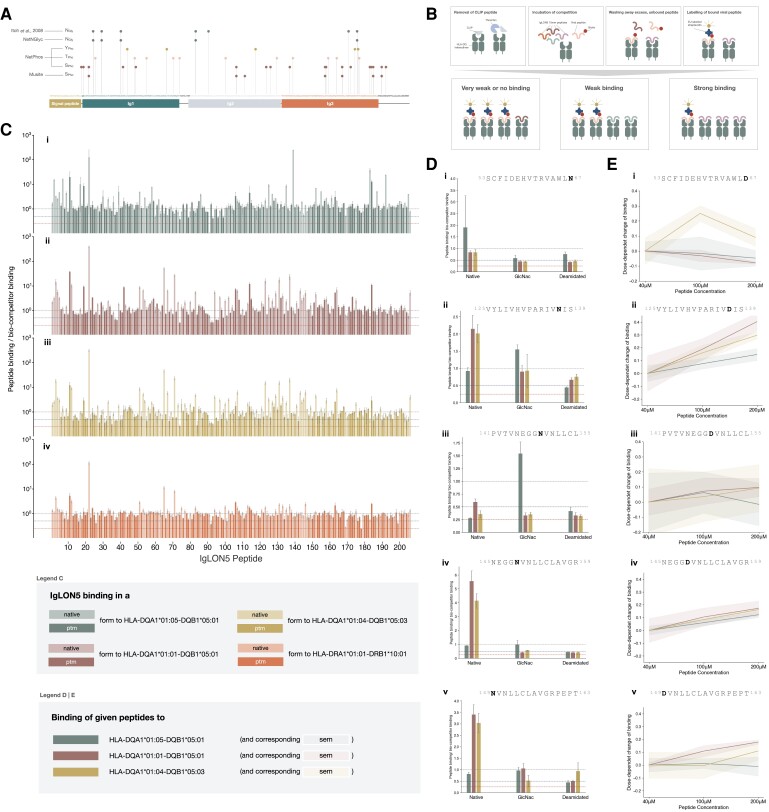
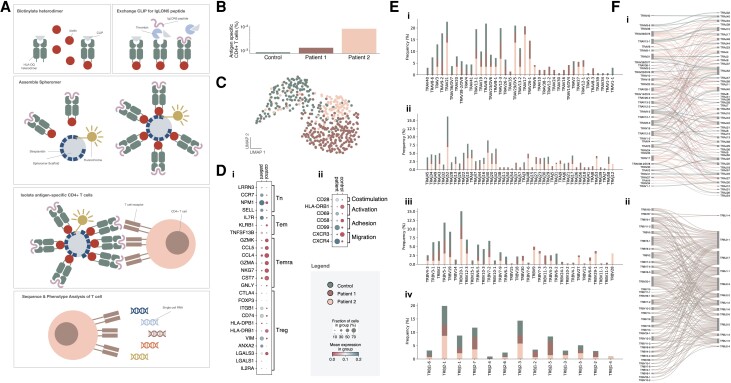
Anti-IgLON5 disease is a rare and likely underdiagnosed subtype of autoimmune encephalitis. The disease displays a heterogeneous phenotype that includes sleep, movement and bulbar-associated dysfunction. The presence of IgLON5-antibodies in CSF/serum, together with a strong association with HLA-DRB1*10:01∼DQB1*05:01, supports an autoimmune basis. In this study, a multicentric human leukocyte antigen (HLA) study of 87 anti-IgLON5 patients revealed a stronger association with HLA-DQ than HLA-DR. Specifically, we identified a predisposing rank-wise association with HLA-DQA1*01:05∼DQB1*05:01, HLA-DQA1*01:01∼DQB1*05:01 and HLA-DQA1*01:04∼DQB1*05:03 in 85% of patients. HLA sequences and binding cores for these three DQ heterodimers were similar, unlike those of linked DRB1 alleles, supporting a causal link to HLA-DQ. This association was further reflected in an increasingly later age of onset across each genotype group, with a delay of up to 11 years, while HLA-DQ-dosage dependent effects were also suggested by reduced risk in the presence of non-predisposing DQ1 alleles. The functional relevance of the observed HLA-DQ molecules was studied with competition binding assays. These proof-of-concept experiments revealed preferential binding of IgLON5 in a post-translationally modified, but not native, state to all three risk-associated HLA-DQ receptors. Further, a deamidated peptide from the Ig2-domain of IgLON5 activated T cells in two patients, compared with one control carrying HLA-DQA1*01:05∼DQB1*05:01. Taken together, these data support a HLA-DQ-mediated T-cell response to IgLON5 as a potentially key step in the initiation of autoimmunity in this disease.
Keywords: HLA; IgLON5; T cell; autoimmune encephalitis; autoimmunity.
© The Author(s) 2024. Published by Oxford University Press on behalf of the Guarantors of Brain. All rights reserved. For commercial re-use, please contact reprints@oup.com for reprints and translation rights for reprints. All other permissions can be obtained through our RightsLink service via the Permissions link on the article page on our site—for further information please contact journals.permissions@oup.com.
Conflict of interest statement
S.R.I. has received honoraria/research support from UCB, Immunovant, MedImmun, Roche, Janssen, Cerebral therapeutics, ADC therapeutics, Brain, CSL Behring and ONO Pharma; and receives licensed royalties on patent application WO/2010/046716 entitled ‘Neurological Autoimmune Disorders’; and has filed two other patents entitled ‘Diagnostic method and therapy’ (WO2019211633 and US-2021-0071249-A1; PCT application WO202189788A1) and ‘Biomarkers’ (PCT/GB2022/050614 and WO202189788A1). S.M. received speaker honoraria from Biogen, Sanofy and Novartis. C.J.H. has been serving as a consultant for Univar and has received honoraria for lecturing and travel expenses/speaking honoraria from Abbott and Alexion and research support from Abbott. A.M. patents issued for GFAP and MAP1B-IgGs and patents pending for PDE10A, Septins-5 and -7 and KLCHL11-IgGs, and has consulted for Janssen and Roche pharmaceuticals, without personal compensation. J.D. holds a patent for the use of IgLON5 antibody testing and both he and F.G. receive royalties from Euroimmun for the clinical use of this test. The other authors report no competing interests.
Figures
References
-
- Grüter T, Möllers FE, Tietz A, et al. Clinical, serological and genetic predictors of response to immunotherapy in anti-IgLON5 disease. Brain. 2023;146:600–611. - PubMed
-
- Schöberl F, Levin J, Remi J, et al. IgLON5: A case with predominant cerebellar tau deposits and leptomeningeal inflammation. Neurology. 2018;91:180–182. - PubMed
Publication types
MeSH terms
Substances
Grants and funding
- 01GM1908D/German Federal Ministry of Education and Research
- 01GM1908D/Bundesministerium für Bildung und Forschung
- National Institute for Health Research
- The Stanford Autoimmune & Allergy Supergroup
- 104079/Z/14/Z/WT_/Wellcome Trust/United Kingdom
- U19 AI057229/AI/NIAID NIH HHS/United States
- Research and Innovative Technology Administration
- HIL-A03 BaoBab/Helmholtz Association
- HR22-00221/Caixa Research Health 2022
- Oxford Biomedical Research Centre
- European Reference Networks
- British Medical Association
- FI 2309/1-1/Deutsche Forschungsgemeinschaft
- P01 AI153559/AI/NIAID NIH HHS/United States
- Einstein Center for Neurosciences Berlin
- ANR-18-RHUS-0012/French National Research Agency
- NIH-5U01NS120885-02/NH/NIH HHS/United States
- R01 NS126227/NS/NINDS NIH HHS/United States
- NIHR
- US-UK Fulbright Commission
- Instituto de Salud Carlos III
- MR/V007173/1/MRC_/Medical Research Council/United Kingdom
- 22K07492/Neuromuscular Research Association Basel
- European Union's Horizon 2020
- Epilepsy Research UK
- Betty and David Koetser Foundation
- European Regional Development Fund
- WT_/Wellcome Trust/United Kingdom
- U01 NS120885/NS/NINDS NIH HHS/United States
- ANR-11-LABX-0042/LabEx CORTEX
- German-Academic Exchange Service
LinkOut - more resources
Full Text Sources
Research Materials
