. 2024 Feb 15;16(2):414-435.
doi: 10.4251/wjgo.v16.i2.414.

Early results of the integrative epigenomic-transcriptomic landscape of colorectal adenoma and cancer

Affiliations

Early results of the integrative epigenomic-transcriptomic landscape of colorectal adenoma and cancer

You-Wang Lu et al. World J Gastrointest Oncol. .

Abstract

Background: Aberrant methylation is common during the initiation and progression of colorectal cancer (CRC), and detecting these changes that occur during early adenoma (ADE) formation and CRC progression has clinical value.

Aim: To identify potential DNA methylation markers specific to ADE and CRC.

Methods: Here, we performed SeqCap targeted bisulfite sequencing and RNA-seq analysis of colorectal ADE and CRC samples to profile the epigenomic-transcriptomic landscape.

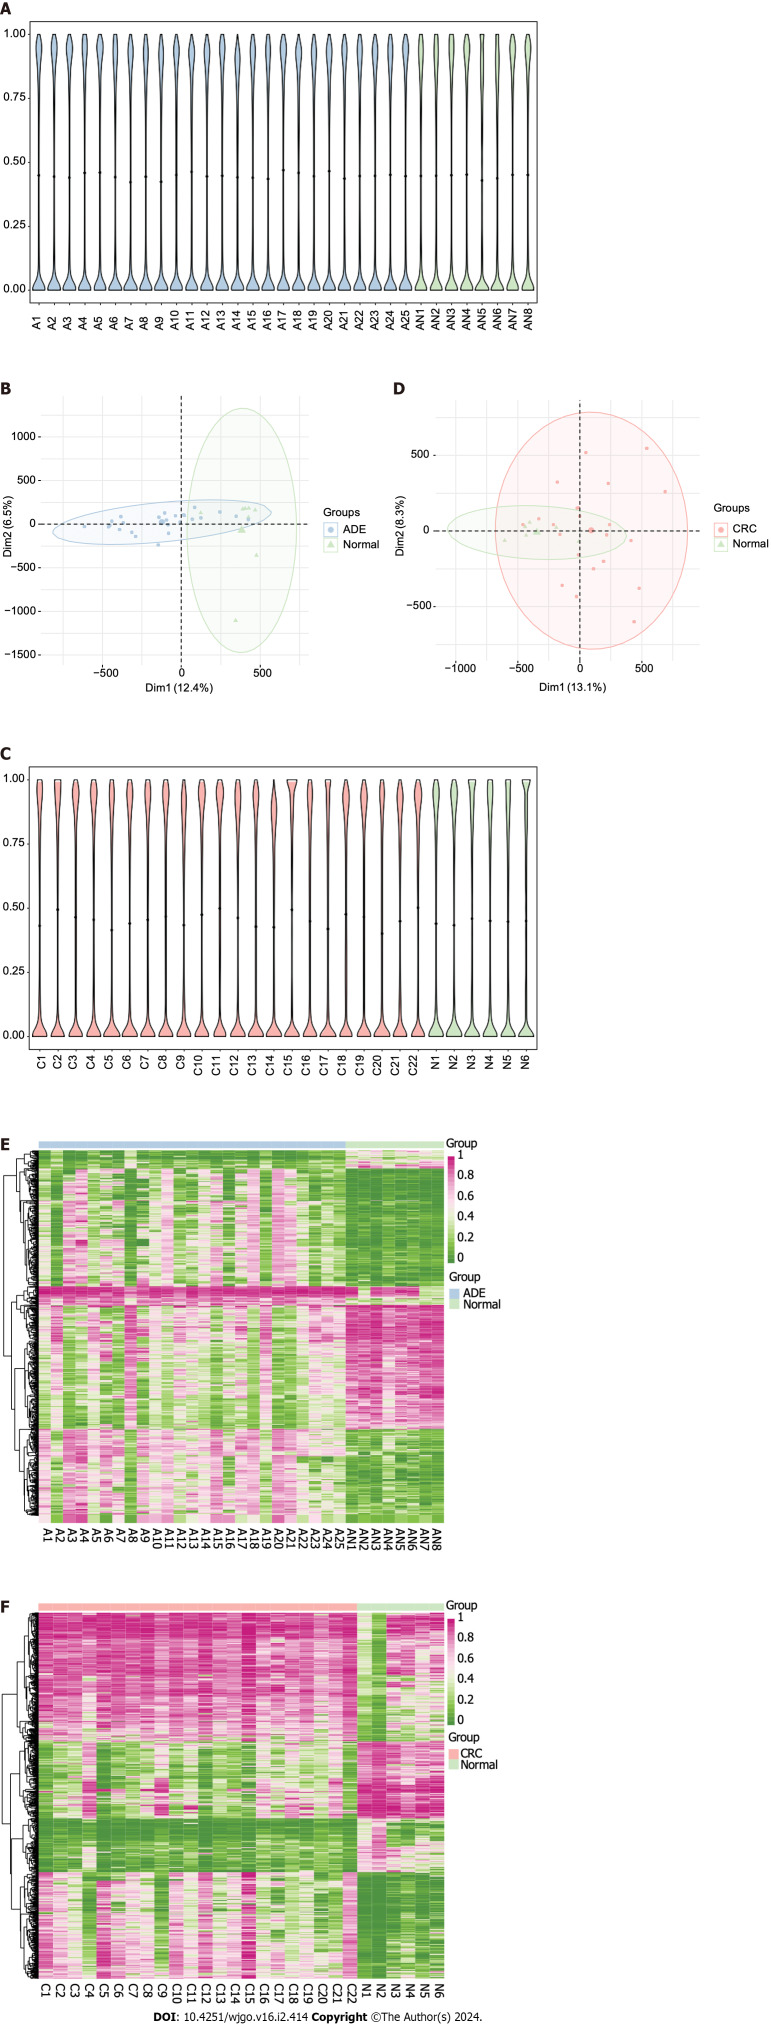
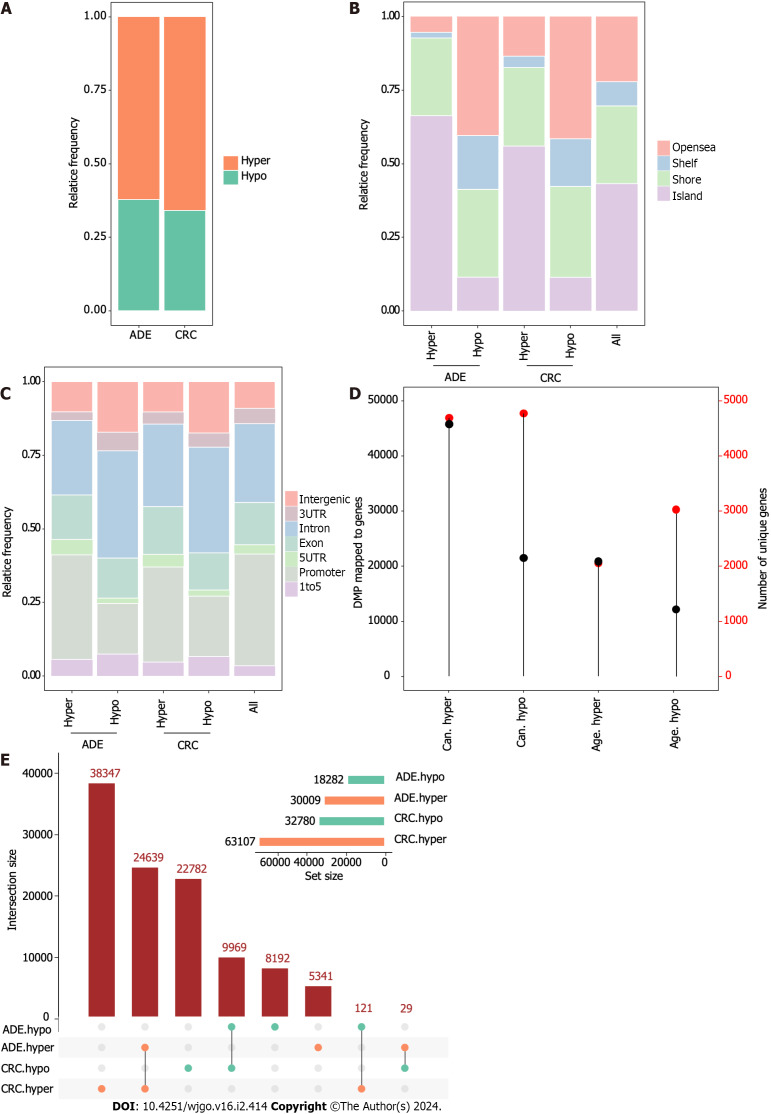
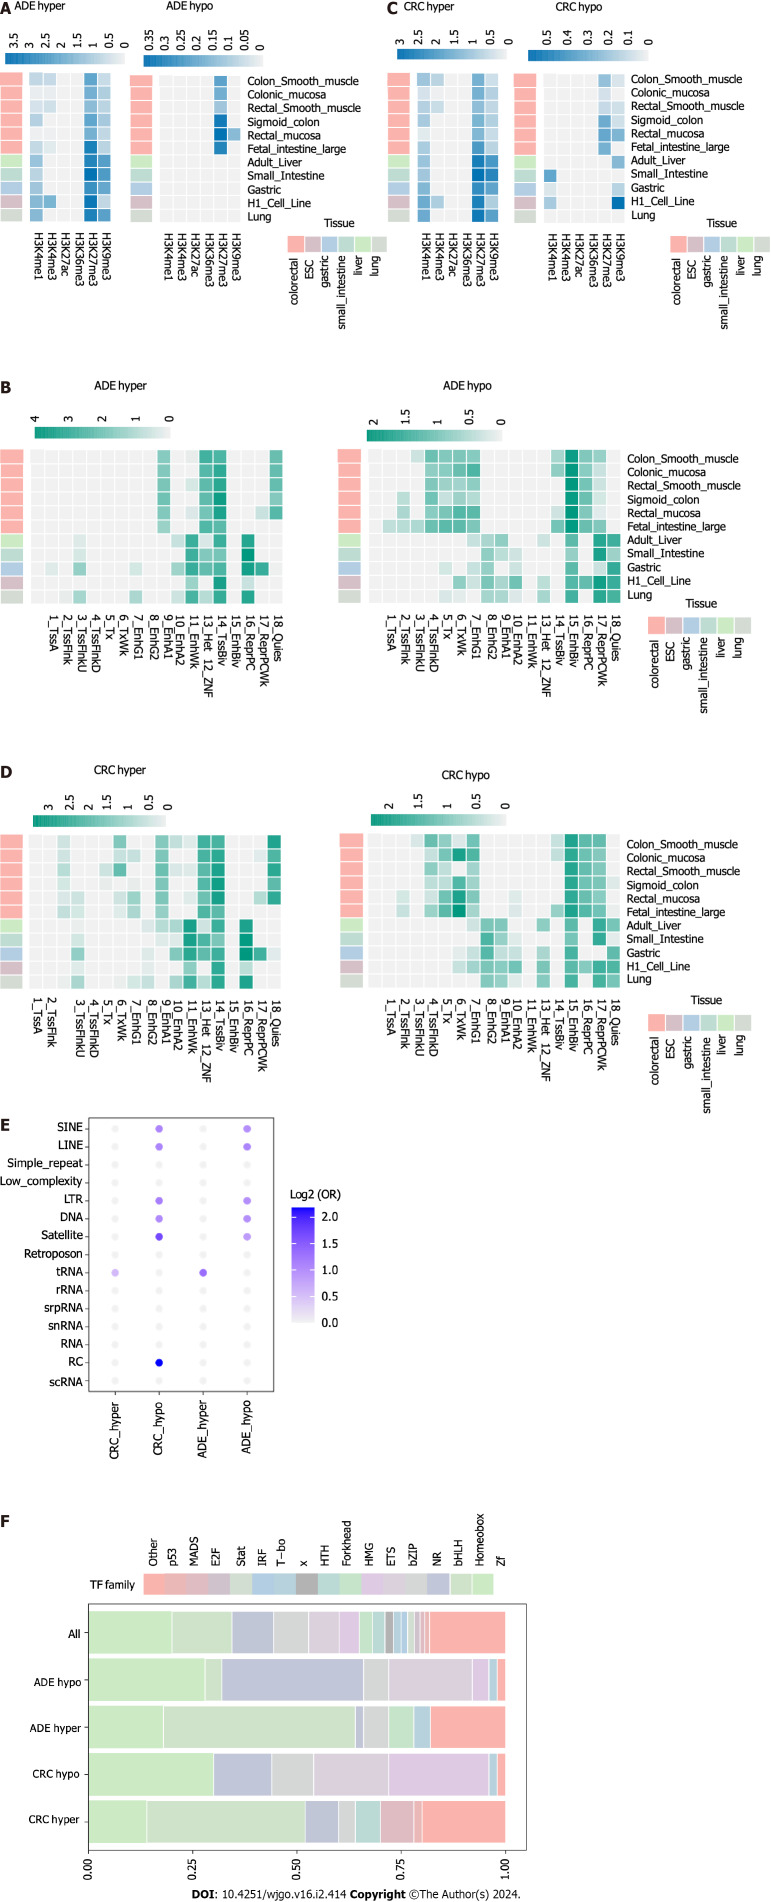
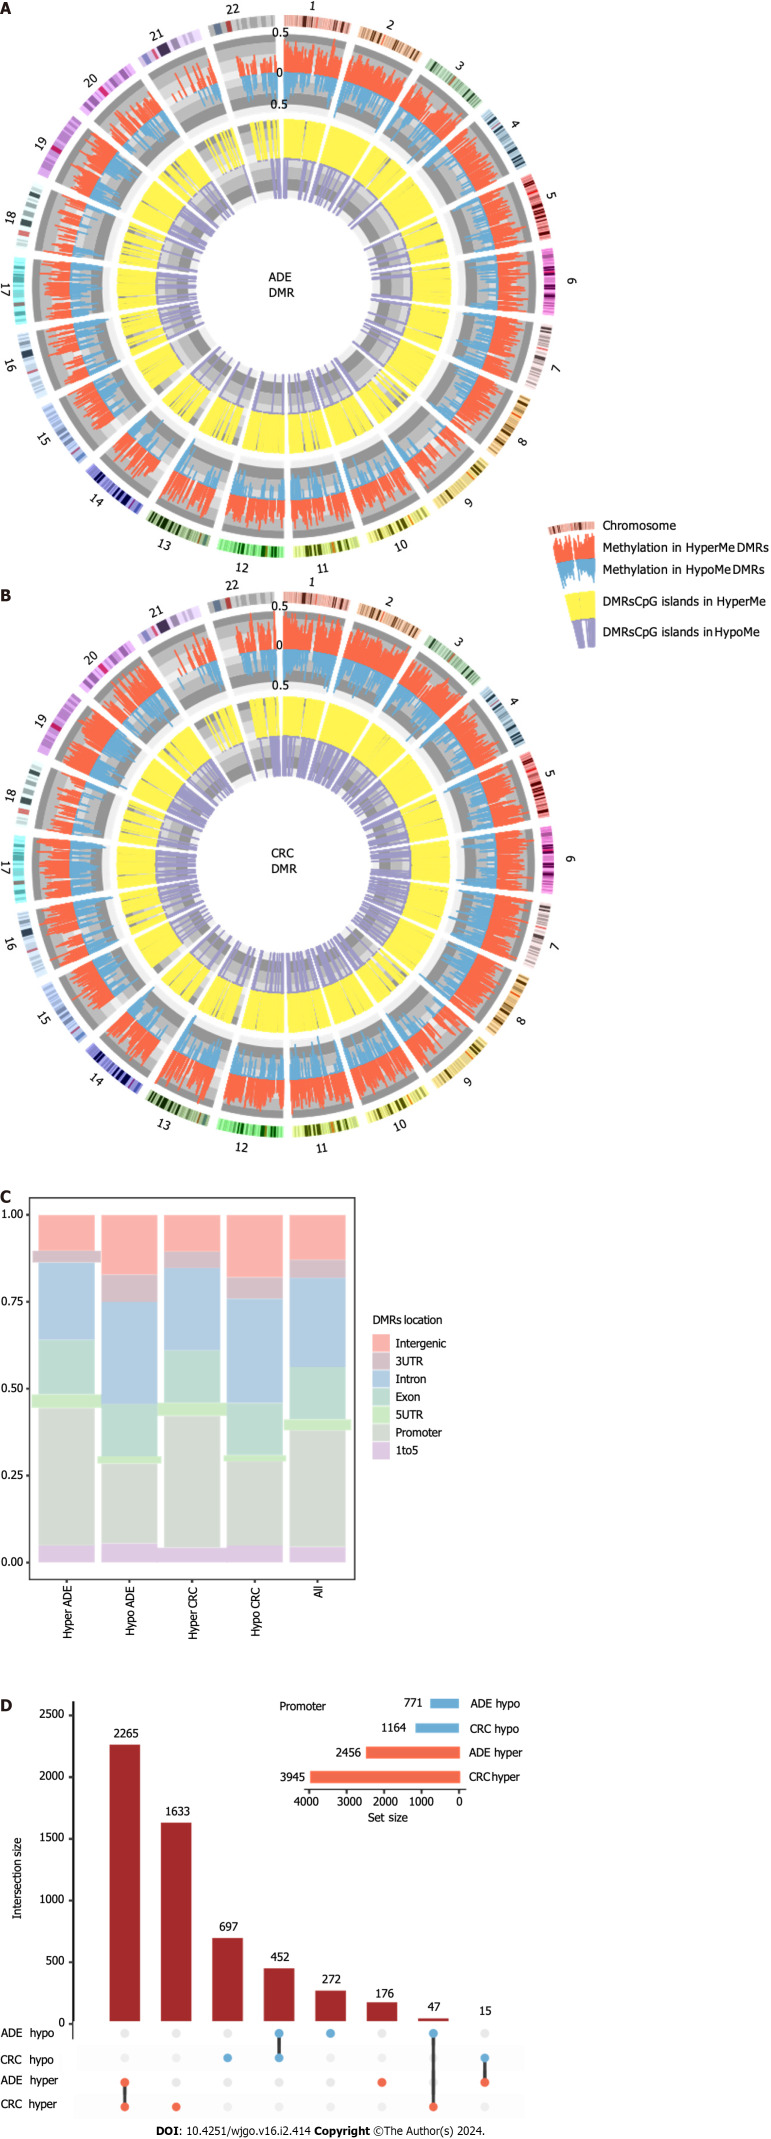
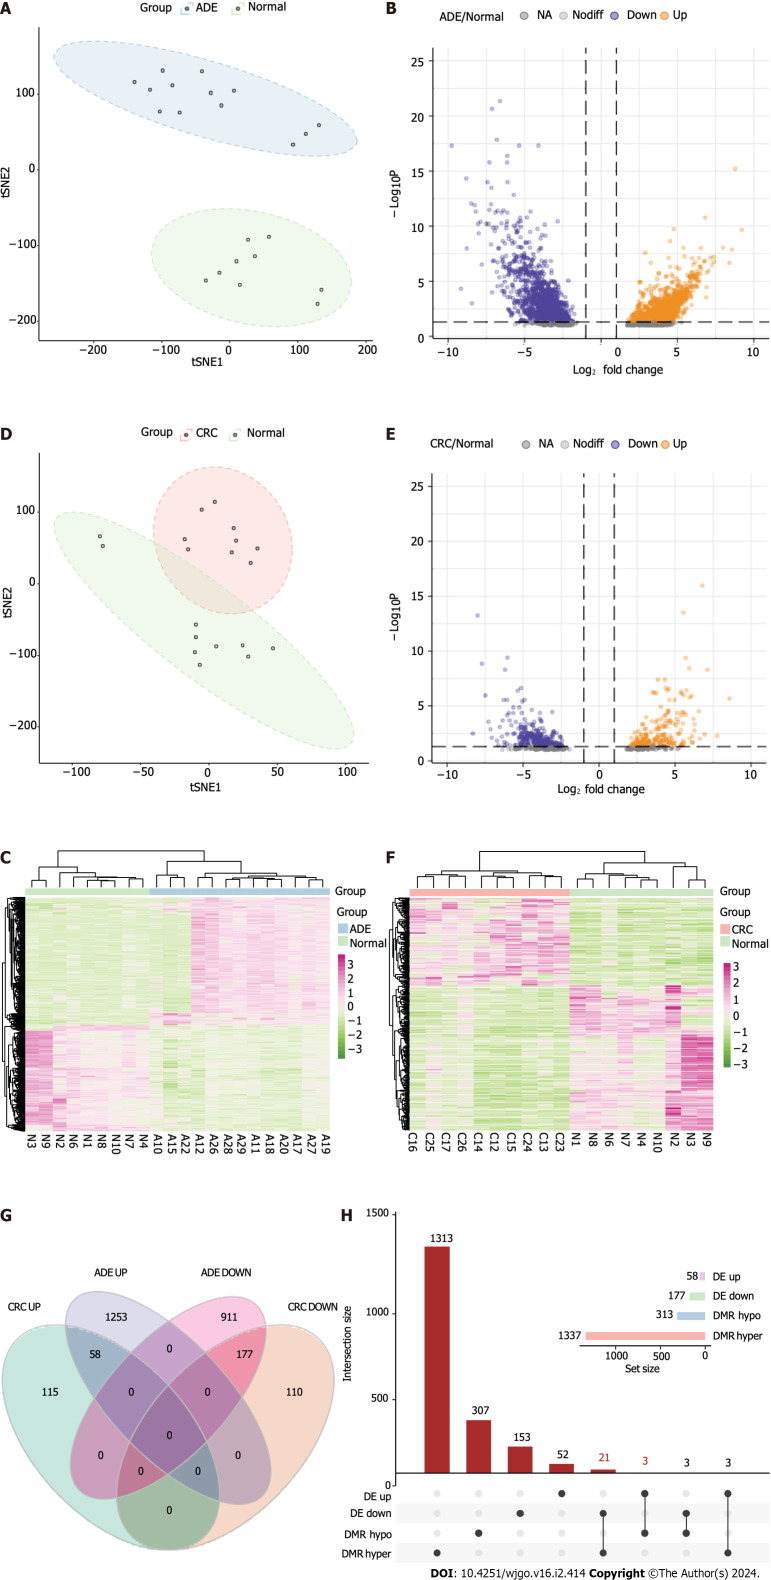
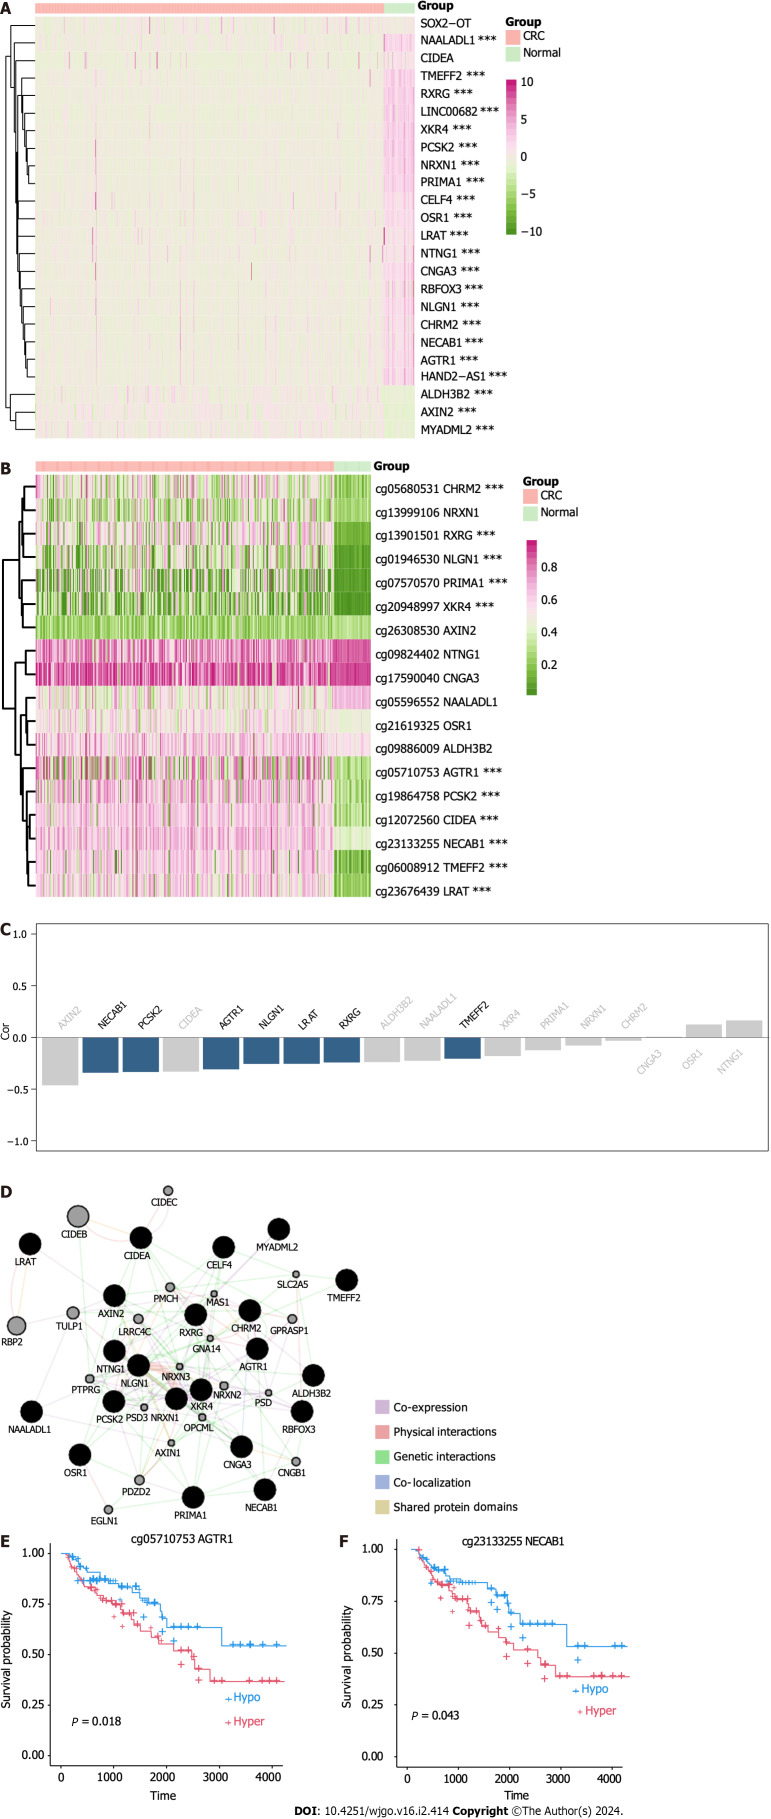
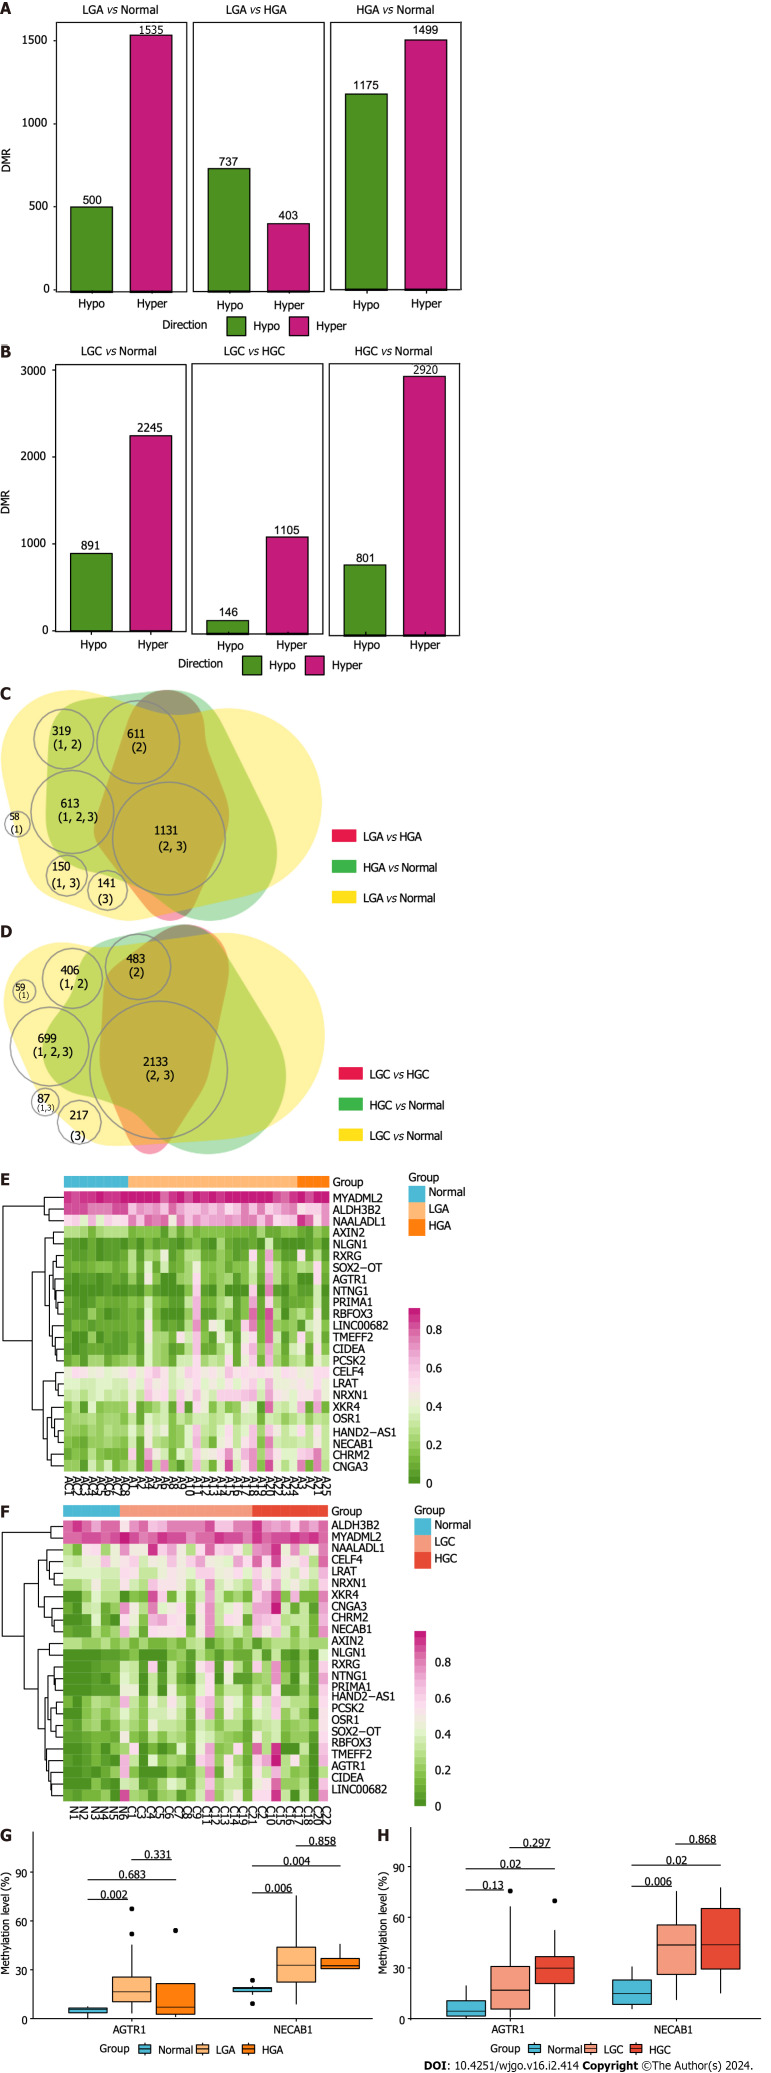
Results: Comparing 22 CRC and 25 ADE samples, global methylation was higher in the former, but both showed similar methylation patterns regarding differentially methylated gene positions, chromatin signatures, and repeated elements. High-grade CRC tended to exhibit elevated methylation levels in gene promoter regions compared to those in low-grade CRC. Combined with RNA-seq gene expression data, we identified 14 methylation-regulated differentially expressed genes, of which only AGTR1 and NECAB1 methylation had prognostic significance.

Conclusion: Our results suggest that genome-wide alterations in DNA methylation occur during the early stages of CRC and demonstrate the methylation signatures associated with colorectal ADEs and CRC, suggesting prognostic biomarkers for CRC.

Keywords: Colorectal cancer; Epigenomic alteration; Methylation-regulated differentially expressed genes; Transcriptome.


Conflict of interest statement

Conflict-of-interest statement: All the authors report no relevant conflicts of interest for this article.

Figures

Figure 1
Figure 1
Adenoma and colorectal cancer methylation landscapes. A: Violin plots of global methylation levels of all CpG sites across the adenoma (ADE) and normal samples (A, adenoma; AN, adjacent normal); B: Principal component analysis (PCA) plots of WGBS data showing the distribution of ADE and normal samples according to CpG site methylation levels; C: Violin plots of global levels of methylation of all CpG sites across colorectal cancer (CRC) and normal samples (C, colorectal cancer; N, normal); D: PCA plots of WGBS data showing the distribution of CRC and normal samples according to CpG site methylation levels; E: Heatmap of the methylation values of the top 1000 differentially methylated positions (DMPs) between the ADE and normal group; F: Heatmap of the methylation values of the top 1000 DMPs between the ADE and normal group. ADE: Adenoma; CRC: Colorectal cancer.
Figure 2
Figure 2
Differentially methylated positions in adenoma and colorectal cancer. A: Barplot showing the relative frequency of hypermethylated and hypomethylated differentially methylated positions (DMPs) in adenoma (ADE) and colorectal cancer; B and C: Barplots showing the distribution of DMPs on CpG island features and gene-region location features; D: Lollipop plots showing the number of DMPs (left vertical axis, black dots) with the number of genes to which DMPs were uniquely mapped (right vertical axis, red dots); E: UpSet plot indicating the size of DMP sets and the intersections based on their overlaps. ADE: Adenoma; CRC: Colorectal cancer; DMP: Differentially methylated position.
Figure 3
Figure 3
Chromatin landscape of adenoma and colorectal cancer methylation alterations. A: Heatmap of histone mark enrichment at adenoma (ADE) differentially methylated positions (DMPs); B: Heatmap of the enrichment of 18 states of chromatin at ADE DMPs; C: Heatmap of histone mark enrichment at colorectal cancer (CRC) DMPs; D: Heatmap of the enrichment of 18 states of chromatin at CRC DMPs; E: Bubble plots showing enrichment locations of repetitive DNA classes; F: Barplots showing the relative numbers of transcription factors at the genomic locations of ADE and CRC DMPs. Only the top 50 most significantly enriched factors from each set were selected.
Figure 4
Figure 4
Characteristics of differentially methylated regions. A: Circular plot of differentially methylated regions (DMRs) in adenoma; B: Circular plot of DMRs in colorectal cancer; C: Barplots showing the distribution of DMRs based on gene-region location features; D: UpSet plot indicating the DMR size of the sets and the intersections based on their overlaps. ADE: Adenoma; CRC: Colorectal cancer; DMRs: Differentially methylated regions.
Figure 5
Figure 5
Gene Ontology and Kyoto Encyclopedia of Genes and Genomes pathway enrichment analyses. A: The bar plot shows the Gene Ontology analysis of 1650 differentially methylated genes; B: Bubble plot showing the Kyoto Encyclopedia of Genes and Genomes analysis of differentially methylated genes. BP: Biological process; CC: Cellular component; MF: Molecular function; FDR: False discovery rate.
Figure 6
Figure 6
Methylation-regulated differentially expressed gene identification. A: t-Distributed Stochastic Neighbor Embedding (t-SNE) plot of adenoma (ADE) and normal samples; B: Volcano plot of differentially expressed genes (DEGs) (log2FC > 1, adjusted P < 0.05) between ADE and normal samples; C: Heatmap of DEGs between ADE and normal samples; D: t-SNE plot of colorectal cancer (CRC) and normal samples; E: Volcano plot of DEGs (log2FC > 1, adjusted P < 0.05) between CRC and normal samples; F: Heatmap of the DEGs between ADE and normal samples. The lower horizontal axis shows the sample names, the left vertical axis shows the clusters of DEGs, and the right vertical axis represents gene names. Red represents genes for which expression was upregulated, and green represents those for which expression was downregulated; G: Venn plot of DEGs between ADE and CRC; H: UpSet plot of methylation-regulated DEGs. t-SNE: t-Distributed Stochastic Neighbor Embedding; ADE: Adenoma; CRC: Colorectal cancer; DMRs: Differentially methylated regions.
Figure 7
Figure 7
Identification of methylation-silenced genes in the Colon Adenocarcinoma dataset. A: Heatmap of expression level of methylation-regulated differentially expressed genes (meDEGs) in the Colon Adenocarcinoma (COAD) dataset; B: Heatmap of meDEG methylation in the COAD dataset; C: Barplot of ranked correlations between meDEG expression and methylation in the COAD dataset; D: Protein-protein interaction network of the meDEGs, constructed using GeneMANIA; E: Kaplan-Meier plots of overall survival according to AGTR1 methylation; F: Kaplan-Meier plots of overall survival according to NECAB1 methylation. CRC: Colorectal cancer.
Figure 8
Figure 8
Genome-wide DNA methylation in colorectal cancer and adenoma of different grades. A: Differentially methylated regions (DMRs) between low-grade adenoma (LGA) and normal tissues, high-grade adenoma (HGA) and normal tissue, and HGA and LGA; B: DMRs between low-grade cancer (LGC) and normal tissues, high-grade cancer (HGC) and normal tissue, and HGC and LGC; C: Venn plot highlighting the relationships among all DMRs in ADE of different grades; D: Venn plot highlighting the relationships among all DMRs in CRC of different grades; E: The methylation-regulated differentially expressed gene (meDEG) methylation pattern in ADE of different grades; F: The meDEG methylation pattern in CRC of different grades; G: Expression level differences in AGTR1 and NECAB1 between different grades of ADE; H: Expression level differences in AGTR1 and NECAB1 between different grades of CRC. DMRs: Differentially methylated regions; LGA: Low-grade adenoma; HGA: High-grade adenoma; LGC: Low-grade cancer; HGC: High-grade cancer.

Similar articles

References

    1. Sung H, Ferlay J, Siegel RL, Laversanne M, Soerjomataram I, Jemal A, Bray F. Global Cancer Statistics 2020: GLOBOCAN Estimates of Incidence and Mortality Worldwide for 36 Cancers in 185 Countries. CA Cancer J Clin. 2021;71:209–249. - PubMed
    1. Chen W, Zheng R, Baade PD, Zhang S, Zeng H, Bray F, Jemal A, Yu XQ, He J. Cancer statistics in China, 2015. CA Cancer J Clin. 2016;66:115–132. - PubMed
    1. Nguyen LH, Goel A, Chung DC. Pathways of Colorectal Carcinogenesis. Gastroenterology. 2020;158:291–302. - PMC - PubMed
    1. Gu S, Lin S, Ye D, Qian S, Jiang D, Zhang X, Li Q, Yang J, Ying X, Li Z, Tang M, Wang J, Jin M, Chen K. Genome-wide methylation profiling identified novel differentially hypermethylated biomarker MPPED2 in colorectal cancer. Clin Epigenetics. 2019;11:41. - PMC - PubMed
    1. Beggs AD, Jones A, El-Bahrawy M, Abulafi M, Hodgson SV, Tomlinson IP. Whole-genome methylation analysis of benign and malignant colorectal tumours. J Pathol. 2013;229:697–704. - PMC - PubMed