

Dietary sodium acetate and sodium butyrate attenuate intestinal damage and improve lipid metabolism in juvenile largemouth bass (Micropterus salmoides) fed a high carbohydrate diet by reducing endoplasmic reticulum stress
- PMID: 38425445
- PMCID: PMC10901750
- DOI: 10.1016/j.aninu.2023.12.002
Dietary sodium acetate and sodium butyrate attenuate intestinal damage and improve lipid metabolism in juvenile largemouth bass (Micropterus salmoides) fed a high carbohydrate diet by reducing endoplasmic reticulum stress
Abstract
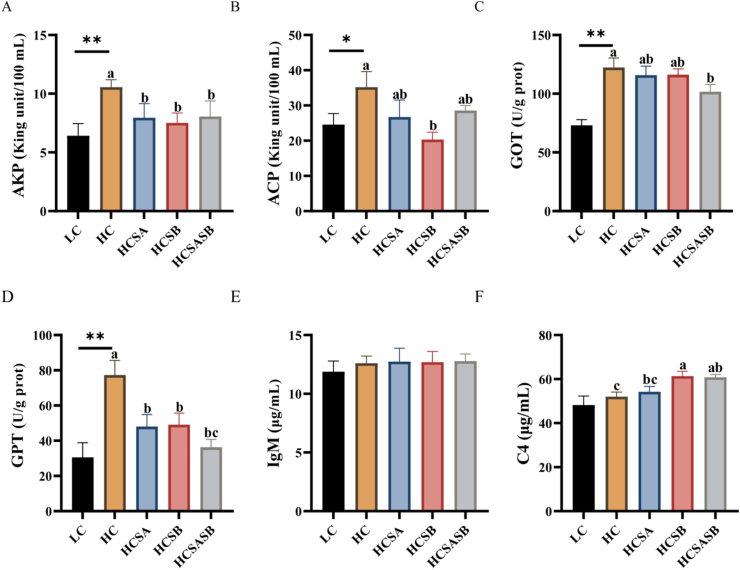
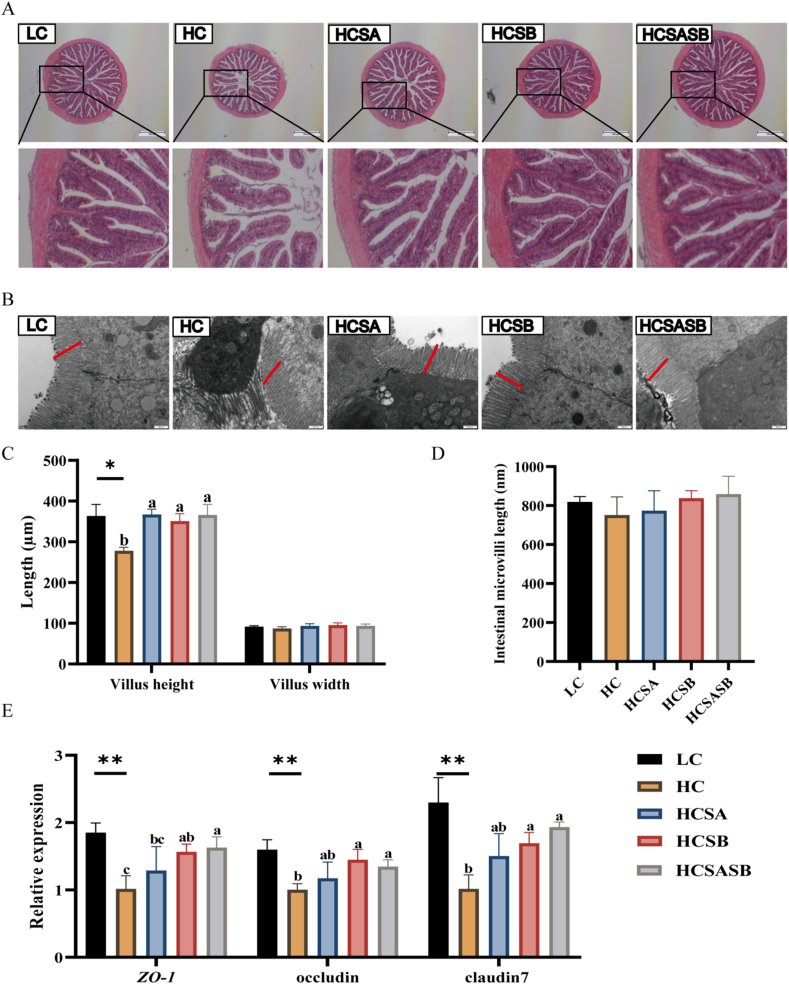
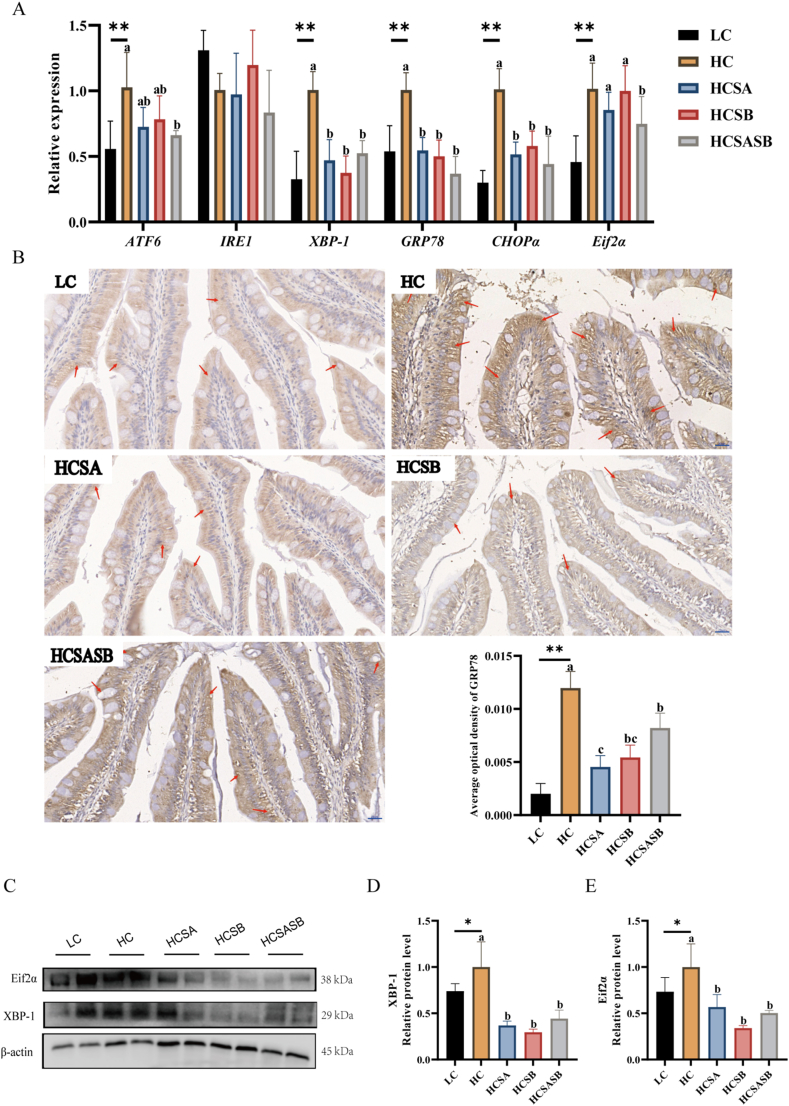
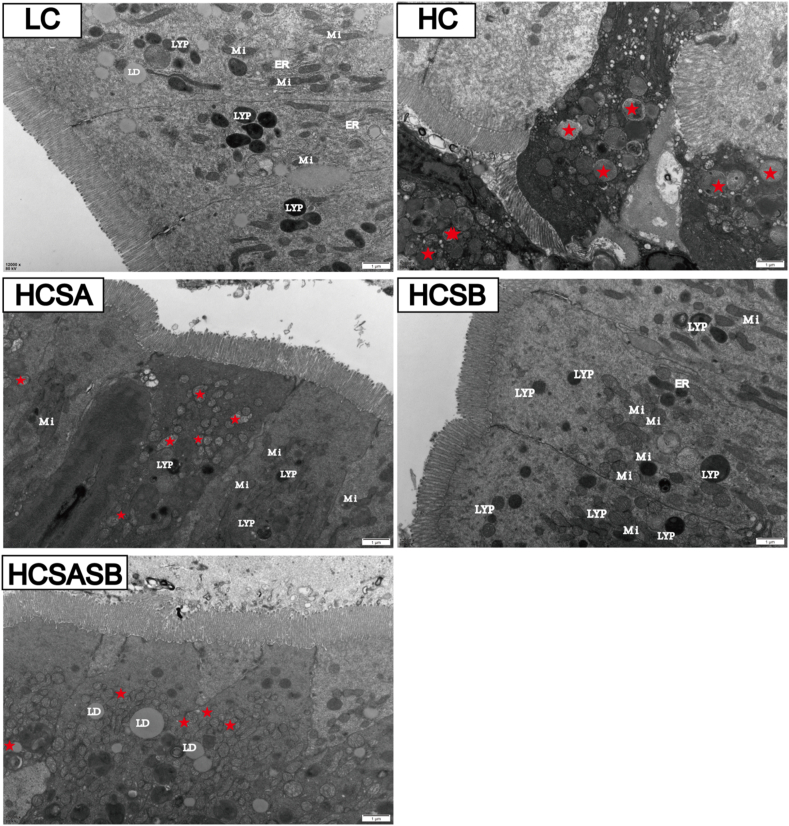
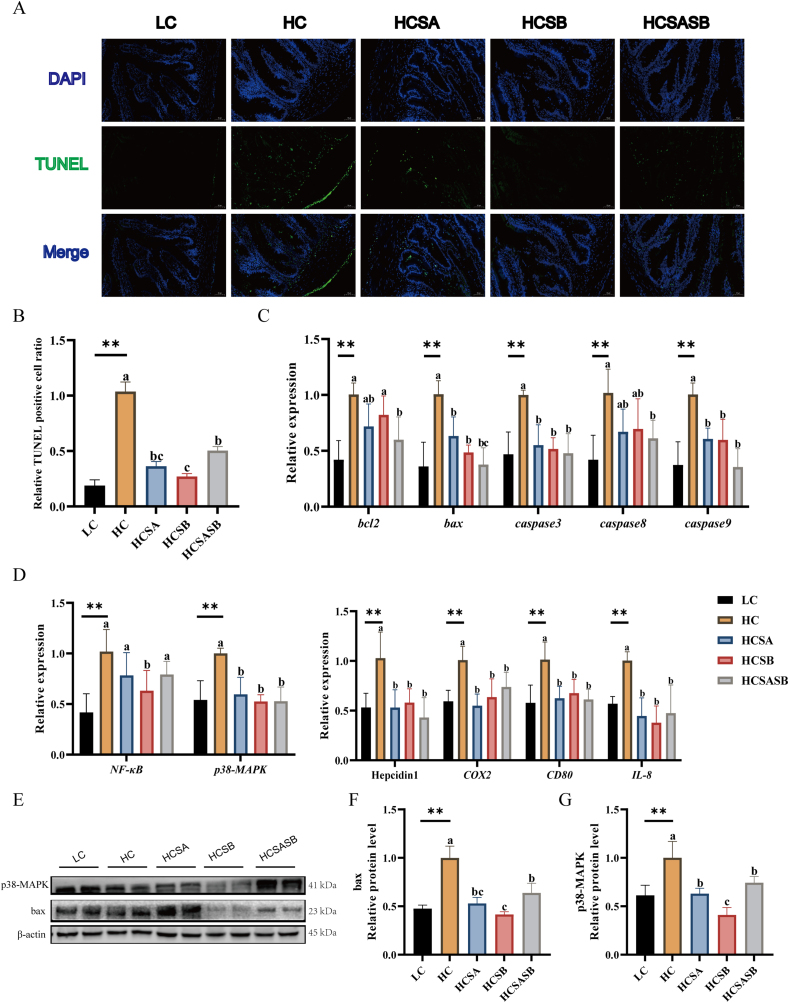
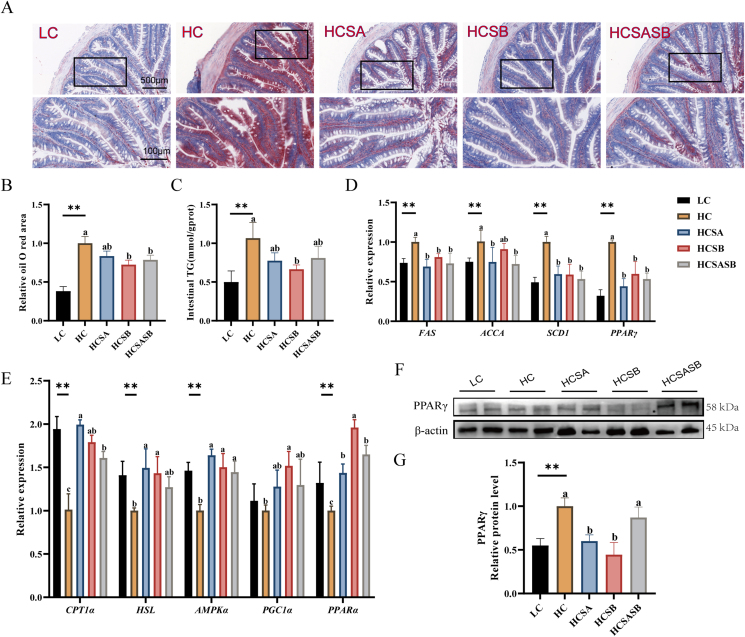
High-carbohydrate (HC) diets decrease the intestinal levels of sodium acetate (SA) and sodium butyrate (SB) and impair the gut health of largemouth bass; however, SA and SB have been shown to enhance immunity and improve intestinal health in farmed animals. Thus, the present study was to investigate the effects of dietary SA and SB on HC diet-induced intestinal injury and the potential mechanisms in juvenile largemouth bass. The experiment set five isonitrogenous and isolipidic diets, including a low-carbohydrate diet (9% starch) (LC), a high carbohydrate diet (18% starch) (HC), and the HC diet supplemented with 2 g/kg SA (HCSA), 2 g/kg SB (HCSB) or a combination of 1 g/kg SA and 1 g/kg SB (HCSASB). The feeding experiment was conducted for 8 weeks. A total of 525 juvenile largemouth bass with an initial body weight of 7.00 ± 0.20 g were used. The results showed that dietary SA and SB improved the weight gain rate and specific growth rate (P < 0.05) and ameliorated serum parameters (alkaline phosphatase, acid phosphatase, glutamate transaminase, and glutamic oxaloacetic transaminase) (P < 0.05). And, importantly, dietary SA and SB repaired the intestinal barrier by increasing the expression levels of zonula occludens-1, occludin, and claudin-7 (P < 0.05), reduced HC-induced intestinal damage, and alleviated intestinal inflammation and cell apoptosis by attenuating HC-induced intestinal endoplasmic reticulum stress (P < 0.05). Further results revealed that dietary SA and SB reduced HC-induced intestinal fat deposition by inhibiting adipogenesis and promoting lipolysis (P < 0.05). In summary, this study demonstrated that dietary SA and SB attenuated HC-induced intestinal damage and reduced excessive intestinal fat deposition in largemouth bass.
Keywords: Endoplasmic reticulum stress; High carbohydrate diet; Intestine health; Lipid metabolism; Sodium acetate; Sodium butyrate.
© 2024 The Authors.
Conflict of interest statement
We declare that we have no financial and personal relationships with other people or organizations that can inappropriately influence our work, and there is no professional or other personal interest of any nature or kind in any product, service and/or company that could be construed as influencing the content of this paper.
Figures
Similar articles
-
Dietary sodium acetate and sodium butyrate improve high-carbohydrate diet utilization by regulating gut microbiota, liver lipid metabolism, oxidative stress, and inflammation in largemouth bass (Micropterus salmoides).J Anim Sci Biotechnol. 2024 Apr 3;15(1):50. doi: 10.1186/s40104-024-01009-4. J Anim Sci Biotechnol. 2024. PMID: 38566217 Free PMC article.
-
A High Starch Diet Alters the Composition of the Intestinal Microbiota of Largemouth Bass Micropterus salmoides, Which May Be Associated With the Development of Enteritis.Front Microbiol. 2021 Jul 8;12:696588. doi: 10.3389/fmicb.2021.696588. eCollection 2021. Front Microbiol. 2021. PMID: 34305862 Free PMC article.
-
Dietary berberine alleviates high carbohydrate diet-induced intestinal damages and improves lipid metabolism in largemouth bass (Micropterus salmoides).Front Nutr. 2022 Sep 23;9:1010859. doi: 10.3389/fnut.2022.1010859. eCollection 2022. Front Nutr. 2022. PMID: 36211485 Free PMC article.
-
Intestinal flora and immunity response to different viscous diets in juvenile largemouth bass, Micropterus salmoides.Fish Shellfish Immunol. 2022 Aug;127:1012-1023. doi: 10.1016/j.fsi.2022.06.054. Epub 2022 Jul 19. Fish Shellfish Immunol. 2022. PMID: 35863540
-
Effects of bioprocessed soybean meal and nucleotide supplementation on growth, physiology and histomorphology in largemouth bass, Micropterus salmoides, juveniles.Comp Biochem Physiol A Mol Integr Physiol. 2021 Oct;260:111038. doi: 10.1016/j.cbpa.2021.111038. Epub 2021 Jul 13. Comp Biochem Physiol A Mol Integr Physiol. 2021. PMID: 34271205 Review.
Cited by
-
Dietary sodium acetate and sodium butyrate improve high-carbohydrate diet utilization by regulating gut microbiota, liver lipid metabolism, oxidative stress, and inflammation in largemouth bass (Micropterus salmoides).J Anim Sci Biotechnol. 2024 Apr 3;15(1):50. doi: 10.1186/s40104-024-01009-4. J Anim Sci Biotechnol. 2024. PMID: 38566217 Free PMC article.
-
Dietary succinic acid mitigates adverse effects of starch high-starch diet in largemouth bass (Micropterus salmoides) through gut-liver axis modulation.Fish Physiol Biochem. 2025 Aug 13;51(4):142. doi: 10.1007/s10695-025-01557-0. Fish Physiol Biochem. 2025. PMID: 40802136
-
Unlocking the power of short-chain fatty acids in ameliorating intestinal mucosal immunity: a new porcine nutritional approach.Front Cell Infect Microbiol. 2024 Sep 2;14:1449030. doi: 10.3389/fcimb.2024.1449030. eCollection 2024. Front Cell Infect Microbiol. 2024. PMID: 39286812 Free PMC article. Review.
References
-
- Abdel-Mohsen H.H., Wassef E.A., El-Bermawy N.M., Abdel-Meguid N.E., Saleh N.E., Barakat K.M., et al. Advantageous effects of dietary butyrate on growth, immunity response, intestinal microbiota and histomorphology of European Seabass (Dicentrarchus labrax) fry. Egypt J Aquat Biol Fish. 2018;22(4):93–110.
-
- Abdel-Tawwab M., Shukry M., Farrag F.A., El-Shafai N.M., Dawood M.A., Abdel-Latif H.M. Dietary sodium butyrate nanoparticles enhanced growth, digestive enzyme activities, intestinal histomorphometry, and transcription of growth-related genes in Nile tilapia juveniles. Aquaculture. 2021;536
-
- Adeyanju O.A., Badejogbin O.C., Areola D.E., Olaniyi K.S., Dibia C., Soetan O.A., et al. Sodium butyrate arrests pancreato-hepatic synchronous uric acid and lipid dysmetabolism in high fat diet fed Wistar rats. Biomed Pharmacother. 2021;133 - PubMed
-
- Ali M.Z., Jauncey K. Optimal dietary carbohydrate to lipid ratio in African catfish Clarias gariepinus (Burchell 1822) Aquac Int. 2004;12:169–180.
-
- AOAC . 18th ed. AOAC International; Gaithersburg, MD: 2005. Official Methods of Analysis.
LinkOut - more resources
Full Text Sources
