

A 30-year trend of dairy consumption and its determinants among income groups in Iranian households
- PMID: 38425466
- PMCID: PMC10903262
- DOI: 10.3389/fpubh.2024.1261293
A 30-year trend of dairy consumption and its determinants among income groups in Iranian households
Abstract
Introduction: Milk and dairy products provide essential nutrients and have the potential to prevent chronic diseases, thus reducing healthcare costs. However, there is a lack of consistent and updated data on dairy consumption trends in Iran. This study aims to analyze the trends in dairy consumption among Iranian households from 1991 to 2021, focusing on household-level determinants across different expense groups.
Methods: The study uses data from the Iranian Household Expenditure and Income Survey conducted annually from 1991 to 2021 to analyze households' dairy consumption. The data includes values and expenses of food and non-food items purchased in the previous month, as well as demographic characteristics of household members. The households were categorized into 10 deciles based on their gross expense. The econometric model used weighted mean per capita milk, yogurt, cheese, and total dairy consumption based on milk equivalent for each decile. The model takes into account changes in income, prices, household composition, education level, occupation, and residency area using panel data. Data preparation and model estimation were performed using RStudio and STATA17 software.
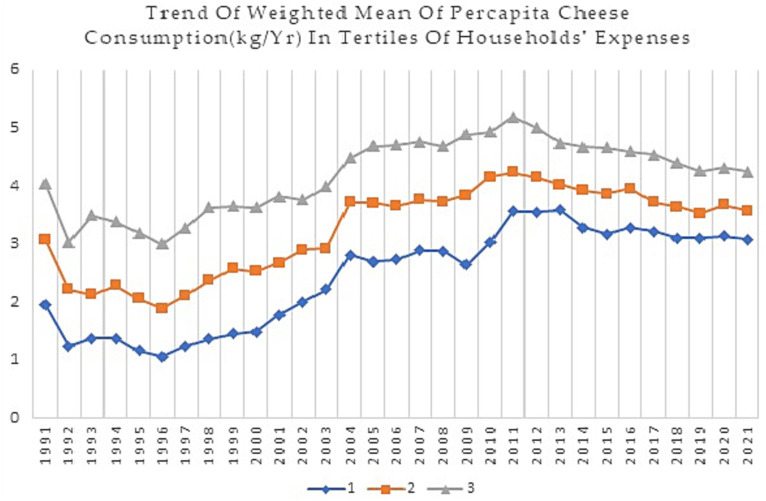
Results: Based on the findings, in 1991, per capita milk, yogurt, and cheese consumption were 26.77 kg, 16.63 kg, and 2.42 kg, respectively. By 2021, these figures changed to 22.68 kg, 11.06 kg, and 3.79 kg, reflecting a decrease in milk and yogurt consumption but an increase in cheese consumption. Family size was positively correlated with yogurt consumption and head of the household spouse's job score were positively correlated with milk, yogurt and cheese consumption. Also, the presence of under five-year-old children and older adults members (over the age of 60) in the household was inversely related with yogurt and cheese consumption. Female-headed households tended to purchase more cheese, while their milk purchase level was significantly lower. Residing in urban areas was negatively related to milk, while cheese and total dairy consumption was higher in urban areas.
Discussion: The findings highlight the importance of targeted dairy subsidy interventions and educational programs to improve dairy consumption in Iranian households, especially among vulnerable groups. This will require urging policymakers and food system stakeholders for effective strategies that address macro-level factors to promote dairy consumption.
Keywords: dairy consumption; determinants; household; panel analysis; per capita; policy; sanction.
Copyright © 2024 Roustaee, Eini-Zinab, Ghodsi, Mehrparvar Hosseini, Omidvar, Hosseini, Hosseini Mousavi and Rafiee.
Conflict of interest statement
The authors declare that the research was conducted in the absence of any commercial or financial relationships that could be construed as a potential conflict of interest.
Figures


Similar articles
-
COVID-19 epidemic lockdown-induced remarkable decrease in dairy products consumption of Iran population: does it really matter? National Food and Nutrition Surveillance.BMC Nutr. 2022 Oct 27;8(1):122. doi: 10.1186/s40795-022-00612-w. BMC Nutr. 2022. PMID: 36303239 Free PMC article.
-
Association between dairy intake and risk of incident dementia: the Ohsaki Cohort 2006 Study.Eur J Nutr. 2023 Oct;62(7):2751-2761. doi: 10.1007/s00394-023-03189-7. Epub 2023 Jun 19. Eur J Nutr. 2023. PMID: 37335358
-
Gut Microbiome Diversity and Composition Are Associated with Habitual Dairy Intakes: A Cross-Sectional Study in Men.J Nutr. 2021 Nov 2;151(11):3400-3412. doi: 10.1093/jn/nxab252. J Nutr. 2021. PMID: 34386821
-
Systematic review and meta-analysis of the association between dairy consumption and the risk of hip fracture: critical interpretation of the currently available evidence.Osteoporos Int. 2020 Aug;31(8):1411-1425. doi: 10.1007/s00198-020-05383-3. Epub 2020 May 7. Osteoporos Int. 2020. PMID: 32383066
-
Dairy Product Consumption in the Prevention of Metabolic Syndrome: A Systematic Review and Meta-Analysis of Prospective Cohort Studies.Adv Nutr. 2019 May 1;10(suppl_2):S144-S153. doi: 10.1093/advances/nmy083. Adv Nutr. 2019. PMID: 31089736 Free PMC article.
Cited by
-
Salt Contents in Fermented Dairy Products: A Strategic Blueprint for Healthier Intake.Food Sci Nutr. 2025 Jan 15;13(1):e4762. doi: 10.1002/fsn3.4762. eCollection 2025 Jan. Food Sci Nutr. 2025. PMID: 39816482 Free PMC article.
-
Dietary changes during the COVID-19 lockdown in Iranian households: are we witnessing a secular trend? A narrative review.Front Public Health. 2024 Oct 25;12:1485423. doi: 10.3389/fpubh.2024.1485423. eCollection 2024. Front Public Health. 2024. PMID: 39525458 Free PMC article. Review.
-
Urban and rural residence: their influence on food group consumption in Iran.BMC Public Health. 2025 Jan 15;25(1):169. doi: 10.1186/s12889-024-21211-3. BMC Public Health. 2025. PMID: 39815251 Free PMC article.
-
Econometric analysis of consumers' preference heterogeneity for yoghurt and ice cream products in Tanzania: A latent class model and mixed logit model.Heliyon. 2024 Nov 23;10(23):e40666. doi: 10.1016/j.heliyon.2024.e40666. eCollection 2024 Dec 15. Heliyon. 2024. PMID: 39669159 Free PMC article.
-
Physical Activity, Taste Preferences, Selected Socioeconomic Characteristics: Differentiators of Consumer Behavior Among Older Adults in the Dairy Market in Poland-A Pilot Study.Nutrients. 2025 Mar 24;17(7):1127. doi: 10.3390/nu17071127. Nutrients. 2025. PMID: 40218885 Free PMC article.
References
-
- Elwood PC, Givens DI, Beswick AD, Fehily AM, Pickering JE, Gallacher J. The survival advantage of milk and dairy consumption: an overview of evidence from cohort studies of vascular diseases, diabetes and cancer. J Am Coll Nutr. (2008) 27:723s–34s. doi: 10.1080/07315724.2008.10719750, PMID: - DOI - PubMed
-
- Rozenberg S, Body J-J, Bruyere O, Bergmann P, Brandi ML, Cooper C, et al. . Effects of dairy products consumption on health: benefits and beliefs—a commentary from the Belgian bone Club and the European Society for Clinical and Economic Aspects of osteoporosis, osteoarthritis and musculoskeletal diseases. Calcif Tissue Int. (2016) 98:1–17. doi: 10.1007/s00223-015-0062-x, PMID: - DOI - PMC - PubMed
-
- Department of Community Nutrition . (2015). Food-based dietary guidelines – Iran [online]. Ministry of Health and Medical Education. Available at: http://www.fao.org/nutrition/education/food-dietary-guidelines/regions/c...
Publication types
MeSH terms
LinkOut - more resources
Full Text Sources