A role for TRPC3 in mammalian testis development
- PMID: 38425503
- PMCID: PMC10902130
- DOI: 10.3389/fcell.2024.1337714
A role for TRPC3 in mammalian testis development
Erratum in
-
Corrigendum: A role for TRPC3 in mammalian testis development.Front Cell Dev Biol. 2024 Oct 15;12:1484634. doi: 10.3389/fcell.2024.1484634. eCollection 2024. Front Cell Dev Biol. 2024. PMID: 39474354 Free PMC article.
Abstract
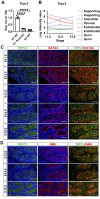
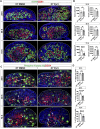
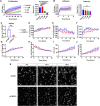
SOX9 is a key transcription factor for testis determination and development. Mutations in and around the SOX9 gene contribute to Differences/Disorders of Sex Development (DSD). However, a substantial proportion of DSD patients lack a definitive genetic diagnosis. SOX9 target genes are potentially DSD-causative genes, yet only a limited subset of these genes has been investigated during testis development. We hypothesize that SOX9 target genes play an integral role in testis development and could potentially be causative genes in DSD. In this study, we describe a novel testicular target gene of SOX9, Trpc3. Trpc3 exhibits high expression levels in the SOX9-expressing male Sertoli cells compared to female granulosa cells in mouse fetal gonads between embryonic day 11.5 (E11.5) and E13.5. In XY Sox9 knockout gonads, Trpc3 expression is markedly downregulated. Moreover, culture of E11.5 XY mouse gonads with TRPC3 inhibitor Pyr3 resulted in decreased germ cell numbers caused by reduced germ cell proliferation. Trpc3 is also expressed in endothelial cells and Pyr3-treated E11.5 XY mouse gonads showed a loss of the coelomic blood vessel due to increased apoptosis of endothelial cells. In the human testicular cell line NT2/D1, TRPC3 promotes cell proliferation and controls cell morphology, as observed by xCELLigence and HoloMonitor real-time analysis. In summary, our study suggests that SOX9 positively regulates Trpc3 in mouse testes and TRPC3 may mediate SOX9 function during Sertoli, germ and endothelial cell development.
Keywords: DSD; SOX9; TRP; TRPC3; sertoli cells; sex determination; testis.
Copyright © 2024 Ming, Bagheri-Fam, Frost, Ryan and Harley.
Conflict of interest statement
The authors declare that the research was conducted in the absence of any commercial or financial relationships that could be construed as a potential conflict of interest.
Figures


Similar articles
-
SOX9 regulates expression of the male fertility gene Ets variant factor 5 (ETV5) during mammalian sex development.Int J Biochem Cell Biol. 2016 Oct;79:41-51. doi: 10.1016/j.biocel.2016.08.005. Epub 2016 Aug 4. Int J Biochem Cell Biol. 2016. PMID: 27498191
-
Sox8 and Sox9 act redundantly for ovarian-to-testicular fate reprogramming in the absence of R-spondin1 in mouse sex reversals.Elife. 2020 May 26;9:e53972. doi: 10.7554/eLife.53972. Elife. 2020. PMID: 32450947 Free PMC article.
-
FOXL2 and SOX9 as parameters of female and male gonadal differentiation in patients with various forms of disorders of sex development (DSD).J Pathol. 2008 May;215(1):31-8. doi: 10.1002/path.2335. J Pathol. 2008. PMID: 18348162
-
Sox9 in testis determination.Ann N Y Acad Sci. 2005 Dec;1061:9-17. doi: 10.1196/annals.1336.003. Ann N Y Acad Sci. 2005. PMID: 16467253 Review.
-
The Chromatin State during Gonadal Sex Determination.Sex Dev. 2021;15(5-6):308-316. doi: 10.1159/000520007. Epub 2021 Nov 9. Sex Dev. 2021. PMID: 34753132 Free PMC article. Review.
Cited by
-
Modeling of cancer stem cells and the tumor microenvironment Via NT2/D1 cells to probe pathology and treatment for cancer and beyond.Discov Oncol. 2025 Apr 24;16(1):605. doi: 10.1007/s12672-025-02158-2. Discov Oncol. 2025. PMID: 40272656 Free PMC article. Review.
-
Genetic and genomic insights into male reproductive tract development.Fertil Steril. 2025 Jun;123(6):970-979. doi: 10.1016/j.fertnstert.2025.03.024. Epub 2025 Mar 31. Fertil Steril. 2025. PMID: 40174856
References
-
- Barrionuevo F., Georg I., Scherthan H., Lécureuil C., Guillou F., Wegner M., et al. (2009). Testis cord differentiation after the sex determination stage is independent of Sox9 but fails in the combined absence of Sox9 and Sox8. Dev. Biol. 327 (2), 301–312. 10.1016/j.ydbio.2008.12.011 - DOI - PubMed
LinkOut - more resources
Full Text Sources
Molecular Biology Databases
Research Materials

