. 2023 Oct 20;5(6):fcad283.
doi: 10.1093/braincomms/fcad283. eCollection 2023.

Epilepsy and sudden unexpected death in epilepsy in a mouse model of human SCN1B-linked developmental and epileptic encephalopathy

Affiliations

Epilepsy and sudden unexpected death in epilepsy in a mouse model of human SCN1B-linked developmental and epileptic encephalopathy

Chunling Chen et al. Brain Commun. .

Erratum in

Abstract

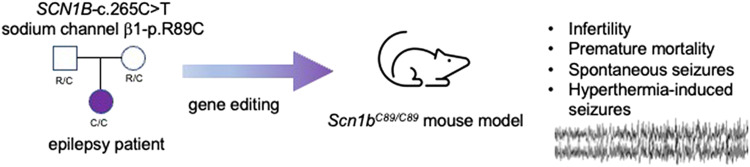
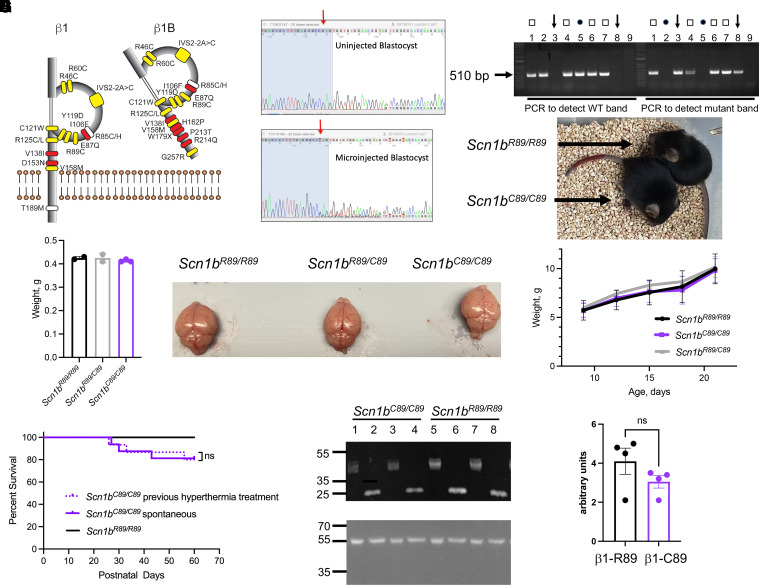
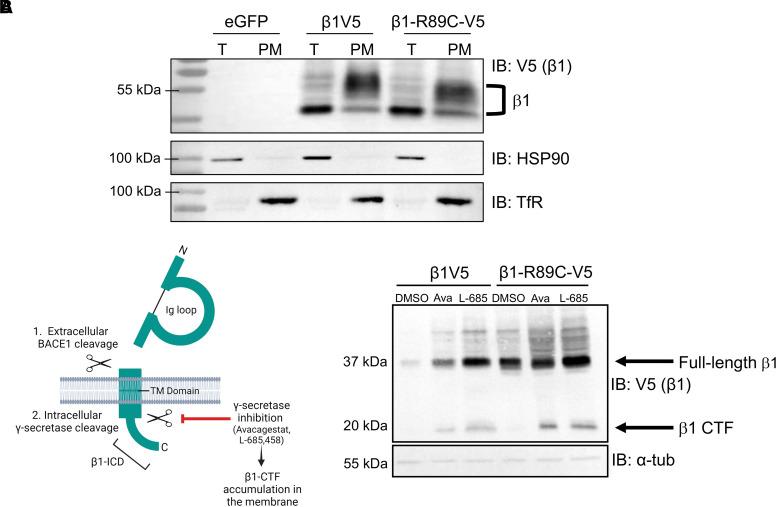
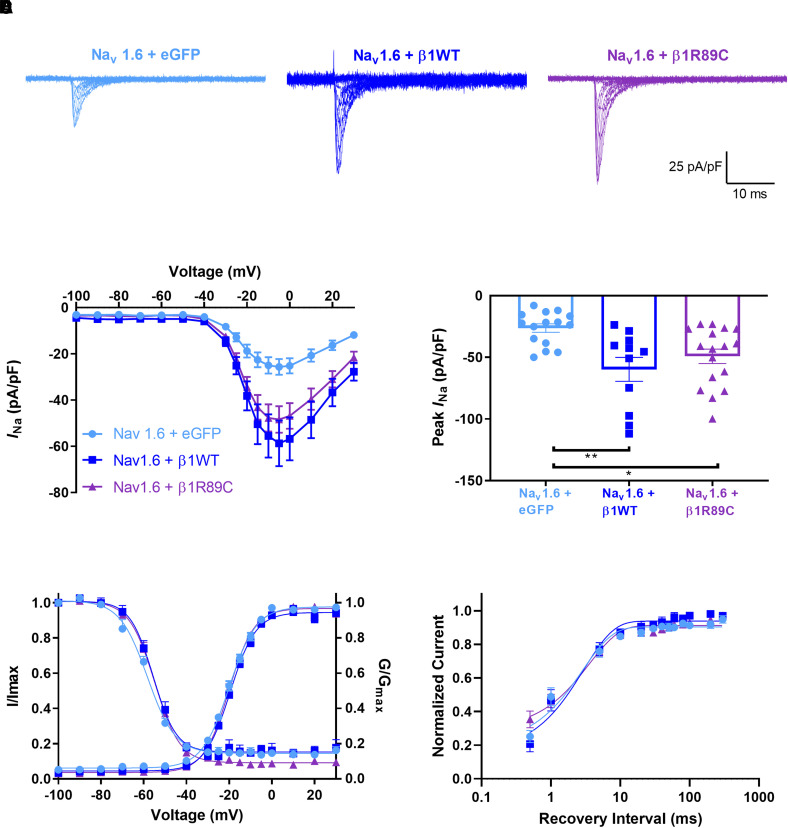
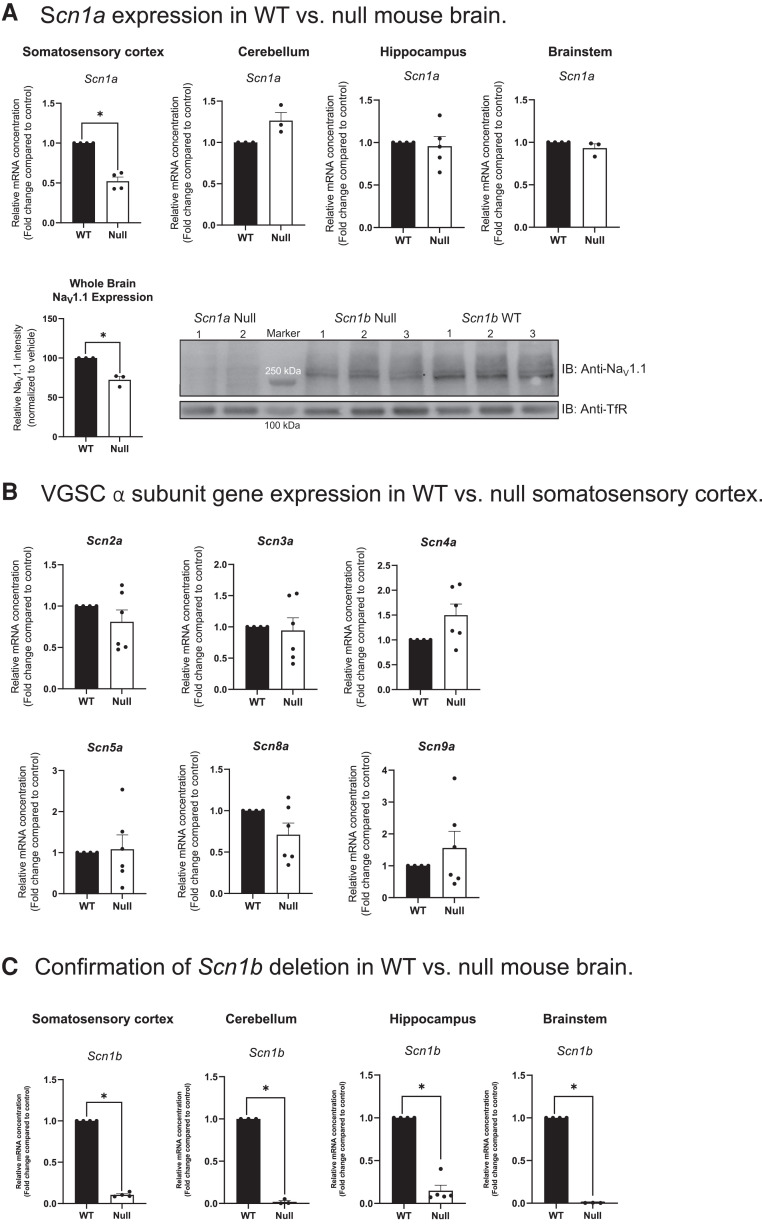
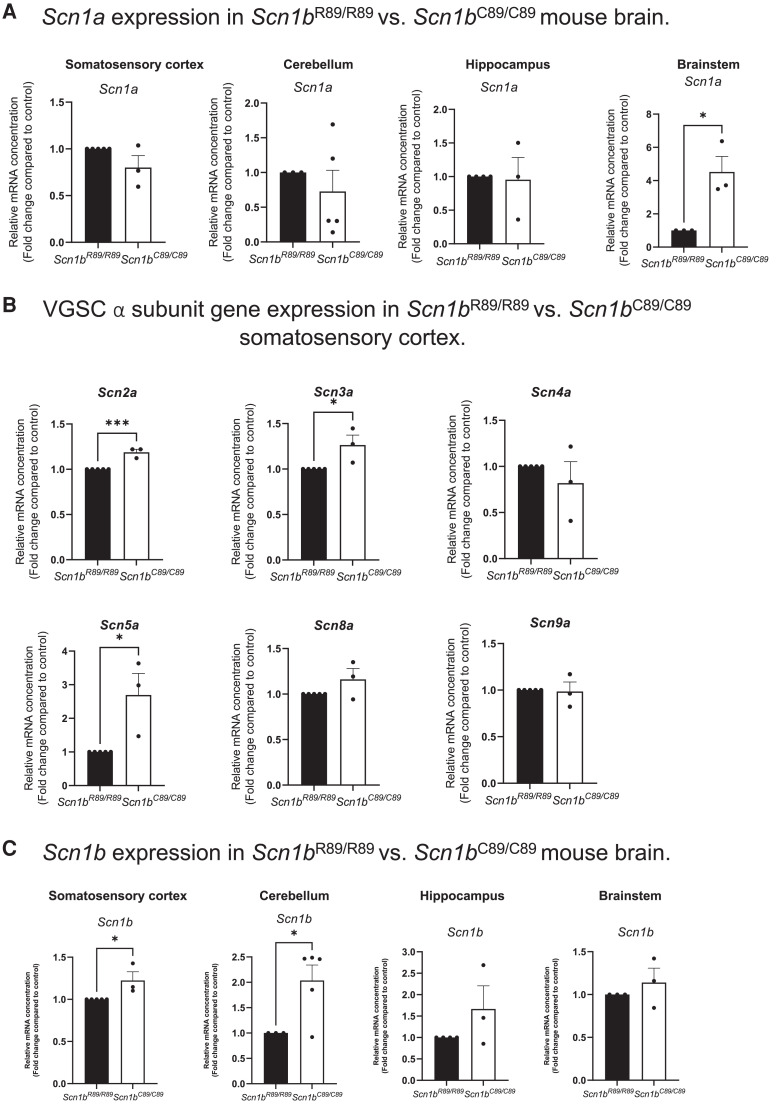
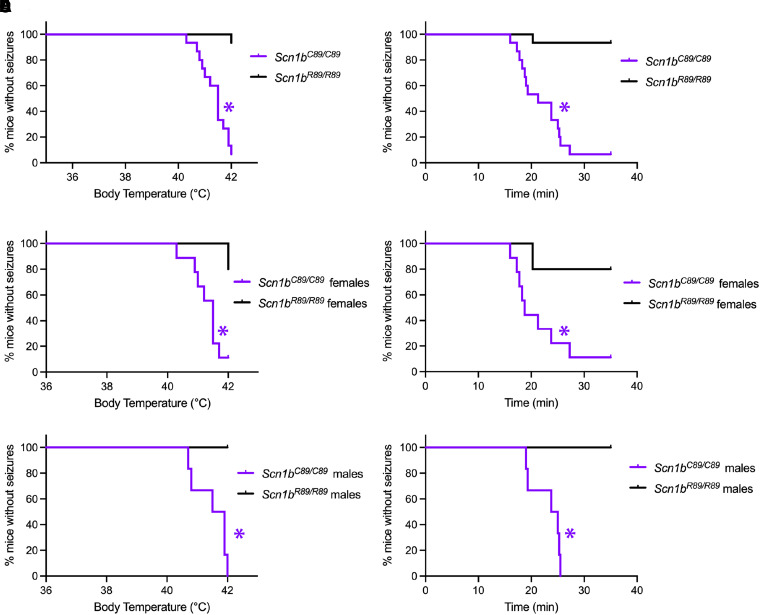
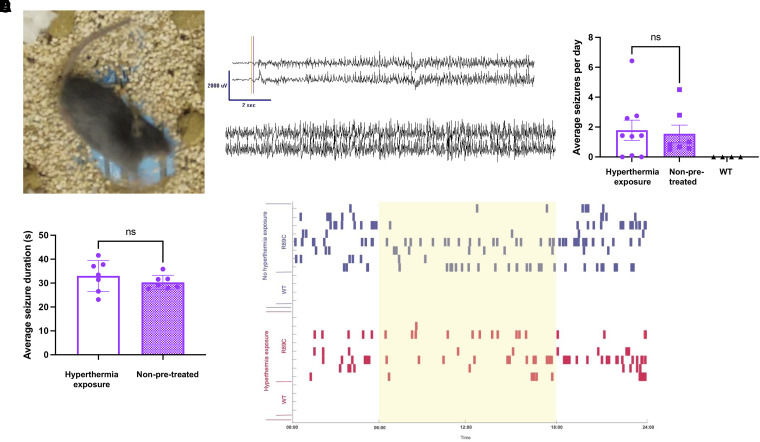
Voltage-gated sodium channel β1 subunits are essential proteins that regulate excitability. They modulate sodium and potassium currents, function as cell adhesion molecules and regulate gene transcription following regulated intramembrane proteolysis. Biallelic pathogenic variants in SCN1B, encoding β1, are linked to developmental and epileptic encephalopathy 52, with clinical features overlapping Dravet syndrome. A recessive variant, SCN1B-c.265C>T, predicting SCN1B-p.R89C, was homozygous in two children of a non-consanguineous family. One child was diagnosed with Dravet syndrome, while the other had a milder phenotype. We identified an unrelated biallelic SCN1B-c.265C>T patient with a clinically more severe phenotype than Dravet syndrome. We used CRISPR/Cas9 to knock-in SCN1B-p.R89C to the mouse Scn1b locus (Scn1bR89/C89). We then rederived the line on the C57BL/6J background to allow comparisons between Scn1bR89/R89 and Scn1bC89/C89 littermates with Scn1b+/+ and Scn1b-/- mice, which are congenic on C57BL/6J, to determine whether the SCN1B-c.265C>T variant results in loss-of-function. Scn1bC89/C89 mice have normal body weights and ∼20% premature mortality, compared with severely reduced body weight and 100% mortality in Scn1b-/- mice. β1-p.R89C polypeptides are expressed in brain at comparable levels to wild type. In heterologous cells, β1-p.R89C localizes to the plasma membrane and undergoes regulated intramembrane proteolysis similar to wild type. Heterologous expression of β1-p.R89C results in sodium channel α subunit subtype specific effects on sodium current. mRNA abundance of Scn2a, Scn3a, Scn5a and Scn1b was increased in Scn1bC89/C89 somatosensory cortex, with no changes in Scn1a. In contrast, Scn1b-/- mouse somatosensory cortex is haploinsufficient for Scn1a, suggesting an additive mechanism for the severity of the null model via disrupted regulation of another Dravet syndrome gene. Scn1bC89/C89 mice are more susceptible to hyperthermia-induced seizures at post-natal Day 15 compared with Scn1bR89/R89 littermates. EEG recordings detected epileptic discharges in young adult Scn1bC89/C89 mice that coincided with convulsive seizures and myoclonic jerks. We compared seizure frequency and duration in a subset of adult Scn1bC89/C89 mice that had been exposed to hyperthermia at post-natal Day 15 versus a subset that were not hyperthermia exposed. No differences in spontaneous seizures were detected between groups. For both groups, the spontaneous seizure pattern was diurnal, occurring with higher frequency during the dark cycle. This work suggests that the SCN1B-c.265C>T variant does not result in complete loss-of-function. Scn1bC89/C89 mice more accurately model SCN1B-linked variants with incomplete loss-of-function compared with Scn1b-/- mice, which model complete loss-of-function, and thus add to our understanding of disease mechanisms as well as our ability to develop new therapeutic strategies.

Keywords: SUDEP; developmental and epileptic encephalopathy; seizure; sodium channel; β subunit.


Conflict of interest statement

The authors report no competing interests.

Figures

Graphical abstract
Graphical abstract
Figure 1
Figure 1
Generation and characterization of Scn1bR89/C89 mice. (A) Known disease variants in VGSC β1 and β1B subunits. Adapted from O’Malley et al. Yellow: variants associated with epilepsy. White: variants associated with epilepsy and cardiac arrhythmia. Red: variants associated with sudden cardiac death. Residue R89, yellow, is located within the Ig loop domain of β1 and β1B and is evolutionarily conserved throughout vertebrate VGSCs (GeneCards The Human Gene Database, https://media.githubusercontent.com/media/aminodektc/70/master/SCN1B/SCN1B.png). (B) sgRNAs were complexed with ESPCas9 protein and injected into fertilized mouse eggs. A DNA genomic fragment spanning the expected Cas9 cut site was PCR amplified and sequenced analysis. Cas9-induced double-strand breaks resulted in the presence of superimposed sequences (peaks-on-peaks) starting near the expected Cas9 cut site. sgRNA C130G1 produced indel mutations in three of five test blastocysts. Arrow: Cas9 cut site. Blue-shaded nucleotides: sgRNA target. (C) Representative genotyping experiment in which two separate PCRs were run for each tail DNA for Scn1bR89/R89, Scn1bR89/C89 and Scn1bC89/C89 pups to detect WT and mutant Scn1b bands, respectively. Lanes 1, 4, 6 and 7: Scn1bR89/C89 and show both WT and mutant bands (squares); Lanes 2 and 5: Scn1bR89/R89 and show WT bands only (circles); Lanes 3 and 8: Scn1bC89/C89 and show mutant bands only (arrows). (D) Upper: Comparison of littermate P19 Scn1bR89/R89 and Scn1bC89/C89 animals. Lower: Comparison of Scn1bR89/R89 (N = 3), Scn1bR89/C89 (n = 5) and Scn1bC89/C89 (n = 5) male and female weights from P9 to P21. No significant differences between genotypes (mean +/− SD, one-way ANOVA). (E) Left: Comparison of whole brain weights per genotype at P21 showing no statistical differences (mean +/− SD, one-way ANOVA). Right: Comparison of acutely dissected brains of littermate Scn1bR89/R89, Scn1bR89/C89 and Scn1bC89/C89 animals at P21. (F) Kaplan–Meier analysis of life span shows that ∼20% of Scn1bC89/C89 animals die by P60. Dotted purple line: Scn1bC89/C89 animals pre-treated with hyperthermia at P15 and then allowed to develop (n = 15). Solid purple line: non–pre-treated Scn1bC89/C89 animals (n = 16). Solid black line: non–pre-treated Scn1bR89/R89 animals (n = 31). No significant differences between pre-treated and non–pre-treated groups (ns, Log-rank Mantel–Cox test). Male and female animals were included in each group. Original, uncropped blots shown in Supplementary Fig. 1. (G) Expression of β1 polypeptides in P60-90 Scn1bR89/R89 and Scn1bC89/C89 brains. Lanes 1–4: Scn1bC89/C89. Lanes 5–8: Scn1bR89/R89. Odd numbered samples are untreated and thus glycosylated. Even numbered samples were deglycosylated with PNGaseF. (H) Densitometric quantification of deglycosylated β1 polypeptides from Scn1bR89/R89 (β1-R89) and Scn1bC89/C89 (β1-C89) brains. Deglycosylated β1 (∼22 kDa) immunoreactive bands were normalized to loading control anti–α-tubulin signal. n = 4 Scn1bR89/R89 and 4 Scn1bC89/C89 samples. No significant differences between groups (mean +/− SEM, P = 0.2, unpaired t-test).
Figure 2
Figure 2
β1 and β1-p.R89C polypeptides localize to the plasma membrane and are substrates for RIP in heterologous cells. (A) Cell surface biotinylation shows that β1-p.R89C localizes to the plasma membrane similarly to WT β1, indicated by the presence of β1-p.R89C-V5 and β1V5 in the total cell lysate (T) and PM fraction. Total protein and neutravidin-selected cell surface proteins were analysed by western blot with anti-V5 antibody. Anti-HSP90 antibody was used as a control to ensure biotinylation of cell surface but not intracellular proteins. Anti-transferrin receptor (TfR) antibody was used as a control to ensure that only cell surface proteins were pulled down in the neutravidin selection. n = 3. β1 immunoreactive bands are indicated at ∼37 kDa and above, representing various levels of avidin attachment, as shown in our previous work. Original, uncropped blots shown in Supplementary Fig. 2. (B) Left: Cartoon summarizing β1 RIP by BACE1 and γ-secretase as well as γ-secretase inhibition by small molecules. Right: CHL cells stably expressing β1V5 or β1-p.R89C-V5 were used in cleavage assays to determine whether β1-p.R89C undergoes RIP similar to WT β1. Treatment with γ-secretase inhibitor, Avagacestat (10 μM) or L-685,458 (10 μM), for 24 h resulted in accumulation of the β1-CTF (∼20 kDa, arrow) in both cell lines, indicating cleavage of β1. Results are representative of three independent experiments. Original, uncropped blots shown in Supplementary Fig. 3.
Figure 3
Figure 3
β1-p.R89C modulates Nav1.6-generated INa density. HEK cells stably expressing human Nav1.6 were transiently co-transfected with β1-WT-V5-2AeGFP (dark blue) β1-p.R89C-V5-2AeGFP (purple), or eGFP (light blue). Cells transfected with eGFP were used as negative controls. (A) Representative INa density traces. (B) Nav1.6 INa current–voltage relationship. (C) INa density was increased with co-expression of WTβ1 or β1-p.R89C. (D) No differences in the mean voltage-dependent activation and inactivation curves were observed. (E) Recovery from inactivation was expressed as the fraction of current produced by a second pulse over time following an identical pre-pulse. The data were fit to a double exponential function. Data in (B), (C), (D), and (E) are presented as means ± SEM. **P < 0.01, *P < 0.05 by a one-way ANOVA with Tukey’s post hoc comparison test. Dots represent individual cells. Voltage-dependence of activation and voltage-dependence of inactivation, n = 17 (eGFP alone), 16 (+β1), 14 (+β1-p.R89C); recovery from inactivation, n = n = 8 (eGFP alone), 6 (+β1), 6 (+β1-p.R89C).
Figure 4
Figure 4
Differential VGSC α and β subunit expression in P15-18 Scn1b+/+ and Scn1b−/− mouse brains. (A) Scn1a and Nav1.1 expression in Scn1b+/+ (WT) versus Scn1b−/− (null) mouse brain. Scn1a gene expression was significantly decreased in null somatosensory cortex (*P < 0.001); however, no changes in Scn1a were detected in the cerebellum, hippocampus or brainstem (P > 0.05). Bottom panel: Nav1.1 protein expression was significantly decreased in Scn1b null mouse whole brain membranes compared with WT whole brain. Left: Quantification of anti-Nav1.1 immunoreactive bands normalized to corresponding anti-TfR bands for Scn1b WT versus null brains for the blot shown on the right. Data are represented as means ± SEM for three WT and three null brains, respectively. Statistical significance was determined using Student’s t-test (*P < 0.01). Right: Western blot analysis of Nav1.1 protein in Scn1b null and WT whole brain membranes, as indicated. Upper blot: anti-Nav1.1. Lower blot: anti-TfR. Molecular weight markers are indicated. (B) VGSC α subunit gene expression in WT versus null somatosensory cortex. No changes were detected in the relative expression of Scn2a, Scn3a, Scn4a, Scn5a, Scn8a or Scn9a between null and WT somatosensory cortex (P > 0.05). (C) Confirmation of Scn1b deletion in WT versus null mouse brain. Relative expression of Scn1b in null and WT mouse somatosensory cortex, cerebellum, hippocampus and brainstem (P < 0.0001). Statistical significance was determined using Student’s t-test (P-value < 0.05). Data are represented as the mean ± SEM. WT: n = 3–5, null: n = 3–5. Male and female mice were used in all experiments (A and B).
Figure 5
Figure 5
Differential VGSC α and β subunit mRNA expression in P15-18 Scn1bR89/R89 and Scn1bC89/C89mouse brains. (A) Scn1a expression in Scn1bR89/R89 versus Scn1bC89/C89 mouse brain. Relative expression of Scn1a in Scn1bR89/R89 versus Scn1bC89/C89 mouse somatosensory cortex, cerebellum, hippocampus and brainstem. Scn1a gene expression was significantly increased in Scn1bC89/C89 brainstem compared to Scn1bR89/R89 (P < 0.05); however, there was no change in Scn1a mRNA between genotypes in the cortex, cerebellum or hippocampus. (B) VGSC α subunit gene expression in Scn1bR89/R89 versus Scn1bC89/C89 somatosensory cortex. Relative expression of Scn2a, Scn3a, Scn4a, Scn5a, Scn8a and Scn9a in Scn1bR89/R89 versus Scn1bC89/C89 somatosensory cortex. Scn2a (P < 0.001), Scn3a (P < 0.05) and Scn5a (P < 0.05) were significantly increased in Scn1bC89/C89 cortex compared with Scn1bR89/R89. Scn4a, Scn8a and Scn9a mRNA expression was not different between genotypes (P > 0.05). (C) Scn1b expression in Scn1bR89/R89 versus Scn1bC89/C89 mouse brain. Relative expression of Scn1b in Scn1bR89/R89 versus Scn1bC89/C89 mouse somatosensory cortex, cerebellum, hippocampus and brainstem. Scn1b gene expression was significantly increased in Scn1bC89/C89 cortex (P < 0.05) and cerebellum (P < 0.05) compared with Scn1bR89/R89, however, there was no change in the hippocampus or brainstem. Statistical significance was determined using Student’s t-test (P < 0.05). Data are represented as the mean ± SEM. Scn1bR89/R89: n = 3–5, Scn1bC89/C89: n = 3–5. Male and female mice were used in all experiments.
Figure 6
Figure 6
Scn1bC89/C89 mice are more susceptible to hyperthermia-induced seizures than Scn1bR89/R89 littermates at P15. Behavioural seizures were observed and recorded by an investigator blinded to genotype. Seizures were induced as described in Methods. Kaplan–Meier curves showing first observed seizure for all mice (female and male) (A), for female mice only (C), or for male mice only (E) in relation to temperature. Survival curves to first observed seizure for all mice (B), for female mice only (D), or for male mice only (F) in relation to time. For all panels: Scn1bR89/R89 mouse data = black; Scn1bC89/C89 mouse data = purple. The numbers of mice used were: Scn1bR89/R89 n = 15 (5 female and 10 male), Scn1bC89/C89 n = 15 (9 female and 6 male). *P < 0.05 (Log-rank Mantel–Cox test).
Figure 7
Figure 7
Scn1bC89/C89 mice have spontaneous generalized seizures. (A) Still photo from Video 1 showing a spontaneous generalized seizure in a Scn1bC89/C89 mouse. (B) EEG trace showing a generalized seizure in a Scn1bC89/C89 mouse displayed in a referential montage of L parietal-Ref (top trace) and R parietal-Ref (bottom trace). (C) Average seizures per day in young adult (P60–90) Scn1bC89/C89 mice that were exposed to hyperthermia at P15 (clear bar, n = 8) versus mice that had no pre-exposure (purple bar, n = 8) versus Scn1bR89/R89 mice (WT, black symbols, n = 4). There was no significant difference between seizure frequency between hyperthermia exposure and non-pretreated groups (P = 0.80, unpaired t-test). (D) Average seizure duration in Scn1bC89/C89 mice that were pre-exposed to hyperthermia at P15 (clear bar, n = 8) versus mice that had no pre-exposure (purple bar, n = 8). There were no significant differences between groups (unpaired t-test). (E) Raster plot showing time of seizure occurrence for young adult Scn1bC89/C89 (R89C) or Scn1bR89/R89 mice (WT) mice during the light (yellow) and dark (white) cycles during the entirety of the recording period (8–14 days). Blue: Non-pretreated mice. Red: Mice that were pre-exposed to hyperthermia at P15.

References

    1. Brunklaus A, Feng T, Brunger T, et al. . Gene variant effects across sodium channelopathies predict function and guide precision therapy. Brain. 2022;145(12):4275–4286. - PMC - PubMed
    1. Dravet C, Bureau M, Oguni H, Fukuyama Y, Cokar O. Severe myoclonic epilepsy in infancy (Dravet syndrome). Adv Neurol. 2005;95:71–102. - PubMed
    1. Guerrini R, Aicardi J. Epileptic encephalopathies with myoclonic seizures in infants and children (severe myoclonic epilepsy and myoclonic-astatic epilepsy). J Clin Neurophysiol. 2003;20(6):449–461. - PubMed
    1. Claes L, Del-Favero J, Ceulemans B, Lagae L, Van Broeckhoven C, De Jonghe P. De novo mutations in the sodium-channel gene SCN1A cause severe myoclonic epilepsy of infancy. Am J Hum Genet. 2001;68(6):1327–1332. - PMC - PubMed
    1. Meisler MH, Kearney JA. Sodium channel mutations in epilepsy and other neurological disorders. J Clin Invest. 2005;115(8):2010–2017. - PMC - PubMed

LinkOut - more resources